Guided Exploration of Data Summaries
Abstract.
Data summarization is the process of producing interpretable and representative subsets of an input dataset. It is usually performed following a one-shot process with the purpose of finding the best summary. A useful summary contains individually uniform sets that are collectively diverse to be representative. Uniformity addresses interpretability and diversity addresses representativity. Finding such as summary is a difficult task when data is highly diverse and large. We examine the applicability of Exploratory Data Analysis (EDA) to data summarization and formalize Eda4Sum, the problem of guided exploration of data summaries that seeks to sequentially produce connected summaries with the goal of maximizing their cumulative utility. Eda4Sum generalizes one-shot summarization. We propose to solve it with one of two approaches: (i) Top1Sum that chooses the most useful summary at each step; (ii) RLSum that trains a policy with Deep Reinforcement Learning that rewards an agent for finding a diverse and new collection of uniform sets at each step. We compare these approaches with one-shot summarization and top-performing EDA solutions. We run extensive experiments on three large datasets. Our results demonstrate the superiority of our approaches for summarizing very large data, and the need to provide guidance to domain experts.
1. Introduction
The goal of data summarization is to produce a smaller and informative dataset (Wen et al., 2018; El Gebaly et al., 2014) from an input dataset. That is usually achieved by seeking interpretable and representative subsets of the input. Intuitively, a useful summary contains individually uniform sets that are collectively diverse to be representative (Yu et al., 2009a; Wen et al., 2018). Uniformity addresses interpretability as it allows to produce a description for each set, and diversity addresses representativity by seeking to cover data variety. This is particularly important for large and highly diverse datasets such as the Sloan Digital Sky Survey (SDSS), a database commonly used in the astrophysics community (SDS, 2021). SDSS includes galaxies that belong to classes defined by the Galaxy Zoo classification (Willett et al., 2013). In SDSS, each galaxy has attributes describing magnitude in each color filter (the attributes , and ), size (the attribute petroRad_r), and how far a galaxy is from the Earth (the attribute redshift). A single one-shot summary of SDSS is not representative. Indeed, today’s astrophysicists spend considerable time running SQL queries against the SkyServer database. Most of their time is spent in reformulating queries, searching for galaxy sets with similar properties or value distributions. In this paper, we investigate the applicability of Exploratory Data Analysis (EDA) to summarizing such large data.


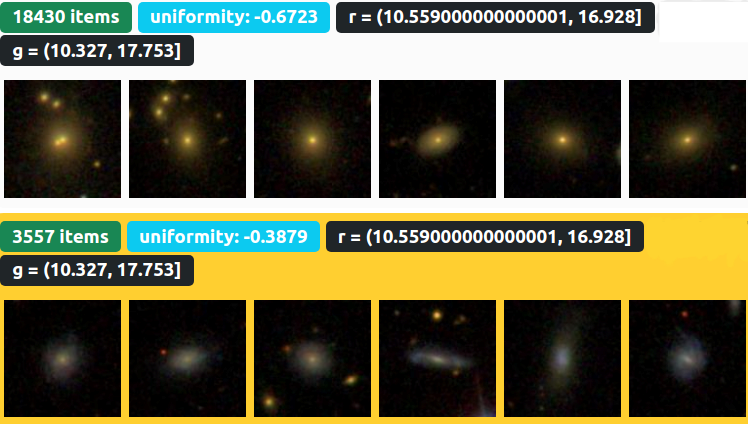
A summary can be defined as a diverse set of sets of items (referred to as itemsets), each of which is uniform, i.e., it contains items that are similar to each other. Itemsets are different from each other, leading to a diverse summary. Figure 1 shows examples of uniform and non-uniform itemsets of galaxies derived from SDSS. One can see that uniform itemsets are easier to interpret by humans. Users may not be easy to consume a large amount of information in one step (i.e., shot). Thus, a one-shot summarization approach that leverages a diversity algorithm to find the top- most uniform and diverse sets appears as a natural solution. For instance, SWAP, a common diversity algorithm (Yu et al., 2009a) would greedily finds most diverse itemsets subject to a threshold on utility (uniformity in this case) and is shown to enjoy good approximation guarantees. However, with a large and diverse dataset, a one-shot summary may not suffice to cover the variety of itemsets in the database. For instance, in the case of SDSS, even a summary of 10 itemsets would not cover the 169 galaxy types it contains. In fact, with all diversity algorithms (SWAP (Yu et al., 2009a), MMR (Carbonell and Goldstein, 1998), and GMM (Gonzalez, 1985)), there is a tension between displaying uniform itemsets and covering data variety. This motivates the use of EDA for data summarization.
Rather than aiming to cover the entire data in a single one-shot summary (Chandola and Kumar, 2007; Kim et al., 2020), we seek to tackle a more general problem that adopts a multi-shot approach to summarization where each step produces the most uniform and diverse itemsets, and the collection of steps forms a connected set of summaries. To achieve that, we must address two challenges: define summary utility as a function of uniformity and diversity, and make sure the generated summaries at each step are both new and related to previous summaries, to preserve the train of thought of the user (Shahaf and Guestrin, 2011). This gives rise to the Eda4Sum Problem that seeks to find a sequence of summaries whose cumulated utility is maximized (Section 3). While some datasets are largely uniform, others contain more diversity. Therefore, we need to make sure our optimization function provides tunable weights for uniformity and diversity. Generated summaries are operation-driven - unlike previous work where summaries are data-driven (Wen et al., 2018). Each step is triggered by an EDA operator that takes an itemset (from the current summary) and returns (at most) itemsets (i.e., a summary). The pipeline has a fixed length, and when it is equal to 1, the problem reduces to a one-shot summarization. We prove that the Eda4Sum Problem is NP-hard by a reduction to the Heaviest Path problem in a weighted directed graph (Schrijver, 2003). Thus there is a need for efficient and scalable algorithms to solve it.
We bootstrap a summarization pipeline by running the SWAP algorithm. Thus, for a one-shot summary (i.e., summarization pipeline of length ), EDA4Sum reduces to SWAP. Other one-shot summarization algorithms could be used to generate the first step. For subsequent steps, we propose Top1Sum and RLSum, two adaptations of existing algorithms. At each step, the algorithm picks one of the itemsets returned by the previous step and chooses which operator to execute on that itemset, resulting in a new summary. Top1Sum is a greedy algorithm that chooses to return the highest utility summary at each subsequent step. Following existing work in EDA (El et al., 2020; Seleznova et al., 2020; Personnaz et al., 2021a) we investigate the applicability of Deep Reinforcement Learning to summarization. We design RLSum, an adaptation of Deep Reinforcement Learning to simulate an agent that learns an end-to-end summarization policy as a sequence of EDA operators that yield the highest reward.
We ran experiments on three large and different datasets. We examined the utility of returned summarization pipelines and found that in most cases (and as expected), Top1Sum returns higher utility summaries than RLSum. However, RLSum is at least one order of magnitude faster than Top1Sum. A specific use case also showed that RLSum performs better than Top1Sum in finding ground-truth itemsets. We also examine the use of different EDA operators in building summarization pipelines. We find that the traditional drill-down and roll-up operators are not suffice for finding useful summaries, especially in SDSS that requires more expressive operators to cover the variety of galaxy types. We also ran an experiment to validate our reward function and found that it outperforms baseline DRL with familiarity and curiosity (Personnaz et al., 2021a). Finally, an investigation with two domain expert astronomers who are familiar with SDSS revealed the benefit of using partial guidance for summarization.
2. Related Work
We refer to our system as EDA4Sum. Table 1 summarizes the differences between EDA4Sum and previous work. Columns in bold highlight our novelty, namely: EDA4Sum enables generating a multi-step summarization pipeline. Each summary in this pipeline is connected to the previous summary. This is done by applying exploration operators which dictate the next summary to be displayed. EDA4Sum also enables fully automate generation of summarization pipelines. We now describe multiple lines of work that are relevant to ours.
| Related Work | Pipeline | Recommendation | Guidance | ||||
| One-Shot | Multi-Step | Data-Driven | Operation-Driven | Hands-Free | Connected | ||
| EDA | (Amer-Yahia et al., 2021a, b; Bar El et al., 2020a; Seleznova et al., 2020) | ✓ | ✓ | ✓ | ✓ | ||
| (Personnaz et al., 2021a, b) | ✓ | ✓ | ✓ | ✓ | |||
| (Milo and Somech, 2018; Joglekar et al., 2017; Siddiqui et al., 2016; Amer-Yahia et al., 2017; Wongsuphasawat et al., 2015) | ✓ | ✓ | ✓ | ||||
| (Lee et al., 2019) | ✓ | ✓ | |||||
| (Dibia and Demiralp, 2019) | ✓ | ✓ | ✓ | ||||
| Summarization and Explanation | (Wen et al., 2018; Vollmer et al., 2019; El Gebaly et al., 2014; Agarwal et al., 2007; Sarawagi, 1999) | ✓ | ✓ | ✓ | |||
| (Yu et al., 2009a) | ✓ | ✓ | ✓ | ||||
| (Kim et al., 2020) | ✓ | ✓ | ✓ | ✓ | |||
| EDA for Summarization | EDA4Sum | ✓ | ✓ | ✓ | ✓ | ✓ | ✓ |
One-shot data summarization: A large variety of approaches have been proposed for summarizing data (Kim et al., 2020). Prominent examples include approaches based on the Minimum Description Length (Bu et al., 2005; Lakshmanan et al., 2002a), approaches that identify extreme aggregates (Wen et al., 2018; Sathe and Sarawagi, 2001), methods that summarize all aggregates (Lakshmanan et al., 2002b), and works that produce diverse clusters showing common properties in the data (Roy et al., 2010). Unlike our work, all the methods mentioned above consider data summarization as a one-shot task.
Approaches that summarize all data typically trade-off summary size against information loss (Kim et al., 2020). As mentioned in the Introduction, in cases where the data size is massive, finding the most uniform and diverse parts is helpful. Thus, unlike previous works, since our goal is not to summarize the entire input, we do not measure summary quality in terms of information loss. Therefore, we define summarization as the task of finding the most uniform and diverse subsets of the data. A natural solution to this definition is to leverage diversity algorithms such as SWAP (Yu et al., 2009a), MMR (Carbonell and Goldstein, 1998), GMM (Gonzalez, 1985), and QAGView (Wen et al., 2018). However, as discussed in the Introduction, there is a tension between displaying sets and covering variety in data.
Result diversification: Result diversification is well-studied in query answering in databases (Qin et al., 2012), search engines (Gollapudi and Sharma, 2009; Guy et al., 2021) and recommender systems (Yu et al., 2009b). This problem aims to return results that take both utility and diversity into consideration (Drosou et al., 2017). In many cases, diversity comes at the cost of utility (Ziegler et al., 2005; Qin et al., 2012). A common approach to measuring diversity, which we also adopted in our work, relies on pairwise similarities (Fraternali et al., 2012; Qin et al., 2012). The main departure from previous work is that we also account for novelty among itemsets selected in previous steps, and the that the score of novelty may change along the summarization pipeline (see Section 5.1).
Multi-step data exploration: Data exploration is a multi-step process whose goal is to extract insights from data (Milo and Somech, 2018; Marcel et al., 2019; Zhou et al., 2020). Guiding users in performing data exploration is a well-studied task (Friedman and Tukey, 1974; Bar El et al., 2020a; Amer-Yahia et al., 2021a). Numerous works proposed next-step recommendations (Milo and Somech, 2018; Eirinaki et al., 2014; Dimitriadou et al., 2016; Huang et al., 2018; Amer-Yahia et al., 2021b). Novel operators for interactively exploring data and discover interesting sets of tuples were introduced in (Joglekar et al., 2017; Lee et al., 2019).
As opposed to this line of work whose goal is to extract general insights, our goal is to summarize massive datasets by detecting highly uniform and diverse itemsets. Also, as can be seen in Table 1, our next-step recommendations are operation-driven - unlike previous work where recommendations are data-driven. This allows generating pipelines that exploit semantic relationships between data regions and preserve the train of thought of the user (Shahaf and Guestrin, 2011).
ML for data exploration: Recent work suggested to automate data exploration using Reinforcement Learning (Bar El et al., 2020a; Seleznova et al., 2020; Personnaz et al., 2021a, b). EDA4Sum adopts a similar approach to provide guidance to users with no need for training data. The logic of our RLSum algorithm is based on the system presented in (Personnaz et al., 2021a, b) that guides users in finding items of interest in large datasets. In this system, the process is driven by data familiarity and curiosity. Unlike (Personnaz et al., 2021b), RLSum does not require an extrinsic reward, alleviating the need for labeled data or prior knowledge. Moreover, in RLSum the iterative summarization process is driven by uniformity, diversity, and novelty.
3. Data Model
We consider a set of items described with a set of (numerical or categorical) ordinal attributes . Without loss of generality, we will use SDSS to illustrate our data model. Numerical attribute values are assumed to be binned into a fixed number of bins. Each item is represented as a vector, denoted as , where an entry is the value of for an attribute .
Following (Seleznova et al., 2020), we use the notion of itemset defined as a set of items that share the same values for a set of attributes. Those attributes define the itemset description that has the benefit of conveying the content of the itemset at a glance. denotes the set of all itemsets created from . We note that itemsets may overlap. To illustrate, Figure 1 contains examples of galaxy itemsets along with their descriptions. We represent each itemset with a vector that computes the aggregated values of items in for each attribute in . The value of each vector entry is computed as the mean of the values of its corresponding attribute in the itemset. Other aggregations could be used (e.g., median for ordinal attributes).
3.1. Data Summaries
A summary is a set of (at most) itemsets in , where is a system parameter. Intuitively, a useful summary contains itemsets consisting of similar items (uniformity), and where itemsets are pairwise different from each other (diversity). Since our aim will be to generate multi-step summaries, an important question is to what extent the current step’s summary displays new itemsets when compared to previous steps’ summaries (novelty). To that end, we define the notions of uniformity, diversity and novelty of a summary, to be used to define the utility of a summary.
Uniformity of a summary measures how similar items are to each other in each of its itemset. We first define the uniformity of an itemset. Let denote the variance of items in an itemset w.r.t. an attribute , where is some variance measure:
The uniformity of a summary of itemsets is given by:
The diversity of a summary, denoted as , is defined as:
where is the distance between itemsets and .
Let denote the set of all itemsets seen by the user. Initially, . Whenever an itemset is displayed, we add it to the set . Intuitively, the novelty of a summary captures the proportion of how many new itemsets the user is currently seeing. The novelty of a summary is defined as: .
Our objective is to balance uniformity, diversity, and novelty. Following common approaches for results diversification (Fraternali et al., 2012; Carbonell and Goldstein, 1998), we propose a parameterized objective which enables users to specify their desired balance. The utility of a summary is denoted as , and is defined as follows:
| (1) |
where are system parameters, and .
We examined the impact of these parameters on the results, determining the ranges in which no change in performance was observed. We found that with a slight change of the parameters values, the cumulated utility is unaffected. Thus, to allow for a user-friendly use of EDA4Sum, we reduced the space of all possible combinations of values for the parameters , and by allowing each parameter to take either a low, medium, or a high value. We consider the following four combinations of values: (i)-(iii) one of the parameters is set to a high value with the rest assigned to low; (iv) all parameters are set to have a medium value.
While some datasets are largely uniform, others contain more diversity. Therefore, we need to make sure our optimization function provides tunable weights for uniformity, diversity and novelty.
3.2. Problem Statement
A single one-shot summary of a large dataset is not representative. We propose to examine the applicability of EDA to data summarization. We first define summarization pipelines whose aim is to generate connected summaries. At each step, the user sees a summary that is obtained by applying an exploration operator, , to an itemset chosen from a summary that was shown in the previous step. The application of an operator to generate the next summary helps understand links between consecutive summaries, and preserve the stream of consciousness of users (Shahaf and Guestrin, 2011). A summarization pipeline is a sequence of summaries, connected by exploration operators. In its general form, an operator, denoted as , takes an itemset and a number , and returns a summary formed by (at most) itemsets that are related to items in . The pipeline is bootstrapped with various diversity algorithms to start with a summary containing the most uniform and diverse sets. In Section 5.1, we describe the exploration operators we support.
Given a bound , the system produces a summarization pipeline of length . We define the utility of a step to be the utility of its resulting summary. The system needs to decides which summary to display at each step to maximize the cumulated utility. We refer to this question as the Eda4Sum Problem and formalize it as follows.
Problem 3.1 (The Eda4Sum Problem).
Given an input itemset and a bound on the number of steps , recommend a summarization pipeline of length with the highest cumulated utility, i.e., is maximized, and for every , the summary is obtained by applying an operator on an itemset from the summary .
We can prove that the Eda4Sum Problem is NP-hard by a reduction to the Heaviest Path problem in weighted directed graphs (Schrijver, 2003).
4. Algorithms
To address the Eda4Sum Problem, we develop Top1Sum and RLSum, two adaptations of well-known approaches. Our algorithms are integrated into a prototype system that is also called EDA4Sum.
Architecture of EDA4Sum
In the off-line phase, we preprocess the data and instantiate our set-based model. Equi-depth binning is applied to each attribute and we use the LCM closed frequent pattern mining algorithm (Uno et al., 2004) to generate (possibly overlapping) itemsets. Different Reinforcement Learning models are trained as explained in Section 4.2. In the online phase, we allow users to generate summarization pipelines following one of the modes: Manual where the system displays a summary at each step, and the user inputs the next itemset, operation and corresponding attributes to be applied to the chosen itemset; Partial Guidance where at each step, the system displays a summary and the the user may provide only part of the input for the next step (e.g., specifying solely the target itemset, or the operator to apply); Full Guidance where the system displays a -size summarization pipeline. Full and partial guidance rely on executing a summarization pipeline.
Pipeline execution starts by running the SWAP algorithm (Yu et al., 2009a) that finds the most uniform and diverse itemsets. Thus, for a summarization pipeline of length , EDA4Sum behaves exactly as the SWAP algorithm. The next steps executes one of Top1Sum or RLSum. The algorithm picks one of the itemsets returned by SWAP or the previous operator, and chooses which operator to execute on that itemset, resulting in a new summary. Top1Sum is a simple greedy-based algorithm that at each step chooses to apply an operator which results in the summary with highest utility. RLSum auto-generates summarization sessions using Deep Reinforcement Learning (DRL). This solution allows us to reduce computation time at runtime. The models are pre-trained, and the inference time to pick the best expected action is insignificant. In our experimental study we compare the results of Top1Sum and RLSum.
4.1. Top1Sum
The Top1Sum algorithm applies local optimization to find the operation that produces the highest utility summary at each step of the summarization pipeline. Intuitively, at each step, Top1Sum examines every possible next step, i.e., every (itemset, , attributes) combination (where the itemset is one of the itemsets the user is currently seeing), and executes the step that yields the summary with the highest utility. Formally, at every step, given a summary , Top1Sum chooses the summary s.t.:
, where is the operator applied on the itemset which results with the highest utility among all operators and input itemsets.
Top1Sum has no theoretical guarantees for the Eda4Sum Problem. Nevertheless, as our experimental study shows, Top1Sum works well in practice, and it is able to generate high utility summarization pipelines. We note that the main drawback of Top1Sum is its running times, which are relatively slow even if the itemset vectors are precomputed. The utility computation of next-step summaries could be parallelized to speed up computation.
4.2. RLSum
Following recent approaches that were proven to be useful for EDA (Bar El et al., 2020b; Seleznova et al., 2020; Personnaz et al., 2021a, b), we present a Deep Reinforcement Learning solution to find a high-utility summarization pipeline.
We model the Eda4Sum Problem as a Markov Decision Process (MDP) comprising a triple (, , ) where:
-
•
is a set of summarization states. Each state contains several itemsets referred to as ;
-
•
is a set of actions, where each action is a specific exploration function (with an input itemset picked from , and an optional attribute) and enables a transition between consecutive exploration states.
-
•
are rewards for transitioning from state to by applying exploration action .
We define a summarization policy as a mapping function from an summarization state to an action , where , and look for the policy maximizing expected reward such as:
| (2) |
where is a discount factor in , is the length of policy .
We model the reward of the action on the state as the utility value of . The RLSum algorithm finds a policy that maximizes the expected cumulative reward.
There are many methods for solving MDPs, including value iteration and policy iteration. It has been proved theoretically and empirically in (Pashenkova et al., 1996) that policy iteration is computationally more efficient and requires a smaller number of iterations to converge. Here we adapt model-free RL (Kaelbling et al., 1996; Seleznova et al., 2020; Bar El et al., 2020a; Sutton and Barto, 2018) with inputs as a policy iteration method which fits our proposed problem remarkably well in the absence of logs as training samples.
Deep Reinforcement Learning Algorithm. Model-free RL allows us to address the problem of finding a policy, i.e., a pipeline, that maximizes the discounted cumulative reward. Actor-critic methods combine policy gradient methods with a learned value function. Each learning episode contains action probabilities and values that get periodically updated as the agent learns from the environment based on the reward function. The policy (the actor) adjusts action probabilities based on the current estimated advantage of taking that action; the value function (the critic) updates this advantage based on the rewards such as: where is the expected reward function. Several workers run in parallel and update the actor and critic values. We train a worker as follows. We instantiate the environment interface for the worker with the utility weights defined for the training. For every operator execution step, an action is selected and executed, and the reward is computed. The value network learns a baseline state value to which the current reward estimate is compared to obtain the “advantage”. The policy network adjusts the log probabilities of the actions based on the advantage via the RL algorithm. We then train the policy with the newly computed advantage values and train the value function with the obtained reward. This process is completed in parallel by each worker.
5. Experimental Study
This section presents experiments that evaluate the effectiveness and efficacy of EDA4Sum. We aim to address the following research questions. Q1: How do Top1Sum and RLSum compare to each other and to SWAP w.r.t. the utility of found summaries? Q2: What is the response time of our algorithms? Q3: Is guidance in generating summarization pipelines needed?
5.1. Implementation Details
Our code is available at (git, 2022). EDA4Sum is available at (UI, 2022). All algorithms are implemented in Python 3.7. The experiments were executed on a PC with i7-9850H 2.6GHz and 16GB Ram memory.
We measure utility using the standard deviation measure. In case some attributes are categorical, other deviation measures, such as entropy, could be used without affecting our solution. To measure diversity, we use the Manhattan distance metric as the vector distance measure. Other vector distance metrics could be used with only minor modifications. To obtain comparable values, we used the scaling method that was presented in (Somech et al., 2019).
Evolving weights: There is a trade-off between uniformity, diversity, and novelty of a summary. Finding a highly uniform and diverse summary may come at the cost of returning a novel one. In different parts of the summarization pipeline, the user’s preferences may change. Suppose the user has seen in previous steps many itemsets. In this case, it is more important to return a uniform and diverse summary rather than a novel one. To capture this, we tested two evolving weights schemes: Increasing Novelty and Decreasing Novelty. For these schemes, the novelty weight is a function of the total number of itemsets, the number of seen itemsets, and the length of the pipeline. This weighting scheme will be compared to others, such as fixed-value weights (e.g., balanced weights). To safe space, we do not report the results of increasing or decreasing uniformity (resp., diversity), as decreasing novelty is almost the same as increasing or decreasing uniformity (resp. diversity).
RLSum implementation
We use a Tensorflow-based implementation of A3C (Mnih et al., 2016) as a policy learning method, a state-of-the-art DRL framework that has been shown to outperform other critic-based methods on a wide range of applications (Mnih et al., 2016). The appeal of A3C comes from its parallelized and asynchronous architecture: multiple actor-learners are dispatched to separate instantiations of the environment; they all interact with the environment and collect experience and asynchronously push their gradient updates to a central target network. The agents were trained on two servers with Intel Xeon processors, with 370GB and 126GB of RAM. Training took hours for episodes on SDSS and on SPOTIFY and FOOD, with steps per episode. Each agent used 6 workers in parallel; the update interval was set to 20 steps, and we concatenated three successive states for the LSTM layers.
Operators
We support the following exploration operators:
(1) by-facet(i,a) (drill-down): returns as many subsets of as there are combinations of values for the attribute ;
(2) by-superset(i) (roll-up): returns the smallest supersets of the input itemset ;
(3) by-distrib(i): returns itemsets whose attribute value distribution is similar to ;
(4) by-neighbors(i,a): returns itemsets that are distinct from the input itemset and that have the previous (smaller) and next (larger) values for attribute .
The by-distrib and by-neighbors operators were introduced in (Personnaz et al., 2021a, b) Given an itemset , the by-neighbors operator only changes the value of one attribute in the description of to obtain the neighboring itemsets, and by-distrib returns itemsets having similar distributions to . Thus, if applied on a uniform itemset, the by-distrib and by-neighbors operators would return itemsets that are (almost) as uniform as the input itemset. Also, by definition, both the by-facet and the by-superset operators return itemsets having different descriptions and items than that of the input itemset. Thus, it is more likely to find a diverse summary after applying one of these operators than the by-distrib and by-neighbors operators. Our experiments will examine those hypotheses.
5.2. Experimental Setup
| Dataset | —items— | —atts— | —itemsets— | —ground truth itemsets— |
| SDSS | M | |||
| SPOTIFY | ||||
| FOOD | 11, 762 | 11 | 226, 381 | 22 |
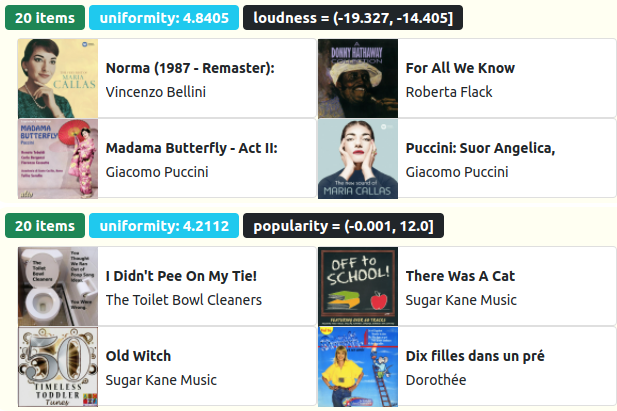
To demonstrate the applicability of EDA4Sum to multiple scenarios, we consider the following datasets. In all datasets, each column was binned into equi-depth bins. SDSS. SDSS (SDS, 2021)is a massive sky survey dataset containing images and metadata of astronomical objects. We selected M galaxies with clean photometry and spectral information. Each galaxy has attributes commonly used in Astronomy to describe information such as the magnitude in each color filter, and the size of an object. SPOTIFY Track DB. The SPOTIFY dataset is a publicly available Music database (Datasets, 2021). It contains information about over K music tracks. We have extracted the numerical attributes that describe the track valence, duration, danceability, etc. Figure 2 shows a screenshot of EDA4Sum with SPOTIFY songs. FOOD Data. The FOOD Data is a publicly available food nutrition facts dataset (foo, 2022). It contains information about over K food items. We have extracted numerical attributes that describe the item’s amount of calories, fat, protein, etc.
Itemsets
To build itemsets we use LCM, an implementation of the Apriori algorithm for frequent pattern mining (Uno et al., 2004). Each frequent pattern is described with attributes which are common to all items of the pattern. Hence each pattern forms an itemset where is the pattern itself. Here we used LCM with a support value of to generate itemsets whose size ranges from to galaxies (for SDSS), and with a support value of to generate itemsets whose size ranges from to music tracks (for SPOTIFY). For FOOD, we used a support value of to generate itemsets whose size ranges from to .
Ground-truth uniform itemsets
For each dataset, we define a set of (non-overlapping) uniform itemsets to be discovered by a summary. Those are referred to as ”ground-truth” itemsets. For SDSS, they correspond to well-known galaxy types extracted from the Galaxy Zoo Classification (Willett et al., 2013), covering less than 12% of the data. For SPOTIFY, they correspond to the partition of all music records by the attribute genre. The number of genres is . For FOOD, the ground truth itemsets correspond to the partition of all food records by the attribute food group. The number of food groups is . Importantly, we note that those itemsets are not necessarily the most uniform itemsets in each dataset. Other ground-truths could be defined. We will see in Section 5.3.1 how relevant the summaries we return are to our ground-truths.
Unless otherwise indicated, we set the number of steps to and the maximal size of a summary to .
Variants
One-shot summarization. We implemented the common SWAP algorithm (Yu et al., 2009a). The output of this algorithm is also the starting point of Top1Sum and RLSum. Multi-step summarization. Top1Sum The greedy algorithm described in Section 4.1. RLSum. The RL-based algorithm described in Section 4.2. To compare RLSum with existing EDA solutions, we included two additional RL-based baselines introduced in (Personnaz et al., 2021a): FAMO. A familiarity-only algorithm that mimics exiting EDA approaches, and 75FAM-25CUR for 75% familiarity and 25% curiosity. This algorithm achieves the best results for the EDA task presented in (Personnaz et al., 2021a). Manual. At each step, the user specifies the chosen itemset, operator and parameters, and the resulting summary is returned. This baseline serves to demonstrate the need for guidance in generating useful summaries.
For both Top1Sum and RLSum we have experimented with different weighting schemes (fixed or evolving weights) for the parameters and . We indicate high, balanced and low weight of a parameter with a suffix. For example, RLSum_BL with balanced weights on utility, diversity and novelty, and RLSum_LN with a low novelty weight. RLSum_IC (resp., RLSum_DC) denotes RLSum with an increasing (resp., decreasing) novelty weight.
5.3. Utility and Relevance to Ground-Truth (Q1)
In what follows we set the uniformity threshold of SWAP to . We examined the impact of this threshold on utility over all datasets. We found that lower thresholds return itemsets that have poor uniformity while higher thresholds return too few itemsets.
Results Summary
We summarize our main finding as follows:
As expected, the results clearly show that the Top1Sum variants produce
the highest utility values.
In particular, Top1Sum_HU achieves the highest cumulated utility in all datasets. This implies that to optimize utility, high weights for uniformity are required.
However, in terms of quality, we see that different variants, particularly RLSum variants, were performing better. This indicates that for different real-life scenarios, where the uniformity and diversity of the ground-truth itemsets varies, balancing uniformity, diversity, and novelty is required.
This motivates the need for a tunable objective function, where users can set the balance among uniformity, diversity, and novelty.
The results of FAMO and 75FAM-25CUR were inferior in terms of both utility and quality, showing that existing EDA solutions are ill-suited to our problem.

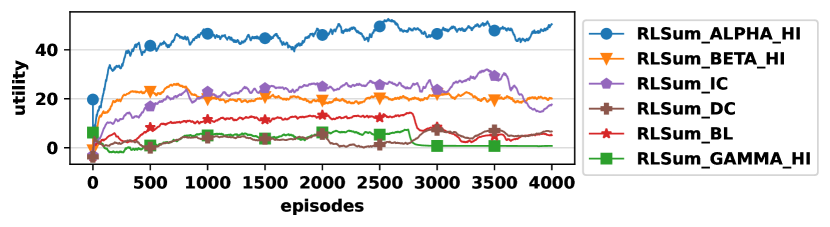
Evolution of utility during training. Figure 3 reports the training of our policies for different RLSum variants for SDSS. As can be seen, the agents are able to optimize and improve their utilities. Similar trends were observed on the other datasets as well.
5.3.1. Pipeline execution
. We recorded data on a pipeline execution in the Full Guidance mode for each baseline algorithm.
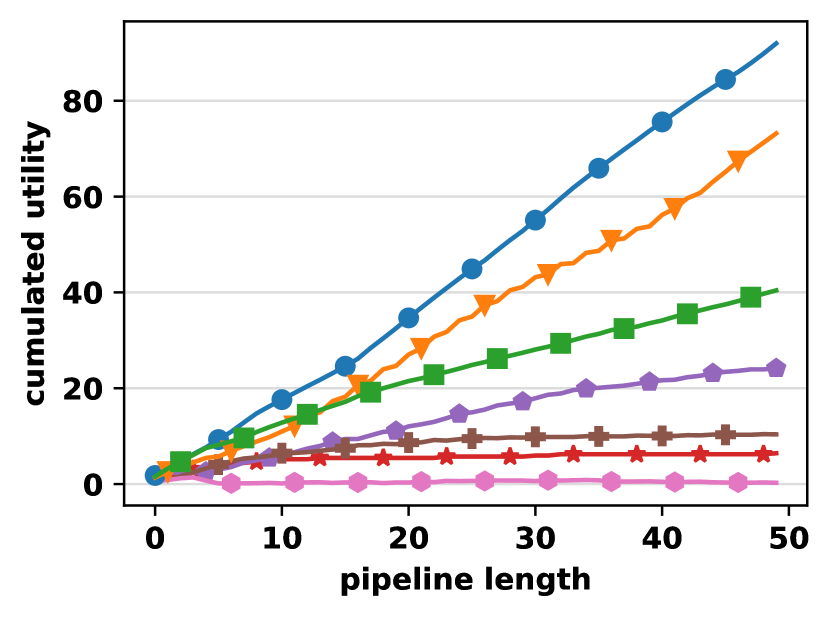
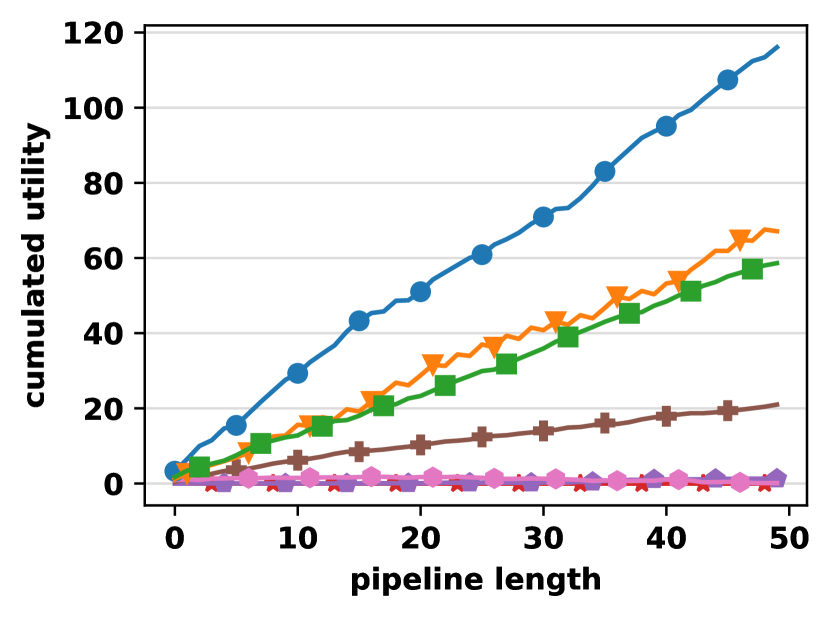
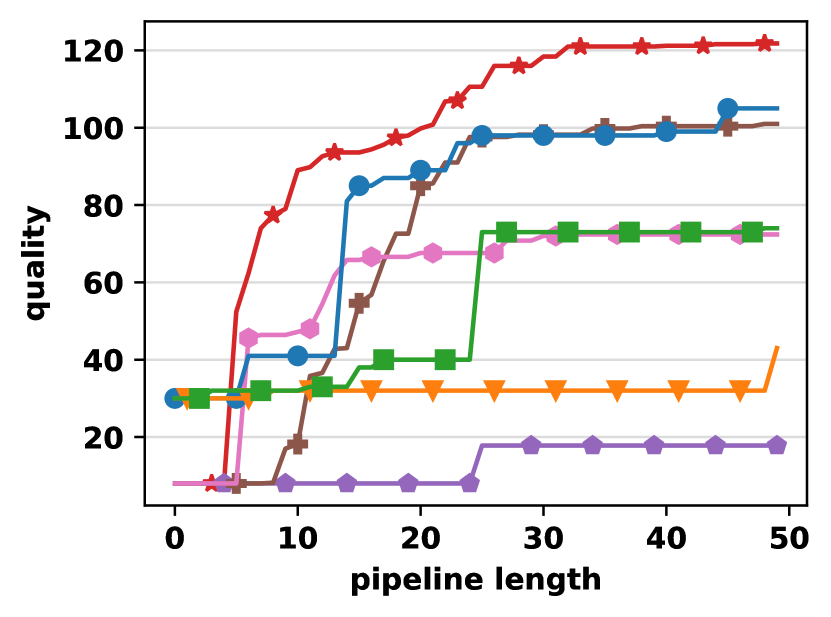
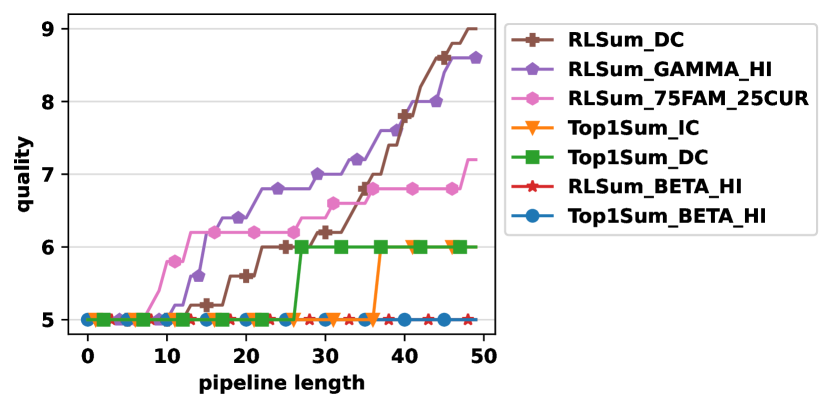
Utility during pipeline execution. Figure 4 shows the evolution of utility of the top-3 performing RLSum and Top1Sum variants with pipeline length. Other variants in which their results were inferior were omitted from presentation. As expected, the results clearly show that Top1Sum variants produce the highest utility values. The best performing variant in all datasets is Top1Sum_HU. In Food, the smallest dataset, RLSum_HU was also managed to generate high utility pipelines, but note that this was not the case for the larger datasets. Not surprisingly, the results of the EDA solutions (FAMO and 75FAM-25CUR) are inferior, as these baselines are optimized for a different task. We observe for all datasets that the difference between variants increases as the pipeline length increases.
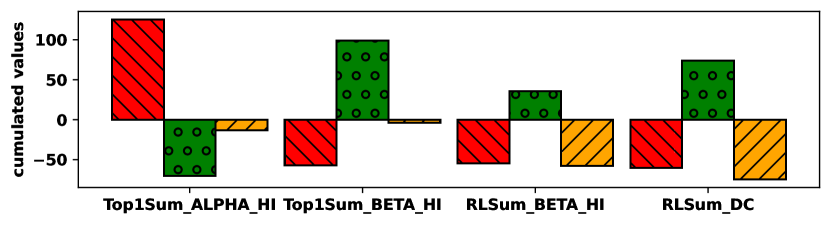
We dive into this comparison and plot the values of utility dimensions: uniformity, diversity and novelty (Figure 5) of the two best Top1Sum and RLSum variants. These scores could take negative values due to our scaling procedure (see Section 5.1). The results on FOOD showed similar trends. The first observation is that the weights assigned to these dimensions impact the performance of individual variants. This is quite apparent on Top1Sum variants where the value for each dimension reflects its weight (e.g., Top1Sum_HU yields the highest cumulated uniformity). We observe that the RLSum variants with a high novelty weight (e.g., RLSum_DC) achieve high diversity. Indeed, while novelty appears to be difficult to learn, trained agents compensate with other dimensions. This is appealing as it demonstrates the capability of RLSum variants to adapt to the dataset. This will be studied further when we will examine the relevance of found summaries to a ground-truth.
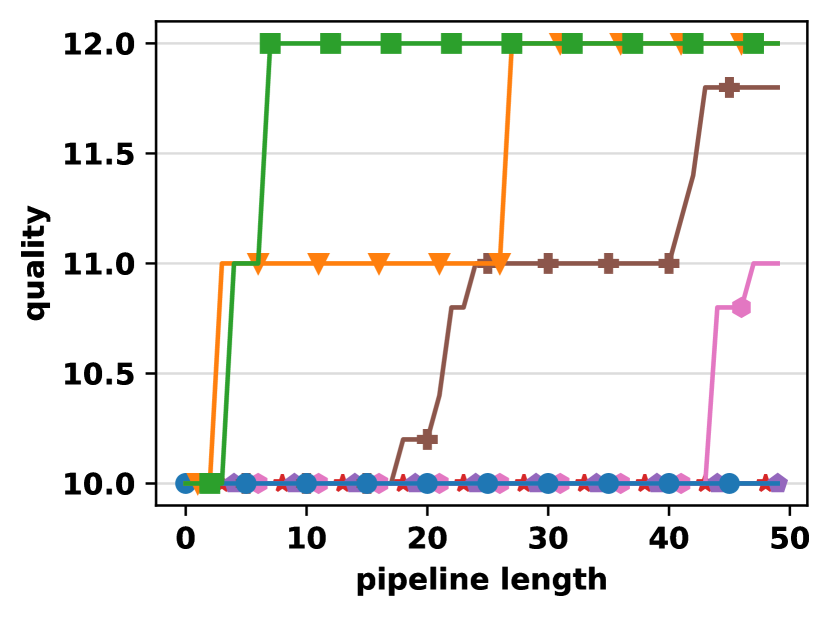
Discovering ground-truth itemsets. We now illustrate a use case that studies the relevance of obtained summaries, i.e., the number of discovered ground-truth itemsets. This clearly depends on the definition of ground-truth itemsets (e.g., in SPOTIFY these itemsets are not so uniform), and how similar they are to each other, which affects diversity. Figure 6 reports the cumulated relevance of itemsets found at each step during pipeline execution. Here again, to ease the presentation, we plot only the results of the top-3 variants of Top1Sum and RLSum that achieve the best results.
The first observation is that the variants that achieve the highest results in terms of utility (e.g., Top1Sum_HU) are not the ones with the highest relevance. The explanation is that ground truth itemsets are not necessarily the most uniform itemsets in the data. Furthermore, their diversity and uniformity levels vary across datasets. This warrants the need for a tunable objective where the user can set the weights of the utility dimensions according to her needs.
Our second observation is that despite Top1Sum outperforming RLSum when measuring utility, in many cases, RLSum outperforms Top1Sum when measuring relevance to a ground-truth. We can see that RLSum_DC performed well on all datasets. The intuition is that, to reach high relevance summaries, we need to start with a high novelty weight and decrease it as the pipeline is executed. The observed relevance results and the utility dimensions obtained by RLSum_DC suggest that high relevance summaries depend on either a mix of diversity and novelty, or on a very high level of diversity. While uniformity eases interpretability, reaching representativity of large datasets requires to favor diversity and novelty, two dimensions that EDA is designed to optimize. This experiment confirms the usefulness of EDA for summarizing large datasets.
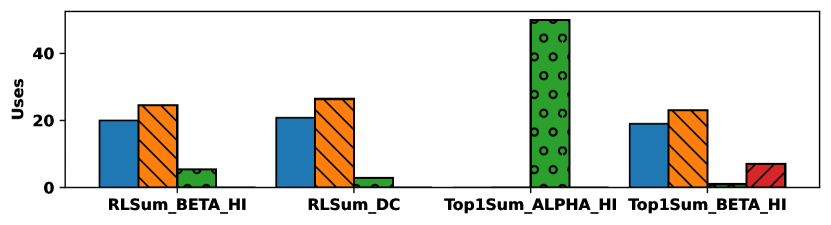
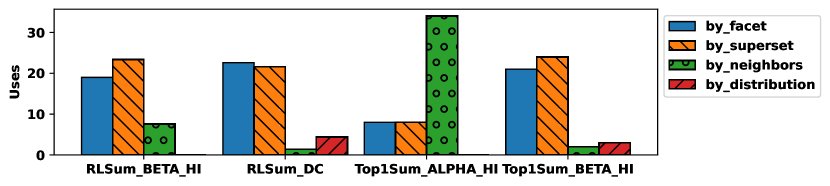
Impact of EDA operators. We examined the impact of using EDA4Sum with 2OP (by-facet and by-superset) vs. using all four operators. We report that in all cases, the results of the 2OP versions of both Top1Sum and RLSum were inferior to those achieved with all operators. This verifies the need in supporting expressive exploration operators that go beyond traditional drill-down and roll-up. Figure 7 reports the proportion of usage of each operator by each variant. Observe that RLSum_DC that attains high relevance on all datasets, mostly uses by-facet and by-superset that favor diversity and encourage finding new itemsets. Whereas Top1Sum_HU that attains high utility, mostly uses by-neighbors that favor uniformity. This is confirmed by Figure 5, where we can see that RLSum_DC achieves high diversity and Top1Sum_HU achieves high uniformity.
5.4. Scalability Evaluation (Q2)
The running time of a single step is measured between the time an operation is picked and the time a summary is displayed. All pipelines are executed in Full Guidance, and we report the average of executions. Table 3 reports results on SPOTIFY. Other datasets demonstrated similar trends. The running times of the EDA variants are the same as RLSum, and thus omitted. We compare between only two variants Top1Sum_HU and RLSum_DC (as the weights do not affect running times). As expected, the results clearly show that RLSum outperforms Top1Sum by one order of magnitude and that the difference between the two increases with data size, # attributes, and # bins. Since Top1Sum checks every itemset against each possible next operator to determine the highest utility results, its execution time depends on the number of itemsets returned by each operator. Increasing the number of bins increases resulting itemsets (e.g., more facets), leading to higher execution times. Interestingly, the performance of RLSum improves with a higher number of bins, as the number of mined itemsets reduces. These results confirm that RLSum is the method of choice for performing interactive summarization. Obviously, Top1Sum returns the highest utility summaries and may still be preferred given that RLSum comes at the cost of a long training time.
| Variant | Data size | # of attributes | # of bins | ||||||
| 23K | 115K | 233K | 3 | 7 | 11 | 5 | 10 | 20 | |
| Top1Sum | |||||||||
| RLSum | |||||||||
| Mode | —itemsets— | utility | uni. | diversity | novelty |
| Manual | |||||
| Partial Guidance | |||||
| Full Guidance |
5.5. Summarization Guidance (Q3)
To examine the benefit of guidance during summarization, we ran a user study and compared among all summarization modes.
We asked two astronomers from the Max Planck Institute of Astrophysics and who are highly familiar with SDSS, to use EDA4Sum. The request was to find as many well-known galaxies as possible from the galaxy types in Galaxy Zoo. The pipeline length was fixed to . The first astronomer was asked to use EDA4Sum with the Manual mode, and the second used the Partial Guidance mode (with RLSum_DC). We recorded their pipelines and compared the results with a pipeline generated by Full Guidance. Table 4 report for each pipeline, the number of ground-truth itemsets discovered, as well as their cumulated utility and its three dimensions.
We observe that EDA4Sum with partial guidance outperforms the other two modes. Additionally, our astronomers clearly favored the sequence of connected itemsets over a set of itemsets.
Our experts found the use of a system that encapsulates SQL and provides a visual interface very convenient. Hence, their preferences go to the manual mode as it lets them keep control over the summarization process. However, as shown in Table 4, partially-guided pipelines yield the highest relevance by far. Hence, an expert with partial guidance manages to find almost all of the ground-truth itemsets in only fifty steps. Figure 8 illustrates one of the best summaries found with partial guidance. A deeper dive into utility shows that in the manual mode, experts find highly uniform itemsets with some reasonable novelty as they judiciously choose operators that do not rediscover seen itemsets. However, they are not able to find very diverse itemsets. As a result, relevance is the lowest. Interestingly, full-guided pipelines (with no expert intervention) yield the highest diversity, while partial-guidance allows them to connect summaries and control the level of novelty and uniformity while improving on the diversity of the manual mode. This suggests that some automation with expert intervention is useful.
6. Conclusion
This work examined the applicability of EDA to data summarization. Intuitively, a useful summary contains individually uniform sets that are collectively diverse to be representative. This bears similarity to the well-known diversity problem where the goal is to find a set of relevant and diverse items. This observation allows us to formulate a multi-step summarization problem that seeks to build a pipeline that returns the most useful summaries. We propose two algorithms that adapt existing solutions. We run extensive experiments that validate the use of DRL for data summarization. Future work would examine if tuning the hyper parameters of the DRL algorithm may improve results.
Acknowledgements.
This work is funded by the European Union’s Horizon 2020 research and innovation program (project name: INODE) under grant agreement No 863410.References
- (1)
- SDS (2021) 2021. Sloan Digital Sky Server. https://www.sdss.org/.
- UI (2022) 2022. EDA4SUM. http://www.inode-project.eu:18181/dora-summaries/
- git (2022) 2022. Git Repository. https://github.com/apersonnaz/EDA4Sum.
- foo (2022) 2022. My Food Data. https://tools.myfooddata.com/nutrition-facts-database-spreadsheet.php.
- Agarwal et al. (2007) Deepak Agarwal, Dhiman Barman, Dimitrios Gunopulos, Neal E Young, Flip Korn, and Divesh Srivastava. 2007. Efficient and effective explanation of change in hierarchical summaries. In Proc. of the 13th ACM SIGKDD international conference on Knowledge discovery and data mining.
- Amer-Yahia et al. (2017) Sihem Amer-Yahia, Sofia Kleisarchaki, Naresh Kumar Kolloju, Laks VS Lakshmanan, and Ruben H Zamar. 2017. Exploring rated datasets with rating maps. In WWW. 1411–1419.
- Amer-Yahia et al. (2021a) Sihem Amer-Yahia, Tova Milo, and Brit Youngmann. 2021a. Exploring Ratings in Subjective Databases. In Proceedings of the 2021 International Conference on Management of Data. 62–75.
- Amer-Yahia et al. (2021b) Sihem Amer-Yahia, Tova Milo, and Brit Youngmann. 2021b. SubDEx: Exploring Ratings in Subjective Databases. In 2021 IEEE 37th International Conference on Data Engineering (ICDE). IEEE, 2653–2656.
- Bar El et al. (2020a) Ori Bar El, Tova Milo, and Amit Somech. 2020a. Automatically generating data exploration sessions using deep reinforcement learning. In Proceedings of the 2020 ACM SIGMOD International Conference on Management of Data. 1527–1537.
- Bar El et al. (2020b) Ori Bar El, Tova Milo, and Amit Somech. 2020b. Automatically Generating Data Exploration Sessions Using Deep Reinforcement Learning. In Proceedings of the 2020 ACM SIGMOD International Conference on Management of Data (SIGMOD ’20). 1527–1537.
- Bu et al. (2005) Shaofeng Bu, Laks VS Lakshmanan, and Raymond T Ng. 2005. Mdl summarization with holes. In Proceedings of the 31st international conference on Very large data bases. 433–444.
- Carbonell and Goldstein (1998) Jaime Carbonell and Jade Goldstein. 1998. The use of MMR, diversity-based reranking for reordering documents and producing summaries. In Proceedings of the 21st annual international ACM SIGIR conference on Research and development in information retrieval. 335–336.
- Chandola and Kumar (2007) Varun Chandola and Vipin Kumar. 2007. Summarization–compressing data into an informative representation. Knowledge and Information Systems 12, 3 (2007), 355–378.
- Datasets (2021) Kaggle Datasets. 2021. Kaggle: Spotify Tracks DB. https://www.kaggle.com/zaheenhamidani/ultimate-spotify-tracks-db
- Dibia and Demiralp (2019) Victor Dibia and Çağatay Demiralp. 2019. Data2vis: Automatic generation of data visualizations using sequence-to-sequence recurrent neural networks. IEEE computer graphics and applications 39, 5 (2019), 33–46.
- Dimitriadou et al. (2016) Kyriaki Dimitriadou, Olga Papaemmanouil, and Yanlei Diao. 2016. AIDE: an active learning-based approach for interactive data exploration. IEEE TKDE 28, 11 (2016).
- Drosou et al. (2017) Marina Drosou, HV Jagadish, Evaggelia Pitoura, and Julia Stoyanovich. 2017. Diversity in big data: A review. Big Data (2017).
- Eirinaki et al. (2014) Magdalini Eirinaki, Suju Abraham, Neoklis Polyzotis, and Naushin Shaikh. 2014. Querie: Collaborative database exploration. IEEE TKDE (TKDE) 26, 7 (2014), 1778–1790.
- El et al. (2020) Ori Bar El, Tova Milo, and Amit Somech. 2020. Automatically Generating Data Exploration Sessions Using Deep Reinforcement Learning. In International Conference on Management of Data (SIGMOD).
- El Gebaly et al. (2014) Kareem El Gebaly, Parag Agrawal, Lukasz Golab, Flip Korn, and Divesh Srivastava. 2014. Interpretable and informative explanations of outcomes. Proceedings of the VLDB Endowment 8, 1 (2014), 61–72.
- Fraternali et al. (2012) Piero Fraternali, Davide Martinenghi, and Marco Tagliasacchi. 2012. Top-k bounded diversification. In Proceedings of the 2012 ACM SIGMOD International Conference on Management of Data. 421–432.
- Friedman and Tukey (1974) Jerome H Friedman and John W Tukey. 1974. A projection pursuit algorithm for exploratory data analysis. IEEE Trans. on Computers 100, 9 (1974), 881–890.
- Gollapudi and Sharma (2009) Sreenivas Gollapudi and Aneesh Sharma. 2009. An axiomatic approach for result diversification. In Proceedings of the 18th international conference on World wide web. 381–390.
- Gonzalez (1985) Teofilo F Gonzalez. 1985. Clustering to minimize the maximum intercluster distance. Theoretical computer science 38 (1985), 293–306.
- Guy et al. (2021) Ido Guy, Tova Milo, Slava Novgorodov, and Brit Youngmann. 2021. Improving Constrained Search Results By Data Melioration. In 2021 IEEE 37th International Conference on Data Engineering (ICDE). IEEE, 1667–1678.
- Huang et al. (2018) Enhui Huang, Liping Peng, Luciano Di Palma, Ahmed Abdelkafi, Anna Liu, and Yanlei Diao. 2018. Optimization for active learning-based interactive database exploration. pVLDB Endow. (2018).
- Joglekar et al. (2017) Manas Joglekar, Hector Garcia-Molina, and Aditya Parameswaran. 2017. Interactive data exploration with smart drill-down. IEEE TKDE (2017).
- Kaelbling et al. (1996) Leslie Pack Kaelbling, Michael L Littman, and Andrew W Moore. 1996. Reinforcement learning: A survey. Journal of artificial intelligence research 4 (1996), 237–285.
- Kim et al. (2020) Alexandra Kim, Laks VS Lakshmanan, and Divesh Srivastava. 2020. Summarizing Hierarchical Multidimensional Data. In 2020 IEEE 36th International Conference on Data Engineering (ICDE). IEEE, 877–888.
- Lakshmanan et al. (2002a) Laks VS Lakshmanan, Raymond T Ng, Christine Xing Wang, Xiaodong Zhou, and Theodore J Johnson. 2002a. The generalized MDL approach for summarization. In VLDB’02: Proceedings of the 28th International Conference on Very Large Databases. Elsevier, 766–777.
- Lakshmanan et al. (2002b) Laks VS Lakshmanan, Jian Pei, and Jiawei Han. 2002b. Quotient cube: How to summarize the semantics of a data cube. In VLDB’02: Proceedings of the 28th International Conference on Very Large Databases. Elsevier, 778–789.
- Lee et al. (2019) Doris Jung-Lin Lee, Himel Dev, Huizi Hu, Hazem Elmeleegy, and Aditya Parameswaran. 2019. Avoiding drill-down fallacies with VisPilot: assisted exploration of data subsets. In Proc. of the 24th International Conference on Intelligent User Interfaces.
- Marcel et al. (2019) Patrick Marcel, Nicolas Labroche, and Panos Vassiliadis. 2019. Towards a benefit-based optimizer for Interactive Data Analysis. In EDBT/ICDT.
- Milo and Somech (2018) Tova Milo and Amit Somech. 2018. Next-step suggestions for modern interactive data analysis platforms. In KDD. 576–585.
- Mnih et al. (2016) Volodymyr Mnih, Adrià Puigdomènech Badia, Mehdi Mirza, Alex Graves, Timothy P. Lillicrap, Tim Harley, David Silver, and Koray Kavukcuoglu. 2016. Asynchronous Methods for Deep Reinforcement Learning. In Proceedings of the 33nd International Conference on Machine Learning, ICML 2016, New York City, NY, USA, June 19-24, 2016. 1928–1937.
- Pashenkova et al. (1996) Elena Pashenkova, Irina Rish, and Rina Dechter. 1996. Value iteration and policy iteration algorithms for Markov decision problem. In AAAI’96: Workshop on Structural Issues in Planning and Temporal Reasoning. Citeseer.
- Personnaz et al. (2021a) Aurélien Personnaz, Sihem Amer-Yahia, Laure Berti-Équille, Maximilian Fabricius, and Srividya Subramanian. 2021a. Balancing Familiarity and Curiosity in Data Exploration with Deep Reinforcement Learning. In aiDM ’21: Fourth Workshop in Exploiting AI Techniques for Data Management, Virtual Event, China, 25 June, 2021. 16–23.
- Personnaz et al. (2021b) Aurélien Personnaz, Sihem Amer-Yahia, Laure Berti-Équille, Maximilian Fabricius, and Srividya Subramanian. 2021b. DORA THE EXPLORER: Exploring Very Large Data With Interactive Deep Reinforcement Learning. In CIKM ’21: The 30th ACM International Conference on Information and Knowledge Management, Virtual Event, Queensland, Australia, November 1 - 5, 2021, Gianluca Demartini, Guido Zuccon, J. Shane Culpepper, Zi Huang, and Hanghang Tong (Eds.). ACM, 4769–4773.
- Qin et al. (2012) Lu Qin, Jeffrey Xu Yu, and Lijun Chang. 2012. Diversifying top-k results. arXiv preprint arXiv:1208.0076 (2012).
- Roy et al. (2010) Senjuti Basu Roy, Sihem Amer-Yahia, Ashish Chawla, Gautam Das, and Cong Yu. 2010. Constructing and exploring composite items. In Proc. of the ACM SIGMOD International Conference on Management of Data, SIGMOD 2010, Indianapolis, Indiana, USA, June 6-10, 2010, Ahmed K. Elmagarmid and Divyakant Agrawal (Eds.). ACM, 843–854.
- Sarawagi (1999) Sunita Sarawagi. 1999. Explaining Differences in Multidimensional Aggregates. In VLDB’99, Proceedings of 25th International Conference on Very Large Data Bases, September 7-10, 1999, Edinburgh, Scotland, UK. Morgan Kaufmann, 42–53.
- Sathe and Sarawagi (2001) Gayatri Sathe and Sunita Sarawagi. 2001. Intelligent rollups in multidimensional OLAP data. In VLDB, Vol. 1. 531–540.
- Schrijver (2003) Alexander Schrijver. 2003. Combinatorial optimization: polyhedra and efficiency. Vol. 24. Springer Science & Business Media.
- Seleznova et al. (2020) Mariia Seleznova, Behrooz Omidvar-Tehrani, Sihem Amer-Yahia, and Eric Simon. 2020. Guided exploration of user groups. Proceedings of the VLDB Endowment (PVLDB) 13, 9 (2020), 1469–1482.
- Shahaf and Guestrin (2011) Dafna Shahaf and Carlos Guestrin. 2011. Connecting the Dots between News Articles. In IJCAI 2011, Proceedings of the 22nd International Joint Conference on Artificial Intelligence, Barcelona, Catalonia, Spain, July 16-22, 2011, Toby Walsh (Ed.). IJCAI/AAAI, 2734–2739.
- Siddiqui et al. (2016) Tarique Siddiqui, Albert Kim, John Lee, Karrie Karahalios, and Aditya Parameswaran. 2016. Effortless data exploration with zenvisage: an expressive and interactive visual analytics system. arXiv preprint arXiv:1604.03583 (2016).
- Somech et al. (2019) Amit Somech, Tova Milo, and Chai Ozeri. 2019. Predicting “What is Interesting” by Mining Interactive-Data-Analysis Session Logs. In EDBT. 456–467.
- Sutton and Barto (2018) Richard S Sutton and Andrew G Barto. 2018. Reinforcement learning. MIT press.
- Uno et al. (2004) Takeaki Uno, Masashi Kiyomi, and Hiroki Arimura. 2004. LCM ver. 2: Efficient mining algorithms for frequent/closed/maximal itemsets. In IEEE ICDM Workshop on Frequent Itemset Mining Implementations (FIMI), Vol. 126.
- Vollmer et al. (2019) Michael Vollmer, Lukasz Golab, Klemens Böhm, and Divesh Srivastava. 2019. Informative Summarization of Numeric Data. In Proc. of the 31st International Conference on Scientific and Statistical Database Management.
- Wen et al. (2018) Yuhao Wen, Xiaodan Zhu, Sudeepa Roy, and Jun Yang. 2018. Interactive summarization and exploration of top aggregate query answers. In Proceedings of the VLDB Endowment. International Conference on Very Large Data Bases, Vol. 11. NIH Public Access, 2196.
- Willett et al. (2013) Kyle W. Willett, Chris J. Lintott, Steven P. Bamford, Karen L. Masters, Brooke D. Simmons, Kevin R. V. Casteels, Edward M. Edmondson, Lucy F. Fortson, Sugata Kaviraj, William C. Keel, and et al. 2013. Galaxy Zoo 2: detailed morphological classifications for 304 122 galaxies from the Sloan Digital Sky Survey. Monthly Notices of the Royal Astronomical Society 435, 4 (Sep 2013), 2835–2860. https://doi.org/10.1093/mnras/stt1458
- Wongsuphasawat et al. (2015) Kanit Wongsuphasawat, Dominik Moritz, Anushka Anand, Jock Mackinlay, Bill Howe, and Jeffrey Heer. 2015. Voyager: Exploratory analysis via faceted browsing of visualization recommendations. IEEE Trans. on Visualization and Computer Graphics (2015).
- Yu et al. (2009a) Cong Yu, Laks Lakshmanan, and Sihem Amer-Yahia. 2009a. It takes variety to make a world: diversification in recommender systems. In Proceedings of the 12th international conference on extending database technology: Advances in database technology. 368–378.
- Yu et al. (2009b) Cong Yu, Laks Lakshmanan, and Sihem Amer-Yahia. 2009b. It takes variety to make a world: diversification in recommender systems. In Proceedings of the 12th international conference on extending database technology: Advances in database technology. 368–378.
- Zhou et al. (2020) Mengyu Zhou, Wang Tao, Ji Pengxin, Han Shi, and Zhang Dongmei. 2020. Table2Analysis: Modeling and Recommendation of Common Analysis Patterns for Multi-Dimensional Data. In AAAI, Vol. 34. 320–328.
- Ziegler et al. (2005) Cai-Nicolas Ziegler, Sean M McNee, Joseph A Konstan, and Georg Lausen. 2005. Improving recommendation lists through topic diversification. In Proceedings of the 14th international conference on World Wide Web. 22–32.