Optical Continuum Reverberation in the Dwarf Seyfert Nucleus of NGC 4395
Abstract
The nearby dwarf spiral galaxy NGC 4395 contains a broad-lined active galactic nucleus (AGN) of exceptionally low luminosity powered by accretion onto a central black hole of very low mass ( ). In order to constrain the size of the optical continuum emission region through reverberation mapping, we carried out high-cadence photometric monitoring of NGC 4395 in the griz filter bands on two consecutive nights in 2022 April using the four-channel MuSCAT3 camera on the Faulkes Telescope North at Haleakalā Observatory. Correlated variability across the griz bands is clearly detected, and the r, i, and z band light curves show lags of , , and minutes with respect to the g band when measured using the full-duration light curves. When lags are measured for each night separately, the Night 2 data exhibit lower cross-correlation amplitudes and shorter lags than the Night 1 light curves. Using the full-duration lags, we find that the lag-wavelength relationship is consistent with the dependence found for more luminous AGN. Combining our results with continuum lags measured for other objects, the lag between and band scales with optical continuum luminosity as , similar to the scaling of broad-line region size with luminosity, reinforcing recent evidence that diffuse continuum emission from the broad-line region may contribute substantially to optical continuum variability and reverberation lags.
1 Introduction
The active galactic nucleus (AGN) in the dwarf spiral galaxy NGC 4395 is the prototypical example of an AGN containing a very low-mass black hole (BH). First identified from the broad wings on its H emission line (Filippenko & Sargent, 1989), it exhibits all of the characteristics of an accretion-powered Seyfert 1 nucleus, including a high-excitation photoionized narrow-line region (Kraemer et al., 1999), highly variable X-ray emission (Lira et al., 1999; Iwasawa et al., 2000; Shih et al., 2003; Moran et al., 2005), and a compact radio core (Wrobel et al., 2001), but its bolometric luminosity is just erg s-1 (Moran et al., 2005), and the broad component of its H emission line has a dispersion of only km s-1 (Cho et al., 2021). The mass of the BH in NGC 4395 is not precisely determined, but a variety of methods (including indirect estimates, reverberation mapping, and dynamical studies) point to a mass in the range to a few (Kraemer et al., 1999; Shih et al., 2003; Filippenko & Ho, 2003; Peterson et al., 2005; den Brok et al., 2015; Woo et al., 2019; Cho et al., 2020). While a growing number of AGN in this BH mass range have been detected in recent years (for a review, see Greene et al., 2020), NGC 4395 remains uniquely amenable to detailed study due to its proximity at Mpc (Thim et al., 2004).
The small physical size of the AGN in NGC 4395 results in much shorter timescales for variability and reverberation at ultraviolet (UV) and optical wavelengths than are typical of luminous AGN. By fitting the TESS light curve of NGC 4395 with a damped random walk (DRW) model, Burke et al. (2020) found the DRW damping timescale to be days, in contrast to luminous AGN having in the range of hundreds to thousands of days. Its broad emission-line reverberation lags are just 1 hour, both for the C IV line measured relative to the 1350 Å continuum (Peterson et al., 2005) and for the H line measured relative to the -band continuum (Woo et al., 2019; Cho et al., 2020).
Continuum reverberation mapping can provide a direct probe of the size of the UV/optical continuum emitting region in AGN, if the UV/optical continuum variations result from reprocessing of coronal emission by the accretion disk and/or gas in the broad-line region (for a recent review see Cackett et al., 2021). While the continuum lags between UV and optical wavelengths in luminous Seyferts are typically a few days (e.g., Edelson et al., 2019), the continuum reverberation timescales in NGC 4395 are found to be much shorter. Using Hubble Space Telescope STIS UV observations from Peterson et al. (2005) combined with ground-based photometry, Desroches et al. (2006) measured a lag of minutes between the 1350 Å continuum and the optical band. McHardy et al. (2016) presented a preliminary report of an XMM-Newton and ground-based campaign on NGC 4395. Using data from the XMM-Newton Optical Monitor with the UVW1 filter ( Å) and ground-based -band photometry, they detected time delays of and s for the UVW1 and bands relative to the X-rays, which indicates that the lag of the -band relative to the UVW1 band is 315 s.
Although time delays between UV and optical continuum bands in NGC 4395 have been measured, inter-band optical continuum lags have not been detected in prior work, largely due to the challenge of resolving very short timescales in observations that cycle between different filters on a single telescope (e.g., Edri et al., 2012). Extrapolating the 315 s time delay between 2600 Å and the band (McHardy et al., 2016) under the assumption of the scaling relationship expected for reprocessing by a standard thin accretion disk (Cackett et al., 2007), the predicted lag between the and bands is just 11 minutes. The nightly -band variability amplitude of the AGN is typically mag (e.g., Cho et al., 2020, 2021), and an inter-band lag of several minutes is potentially detectable if photometry can be obtained with sufficiently high cadence and signal-to-noise ratio. Measurement of broad-band optical reverberation lags in NGC 4395 would provide new constraints on the size of its optical continuum emission region and a significant extension to the luminosity range of AGN having such constraints. In this Letter, we report on the first unambiguous detection of continuum reverberation across the optical wavelength range in NGC 4395.
2 Observations
We observed NGC 4395 on 2022 April 26 and 27 (UT) using the MuSCAT3 camera (Narita et al., 2020) on the 2 m Faulkes North Telescope (FTN) located at Haleakalā Observatory. FTN is a part of the Las Cumbres Observatory (LCO) Global Telescope Network (Brown et al., 2013). MuSCAT3 is a four-channel imager that observes simultaneously in , , , and filter bands (abbreviated as hereinafter), with a field of view and 027 pixels. We used the fast readout mode (readout time 6 s) in order to obtain a rapid observing cadence, given the expectation that the inter-band lags might be as short as a few minutes. Exposure times were set to 100 s in the g, i, and z bands. Since no suitable guide stars are available for use by the telescope autoguider in the field surrounding NGC 4395, we used the “guide off” mode, in which guiding is done using short exposures on one of the MuSCAT3 cameras. We chose the r band for guiding, and used 25 s exposures in r. On April 26 UT (Night 1), repeated observations in all four bands were carried out for a total duration of 6.7 hours, and on April 27 (Night 2) the observations spanned 6.2 hours. Conditions were mostly clear on both nights.
3 Data Reduction and Photometry
The images were processed by the LCO BANZAI reduction pipeline, which includes bad pixel masking, bias subtraction, flat-field correction, and astrometric calibration using astrometry.net (Lang et al., 2010).
Photometry was carried out using an automated procedure based on Astropy (Astropy Collaboration et al., 2018) routines for aperture photometry and background sky measurement. In each image, the AGN and a set of comparison stars were identified by their coordinates. Aperture photometry was carried out using a photometric aperture radius of 3″, with the sky annulus spanning ″. We found that the best results were obtained using a single comparison star, SDSS J122550.91+333310.1, located close to the central region of NGC 4395. Counts were converted into flux density units using griz photometric data obtained from the Sloan Digital Sky Survey (SDSS) for the comparison star. SDSS uses a filter while MuSCAT3 uses , so the z-band calibration is only approximate, but the overall normalization of the light curves does not affect the reverberation measurements.
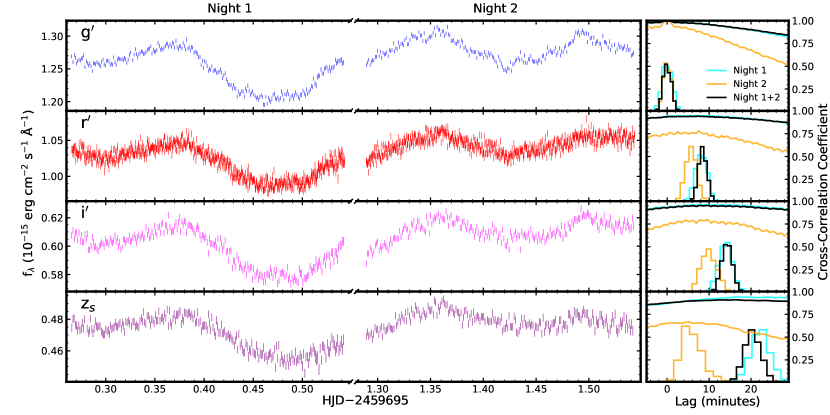
The final light curves are displayed in Figure 1 and the photometric data are listed in Table 1. Multiple features are present in the light curves, providing the required structure for cross-correlation lag measurement. The variations at longer wavelengths appear smoother and with lower amplitude than those in the band, as expected for a more extended reprocessing region at longer wavelengths, combined with the increasing contribution of light from the surrounding nuclear cluster (Carson et al., 2015).
| Band | HJD | ||
|---|---|---|---|
| ( erg cm-2 s-1 Å-1) | |||
| g | 0.2655 | 1.269 | 0.003 |
| g | 0.2667 | 1.260 | 0.003 |
| g | 0.2679 | 1.271 | 0.003 |
| g | 0.2691 | 1.267 | 0.003 |
| g | 0.2704 | 1.258 | 0.003 |
| g | 0.2716 | 1.262 | 0.003 |
| g | 0.2728 | 1.264 | 0.003 |
| g | 0.2740 | 1.263 | 0.003 |
| g | 0.2752 | 1.266 | 0.003 |
| g | 0.2765 | 1.266 | 0.003 |
Note. — This table is published in its entirety in machine-readable format. A portion is shown here for guidance regarding its form and content.
4 Lag Measurement
We measured the time lags of the riz bands relative to the g band using the interpolated cross-correlation function (ICCF) method as described by Gaskell & Peterson (1987) and White & Peterson (1994), with the code PyCCF (Sun et al., 2018). CCFs were measured over a lag search range spanning to minutes, with a sampling interval of 0.5 minutes. The measurements were performed on the Night 1 and Night 2 data separately, and also on the combined Night 1 and 2 light curves. Error analysis was carried out using the standard flux randomization/random subset selection (FR/RSS) method (Peterson et al., 1998), with 5000 resampling iterations. In each iteration, the centroid of the CCF is determined from points above , where is the peak height of the CCF. We take the lag for each band to be the median of the cross-correlation centroid distribution (CCCD) from the 5000 FR/RSS iterations. The lags and values are listed in Table 2.
Although the CCFs have very broad peaks, their centroids are well determined, with uncertainties of minutes on the measurements. The Night 1 light curves yield very high values of 0.94–0.95, while the Night 2 data show substantially lower levels of inter-band correlation with values of 0.67–0.78. This can be attributed in part to a lower fractional variability amplitude during Night 2, but intrinsic changes in the continuum emission region structure may be partly responsible as well. The Night 2 lags are systematically shorter than those of Night 1, and the differences increase with wavelength. In particular, the z-band lags exhibit a striking change, from 22.2 minutes on Night 1 to just 5.6 minutes on Night 2, and the difference between these is significant at the level considering the uncertainties on both measurements. The lags measured from the combined Night 1 + Night 2 light curves are very similar to the Night 1 lags, with values nearly as high, indicating that the overall cross-correlation strength is dominated by the stronger variability in the Night 1 data. We take the combined Night 1 + 2 results as the final lag results for the following discussion.
| Band | Night 1 | Night 2 | Nights 1&2 | |||
|---|---|---|---|---|---|---|
| (min) | (min) | (min) | ||||
| g (4770 Å) | -0.03^+1.21_-1.25 | 1.00 | 0.00^+0.92_-0.92 | 1.00 | 0.04^+0.98_-0.95 | 1.00 |
| r (6215 Å) | 8.14^+1.44_-1.41 | 0.95 | 5.70^+1.43_-1.30 | 0.78 | 8.44^+0.99_-1.14 | 0.94 |
| i (7545 Å) | 13.89^+1.67_-1.67 | 0.95 | 10.01^+1.84_-2.02 | 0.80 | 14.20^+1.20_-1.35 | 0.95 |
| z (8700 Å) | 22.15^+2.26_-2.42 | 0.94 | 5.63^+2.09_-2.82 | 0.67 | 20.41^+2.03_-2.05 | 0.91 |
Note. — Lags are given in the observed frame in units of minutes. Central wavelengths are listed for each filter. All lags are measured relative to the g band.
5 Discussion
Figure 2 displays the inter-band lags corrected to the AGN rest frame (using km s-1) as a function of rest-frame wavelength. To compare the data with disk reprocessing model predictions, we fit the riz data points with the function , where is the central wavelength of the -band filter shifted to the AGN rest frame ( Å), is a free parameter (e.g., Edelson et al., 2019), and we fix corresponding to a standard thin accretion disk. By construction, the model has at , so we do not include the -band data point in the fit. This simple model provides a good fit to the data, as shown in Figure 2, with for two degrees of freedom.
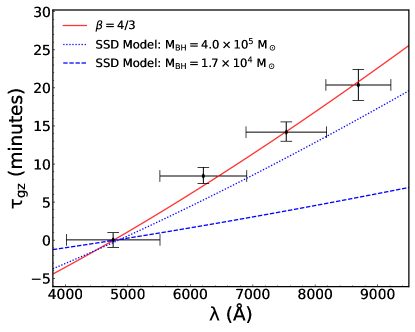
We compare the observed lag-wavelength trend with model predictions for thermal reprocessing by a Shakura & Sunyaev (1973) disk (SSD) model following the method described by Fausnaugh et al. (2016) and Edelson et al. (2017). In this model, the radius corresponding to peak emission at wavelength is given by
| (1) |
where is the gravitational constant, is the black hole mass, is the Stefan-Boltzmann constant, is the Eddington luminosity, is the Eddington ratio, (set to 0.1) is the radiative efficiency, and (set to 1) represents the relative contribution between X-rays and viscosity in disk heating. The quantity (set to 3.36) is a factor used in converting disk temperature to wavelength for a responsivity-weighted emitting radius (Tie & Kochanek, 2018). To calculate we adopt the bolometric luminosity measurement of 5.3 1040 erg s-1 from Moran et al. (2005). Since the BH mass of NGC 4395 is highly uncertain, we calculate models for two values spanning the range of recent measurements: from H reverberation mapping (Cho et al., 2021) and from spatially resolved gas dynamics (den Brok et al., 2015). In Figure 2 we show curves of the predicted lags relative to the band, , for these two values.
Intensive UV/optical continuum reverberation mapping programs have found continuum emission region sizes that are typically times larger than expected from disk reprocessing models (Cackett et al., 2021). While one possibility is that AGN accretion disks are larger than model predictions, recent work has focused on the contribution of diffuse continuum emission from the broad-line region (BLR) as an explanation for the longer-than-expected continuum lags and their wavelength dependence (e.g., Cackett et al., 2018; Korista & Goad, 2019; Chelouche et al., 2019; Netzer, 2022). For NGC 4395 we find that the observed continuum emission region is 3.6 or 1.2 times larger than the disk reprocessing model predictions for BH masses of or , respectively. These discrepancies would be greater if was used; this value corresponds to a flux-weighted (rather than responsivity-weighted) emission radius and has been used in several other recent continuum reverberation studies (e.g., Edelson et al., 2019). These model calculations for our chosen fiducial values of imply that NGC 4935 may have a “disk size problem” similar to that found in more luminous Seyferts, and if is at the lower end of the published range then NGC 4395 would be consistent with the trend identified by Li et al. (2021) in which lower-luminosity AGN exhibit larger disk size discrepancies. However, the standard disk reprocessing scenario could still be compatible with the data considering the BH mass uncertainty range of ( uncertainties) found by den Brok et al. (2015). Alternatively, these results could be interpreted as favoring a BH mass at the upper end of the likely range, if the basic disk reprocessing model was assumed to apply.
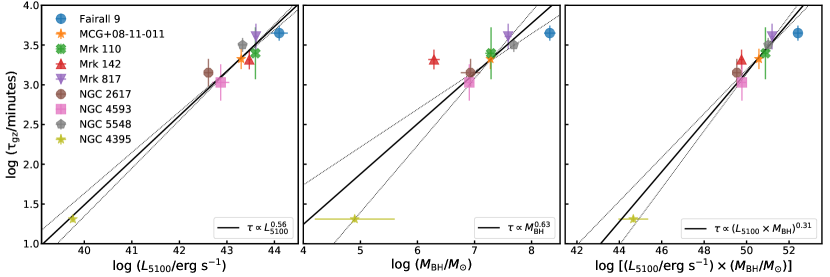
To compare the NGC 4395 continuum lags with these of more massive AGN, we selected eight local AGN (redshifts ) having high-quality g through z-band data from intensive disk reverberation mapping campaigns: Fairall 9 (Hernández Santisteban et al., 2020), MCG0811011 (Fausnaugh et al., 2018), Mrk 110 (Vincentelli et al., 2021), Mrk 142 (Cackett et al., 2020), Mrk 817 (Kara et al., 2021), NGC 2617 (Fausnaugh et al., 2018), NGC 4593 (Cackett et al., 2018), and NGC 5548 (Fausnaugh et al., 2016). In these papers, the and -band lags were measured relative to some other UV or optical band used as the driving light curve, but lags between and were not directly measured. In order to compare the measured of NGC 4395 with other AGN, we downloaded the light curve data from the original publications where available, and measured with the ICCF method as described previously.111For NGC 4593, the continuum light curves from Cackett et al. (2018) were measured from Hubble Space Telescope STIS spectroscopic data, and we used the published light curves at and 8800 Å to approximate the g and z bands. We performed a 2nd-order polynomial detrending for Fairall 9 before lag measurement to remove the long-term variability trend, following Hernández Santisteban et al. (2020). For NGC 2617 and MCG0811011 we used the best light-curve segments for lag measurement, following Fausnaugh et al. (2018). For Mrk 110 and Mrk 817, the light curve data are not available in the published works, and we derived an estimate of by taking the difference between the published z-band and g-band lags, using error propagation to estimate the uncertainty on .
The adopted observed-frame lags are 3.25 (Fairall 9), 1.5 (MCG0811011), 1.79 (Mrk 110), 1.51 (Mrk 142), 2.90 (Mrk 817), 1.00 (NGC 2617), 0.75 (NGC 4593), and 2.24 (NGC 5548) days. AGN continuum luminosities at 5100 Å and black hole masses for the comparison sample are available from the Bentz & Katz (2015) catalog. For NGC 4395, we adopt the host-corrected AGN continuum luminosity of erg s-1 at 5100 Å from Cho et al. (2020). As before, we consider a BH mass range from to corresponding to recent measurements. We use the geometric mean of these values as the fiducial black hole mass with the uncertainty range spanning the range of these two values [] in the following analysis.
Figure 3 displays the relationship of with AGN continuum luminosity at 5100 Å, and with . The 20.4 minute lag in NGC 4395 extends the dynamic range of the comparison sample downward by a factor of 50, and is clearly correlated with both luminosity and mass. The lag has a tighter relationship with than with , which could indicate that luminosity is a more fundamental driver of the continuum emission size, but larger uncertainties in the BH masses (particularly for NGC 4395) might also be responsible for the larger scatter in the - relation. We performed linear fits to the relations between and and between and with the code linmix (Kelly, 2007), which employs a hierarchical Bayesian model incorporating errors in both the luminosity and lag measurements.
For the relation we find , with a slope similar to the scaling of the broad-line region (BLR) radius-luminosity relationship (Bentz et al., 2013). This result is very similar to the recent finding by Netzer (2022) that the -band continuum lags of luminous Seyferts (measured relative to the UV) follow a trend. As argued by Netzer (2022), this observed lag-luminosity scaling suggests that diffuse continuum emission from the BLR (e.g, Korista & Goad, 2019) makes a substantial or even dominant contribution to the optical variability amplitude and continuum reverberation lags. The addition of NGC 4395 to the sample significantly extends the range of the relationship and demonstrates that the trend found by Netzer (2022) continues to apply at the lowest AGN luminosities. This provides further corroborating evidence for the scenario in which BLR continuum emission contributes significantly to optical variability, as also demonstrated by the presence of a distinct excess lag at wavelengths below the Balmer jump in several objects (e.g., Fausnaugh et al., 2018; Cackett et al., 2018; Edelson et al., 2019).
For the relationship we obtain ; the slope of this relationship is not as tightly constrained due to the large uncertainty in the NGC 4395 BH mass.
The disk model of Equation 1 predicts a scaling of at fixed . In the right panel of Figure 3 we plot the relation between and the product along with a power-law fit to the data with slope as a free parameter, again using to span the expected range in . The best fit gives , nearly identical to the disk reprocessing model prediction. However, this scaling can also be compatible with a scenario in which BLR diffuse continuum emission makes a large contribution to the optical variability, and where lag is primarily dependent on luminosity. Fitting a power law to the mass-luminosity relation of our sample yields . Combining the observed relation with the mass-luminosity relation of the sample implies that the sample should follow , consistent with the observed scaling. In this way, a continuum lag-luminosity relation dominated by BLR reprocessing can produce a scaling of with very similar to the disk reprocessing prediction. As a result, the vs. relation does not clearly discriminate between the disk and the BLR as the dominant location for continuum reprocessing in the optical spectrum, but observations of a larger sample spanning a broad range in Eddington ratio could potentially yield a useful test.
The difference in the measured lags between Night 1 and Night 2 indicates that the reprocessing geometry may undergo changes on very short timescales. The Night 2 data strongly depart from the expected lag-wavelength trend in that the z-band lag is shorter than the i-band lag, although the dominant reverberation behavior apparent in the combined Night 1+2 data follows the model closely. Very few AGN have high-cadence continuum reverberation mapping data spanning timescales long enough to search for temporal changes in lags (one example is Mrk 110 which has shown evidence for a time-varying BLR contribution; Vincentelli et al., 2022). In light of this unusual behavior, it would be particularly useful to carry out monitoring of NGC 4395 over a longer time baseline, and over a broader range of wavelengths (ideally including X-ray and UV observations) to better explore temporal changes in lag behavior, and test whether variations in lag are correlated with any other observable properties. The dynamical timescale in the optically emitting region of the accretion disk in NGC 4395 will be of order days, compared with years for luminous Seyferts, making it possible to conduct studies of disk variability in NGC 4395 during a single observing season that would require years to decades to span the corresponding timescales in more typical AGN.
6 Conclusions
We have measured optical continuum reverberation lags in the dwarf AGN NGC 4395, finding lags of just minutes for the riz bands relative to the g band. The trend of lag vs. wavelength is well matched by a model, but the large uncertainty in BH mass precludes strong conclusions as to whether NGC 4395 has a “disk size problem” similar to that of high-luminosity AGN. The addition of NGC 4395 extends the continuum lag-luminosity scaling found by Netzer (2022) by two orders of magnitude in luminosity, and the derived slope of over this extended luminosity range further reinforces suggestions that diffuse BLR continuum emission contributes substantially to AGN optical continuum lags. Future continuum reverberation mapping of NGC 4395 over a broader wavelength range would be particularly valuable in order to search for evidence of diffuse continuum emission from the BLR, and to better understand short-timescale variations in reprocessing behavior.
References
- Astropy Collaboration et al. (2018) Astropy Collaboration, Price-Whelan, A. M., Sipőcz, B. M., et al. 2018, AJ, 156, 123, doi: 10.3847/1538-3881/aabc4f
- Bentz & Katz (2015) Bentz, M. C., & Katz, S. 2015, PASP, 127, 67, doi: 10.1086/679601
- Bentz et al. (2013) Bentz, M. C., Denney, K. D., Grier, C. J., et al. 2013, ApJ, 767, 149, doi: 10.1088/0004-637X/767/2/149
- Brown et al. (2013) Brown, T. M., Baliber, N., Bianco, F. B., et al. 2013, PASP, 125, 1031, doi: 10.1086/673168
- Burke et al. (2020) Burke, C. J., Shen, Y., Chen, Y.-C., et al. 2020, ApJ, 899, 136, doi: 10.3847/1538-4357/aba3ce
- Cackett et al. (2021) Cackett, E. M., Bentz, M. C., & Kara, E. 2021, iScience, 24, 102557, doi: 10.1016/j.isci.2021.102557
- Cackett et al. (2018) Cackett, E. M., Chiang, C.-Y., McHardy, I., et al. 2018, ApJ, 857, 53, doi: 10.3847/1538-4357/aab4f7
- Cackett et al. (2007) Cackett, E. M., Horne, K., & Winkler, H. 2007, MNRAS, 380, 669, doi: 10.1111/j.1365-2966.2007.12098.x
- Cackett et al. (2020) Cackett, E. M., Gelbord, J., Li, Y.-R., et al. 2020, ApJ, 896, 1, doi: 10.3847/1538-4357/ab91b5
- Carson et al. (2015) Carson, D. J., Barth, A. J., Seth, A. C., et al. 2015, AJ, 149, 170, doi: 10.1088/0004-6256/149/5/170
- Chelouche et al. (2019) Chelouche, D., Pozo Nuñez, F., & Kaspi, S. 2019, Nature Astronomy, 3, 251, doi: 10.1038/s41550-018-0659-x
- Cho et al. (2020) Cho, H., Woo, J.-H., Hodges-Kluck, E., et al. 2020, ApJ, 892, 93, doi: 10.3847/1538-4357/ab7a98
- Cho et al. (2021) Cho, H., Woo, J.-H., Treu, T., et al. 2021, ApJ, 921, 98, doi: 10.3847/1538-4357/ac1e92
- den Brok et al. (2015) den Brok, M., Seth, A. C., Barth, A. J., et al. 2015, ApJ, 809, 101, doi: 10.1088/0004-637X/809/1/101
- Desroches et al. (2006) Desroches, L.-B., Filippenko, A. V., Kaspi, S., et al. 2006, ApJ, 650, 88, doi: 10.1086/507263
- Edelson et al. (2017) Edelson, R., Gelbord, J., Cackett, E., et al. 2017, ApJ, 840, 41, doi: 10.3847/1538-4357/aa6890
- Edelson et al. (2019) —. 2019, ApJ, 870, 123, doi: 10.3847/1538-4357/aaf3b4
- Edri et al. (2012) Edri, H., Rafter, S. E., Chelouche, D., Kaspi, S., & Behar, E. 2012, ApJ, 756, 73, doi: 10.1088/0004-637X/756/1/73
- Fausnaugh et al. (2016) Fausnaugh, M. M., Denney, K. D., Barth, A. J., et al. 2016, ApJ, 821, 56, doi: 10.3847/0004-637X/821/1/56
- Fausnaugh et al. (2018) Fausnaugh, M. M., Starkey, D. A., Horne, K., et al. 2018, ApJ, 854, 107, doi: 10.3847/1538-4357/aaaa2b
- Filippenko & Ho (2003) Filippenko, A. V., & Ho, L. C. 2003, ApJ, 588, L13, doi: 10.1086/375361
- Filippenko & Sargent (1989) Filippenko, A. V., & Sargent, W. L. W. 1989, ApJ, 342, L11, doi: 10.1086/185472
- Gaskell & Peterson (1987) Gaskell, C. M., & Peterson, B. M. 1987, ApJS, 65, 1, doi: 10.1086/191216
- Greene et al. (2020) Greene, J. E., Strader, J., & Ho, L. C. 2020, ARA&A, 58, 257, doi: 10.1146/annurev-astro-032620-021835
- Hernández Santisteban et al. (2020) Hernández Santisteban, J. V., Edelson, R., Horne, K., et al. 2020, MNRAS, 498, 5399, doi: 10.1093/mnras/staa2365
- Iwasawa et al. (2000) Iwasawa, K., Fabian, A. C., Almaini, O., et al. 2000, MNRAS, 318, 879, doi: 10.1046/j.1365-8711.2000.03810.x
- Kara et al. (2021) Kara, E., Mehdipour, M., Kriss, G. A., et al. 2021, ApJ, 922, 151, doi: 10.3847/1538-4357/ac2159
- Kelly (2007) Kelly, B. C. 2007, ApJ, 665, 1489, doi: 10.1086/519947
- Korista & Goad (2019) Korista, K. T., & Goad, M. R. 2019, MNRAS, 489, 5284, doi: 10.1093/mnras/stz2330
- Kraemer et al. (1999) Kraemer, S. B., Ho, L. C., Crenshaw, D. M., Shields, J. C., & Filippenko, A. V. 1999, ApJ, 520, 564, doi: 10.1086/307486
- Lang et al. (2010) Lang, D., Hogg, D. W., Mierle, K., Blanton, M., & Roweis, S. 2010, AJ, 139, 1782, doi: 10.1088/0004-6256/139/5/1782
- Li et al. (2021) Li, T., Sun, M., Xu, X., et al. 2021, ApJ, 912, L29, doi: 10.3847/2041-8213/abf9aa
- Lira et al. (1999) Lira, P., Lawrence, A., O’Brien, P., et al. 1999, MNRAS, 305, 109, doi: 10.1046/j.1365-8711.1999.02388.x
- McHardy et al. (2016) McHardy, I. M., Connolly, S. D., Peterson, B. M., et al. 2016, Astronomische Nachrichten, 337, 500, doi: 10.1002/asna.201612337
- Moran et al. (2005) Moran, E. C., Eracleous, M., Leighly, K. M., et al. 2005, AJ, 129, 2108, doi: 10.1086/429522
- Narita et al. (2020) Narita, N., Fukui, A., Yamamuro, T., et al. 2020, in Society of Photo-Optical Instrumentation Engineers (SPIE) Conference Series, Vol. 11447, Society of Photo-Optical Instrumentation Engineers (SPIE) Conference Series, 114475K, doi: 10.1117/12.2559947
- Netzer (2022) Netzer, H. 2022, MNRAS, 509, 2637, doi: 10.1093/mnras/stab3133
- Peterson et al. (1998) Peterson, B. M., Wanders, I., Horne, K., et al. 1998, PASP, 110, 660, doi: 10.1086/316177
- Peterson et al. (2005) Peterson, B. M., Bentz, M. C., Desroches, L.-B., et al. 2005, ApJ, 632, 799, doi: 10.1086/444494
- Shakura & Sunyaev (1973) Shakura, N. I., & Sunyaev, R. A. 1973, A&A, 24, 337
- Shih et al. (2003) Shih, D. C., Iwasawa, K., & Fabian, A. C. 2003, MNRAS, 341, 973, doi: 10.1046/j.1365-8711.2003.06482.x
- Sun et al. (2018) Sun, M., Grier, C. J., & Peterson, B. M. 2018, PyCCF: Python Cross Correlation Function for reverberation mapping studies, Astrophysics Source Code Library, record ascl:1805.032. http://ascl.net/1805.032
- Thim et al. (2004) Thim, F., Hoessel, J. G., Saha, A., et al. 2004, AJ, 127, 2322, doi: 10.1086/382244
- Tie & Kochanek (2018) Tie, S. S., & Kochanek, C. S. 2018, MNRAS, 473, 80, doi: 10.1093/mnras/stx2348
- Vincentelli et al. (2022) Vincentelli, F. M., McHardy, I., Hernández Santisteban, J. V., et al. 2022, MNRAS, 512, L33, doi: 10.1093/mnrasl/slac009
- Vincentelli et al. (2021) Vincentelli, F. M., McHardy, I., Cackett, E. M., et al. 2021, MNRAS, 504, 4337, doi: 10.1093/mnras/stab1033
- White & Peterson (1994) White, R. J., & Peterson, B. M. 1994, PASP, 106, 879, doi: 10.1086/133456
- Woo et al. (2019) Woo, J.-H., Cho, H., Gallo, E., et al. 2019, Nature Astronomy, 3, 755, doi: 10.1038/s41550-019-0790-3
- Wrobel et al. (2001) Wrobel, J. M., Fassnacht, C. D., & Ho, L. C. 2001, ApJ, 553, L23, doi: 10.1086/320508