DRLComplex: Reconstruction of protein quaternary structures using deep reinforcement learning
Abstract
Predicted inter-chain residue-residue contacts can be used to build the quaternary structure of protein complexes from scratch. However, only a small number of methods have been developed to reconstruct protein quaternary structures using predicted inter-chain contacts. Here, we present an agent-based self-learning method based on deep reinforcement learning (DRLComplex) to build protein complex structures using inter-chain contacts as distance constraints. We rigorously tested DRLComplex on two standard datasets of homodimeric and heterodimeric protein complexes (i.e., the CASP-CAPRI homodimer and Std_32 heterodimer datasets) using both true and predicted interchain contacts as inputs. Utilizing true contacts as input, DRLComplex achieved high average TM-scores of 0.9895 and 0.9881 and a low average interface RMSD (I_RMSD) of 0.2197 and 0.92 on the two datasets, respectively. When predicted contacts are used, the method achieves TM-scores of 0.73 and 0.76 for homodimers and heterodimers, respectively. Our experiments find that the accuracy of reconstructed quaternary structures depends on the accuracy of the contact predictions. Compared to other optimization methods for reconstructing quaternary structures from inter-chain contacts, DRLComplex performs similar to an advanced gradient descent method and better than a Markov Chain Monte Carlo simulation method and a simulated annealing-based method, validating the effectiveness of DRLComplex for quaternary reconstruction of protein complexes.
1 Introduction
In cells, a protein chain folds into a three-dimensional (3D) shape referred to as a tertiary structure. The tertiary structures of two or more protein chains often interact to form a protein complex, a conformation often referred to as a protein quaternary structure. As the function of a single protein chain or protein complex is largely determined by its 3D structure, predicting protein structures from their corresponding amino acid sequences is important for studying the function of proteins. However, the determination of protein quaternary structures using experimental techniques such as X-ray crystallography remains time-consuming and expensive and, as such, can only be applied to a small portion of proteins of interest. Therefore, accurate computational prediction of protein structures from sequences has become a holy grail of computational biochemistry, drug design, biophysics, and bioinformatics over the last few decades.
Recently, deep learning (DL) has driven substantial progress in protein tertiary structure prediction in the recent years [1, 2, 3, 4, 5, 6], which has been demonstrated in the biennial Critical Assessment of Protein Structure Prediction (CASP) competition [7, 8, 9]. A major breakthrough was made in the th round of CASP by AlphaFold 2 [10], a method that can predict tertiary structures of many proteins with high accuracy. Despite the notable progress in tertiary structure prediction, the prediction of protein quaternary structures (i.e., protein structures consisting of two or more protein chains) is still in early stages of development [11, 12, 13, 14, 15, 16, 17]. Towards this end, we propose DRLComplex, a novel deep reinforcement learning (DRL) approach to reconstructing quaternary structures of protein complexes. In particular, DRLComplex generates quaternary structures of protein dimers using predicted inter-chain contacts and known (or predicted) tertiary structures as input to a self-play mechanism for geometric reconstruction, making it the first of its kind in DL-based complex structure modeling.
2 Related Work
We now proceed to describe works relevant to DL-based complex structure modeling and prediction.
Quaternary structure prediction taxonomy. Existing methods for quaternary structure prediction can currently be subdivided into two categories: ab initio methods [18, 19, 13, 20, 21, 22] and template-based methods [23, 24]. Template-based approaches typically search protein structure databases for similar templates for a protein target and predict its quaternary structure based on the available template structures. While such approaches work well if suitable structural templates are available, it does not work well for a majority of protein complexes, as template structures often are not available for such types of proteins. As such, we restrict the scope of our review of related works to ab initio methods.
Ab initio quaternary structure reconstruction methods. Different ab initio methods based on the energy optimization and machine learning prediction of inter-chain contacts have been developed and tested in the Critical Assessment of Protein Interaction (CAPRI) experiments [25]. For example, RosettaDock is a popular docking tool that leverages Markov Chain Monte-Carlo (MC) based algorithms for energy minimization to dock protein chains [18]. Likewise, Zdock [19] uses a combination of various potential scoring criteria to select quaternary structure models generated by a Fourier transformation method. Recently, a gradient descent structure optimization method, GD [22], and simulated annealing method, ConComplex [13], have been developed to build quaternary structures from predicted inter-chain residue-residue contacts and tertiary structures of protein chains. Due to recent development of accurate deep learning methods for inter-chain contact prediction such as DeepInteract [26], GLINTER [17], and DRCon [16], the predictions of such methods have enabled existing quaternary structure predictors to generate high-quality quaternary structures for certain proteins.
Ab initio quaternary structure prediction methods. The latest advancements in the field of quaternary structure prediction, however, are extensions of end-to-end deep learning methods for tertiary structure prediction [27, 10]. For instance, AlphaFold-Multimer Evans et al. [21] adapts the deep learning architecture of AlphaFold 2 to take as input concatenated multiple sequence alignments of protein monomers found within protein multimers as well as available template structures to predict corresponding quaternary structures. This method outperforms existing docking methods according to two benchmark studies. However, AlphaFold-Multimer is currently only able to predict accurate quaternary structures for a portion of protein complexes.
Reinforcement learning methods. In parallel to many advances in computational biology, advancements in DRL have been demonstrated by methods such as AlphaGo [28] for playing GO games, defeating the GO world champion multiple times. DRL has also achieved similar success in playing other games such as Atari games [29] as well as StarCraft II [30]. Though reinforcement learning (RL) has commonly been used in the context of gaming and robotics, it has rarely been used in the field of computational biology [31, 32, 33] and, until now, has not been used for protein complex structure modeling.
Contributions.
Our work builds upon that of previous works by making the following contributions.
-
•
We provide the first example of applying deep reinforcement learning to the task of protein complex structure modeling.
-
•
We provide the first example of applying a self-play reinforcement learning mechanism within the field of computational biology.
-
•
We introduce DRLComplex, showcasing its state-of-the-art performance in reconstructing protein quaternary structures.
3 DRLComplex Model
We now turn to describe our new DRLComplex model, as illustrated in Figure 1.
Problem formulation. DRLComplex uses deep reinforcement learning techniques to automatically construct the quaternary structure of protein dimers by adjusting the position of one protein chain (ligand) with respect to another one held fixed (receptor) to produce structural conformations similar to the native (true) structure. Specifically, an artificial intelligence (AI) agent is trained to choose actions according to both intermediate reward and long-term reward to modify the state (structure) of a protein dimer in a modeling environment. The state () of a protein dimer is represented by two equivalent forms: the 3D coordinates of atoms and their inter-chain distance map. The former is suitable for generating new structures in the environment by applying actions to such coordinates, and the latter is suitable for a deep learning model to predict the values of possible actions. Here, we represent inter-chain distance maps as a two-dimensional (2D) matrix () with a size of , where is the sequence length of the ligand and is the sequence length of the receptor. The cells of such a matrix contain the distances between residues’ atoms within a dimer’s ligand and receptor structures, respectively.
Network design. In DRLComplex, we designed six actions for our agent, including three translations with a step size of 1 Å and three rotations with a step size of 1 along the x, y, and z-axis (i.e., forward and backward motions) to adjust the position of one chain (e.g., the ligand) against the other one (e.g., the receptor). We then use a deep convolutional neural network (i.e., Q) to approximate the Q-function of our RL context to predict Q-values (and estimate immediate and future rewards) of our six possible actions, as shown in Figure 1 for an input state . We refer to this deep network as an agent that predicts the value of the actions, values which are then used to choose the next action to change the state of a protein dimer structure.
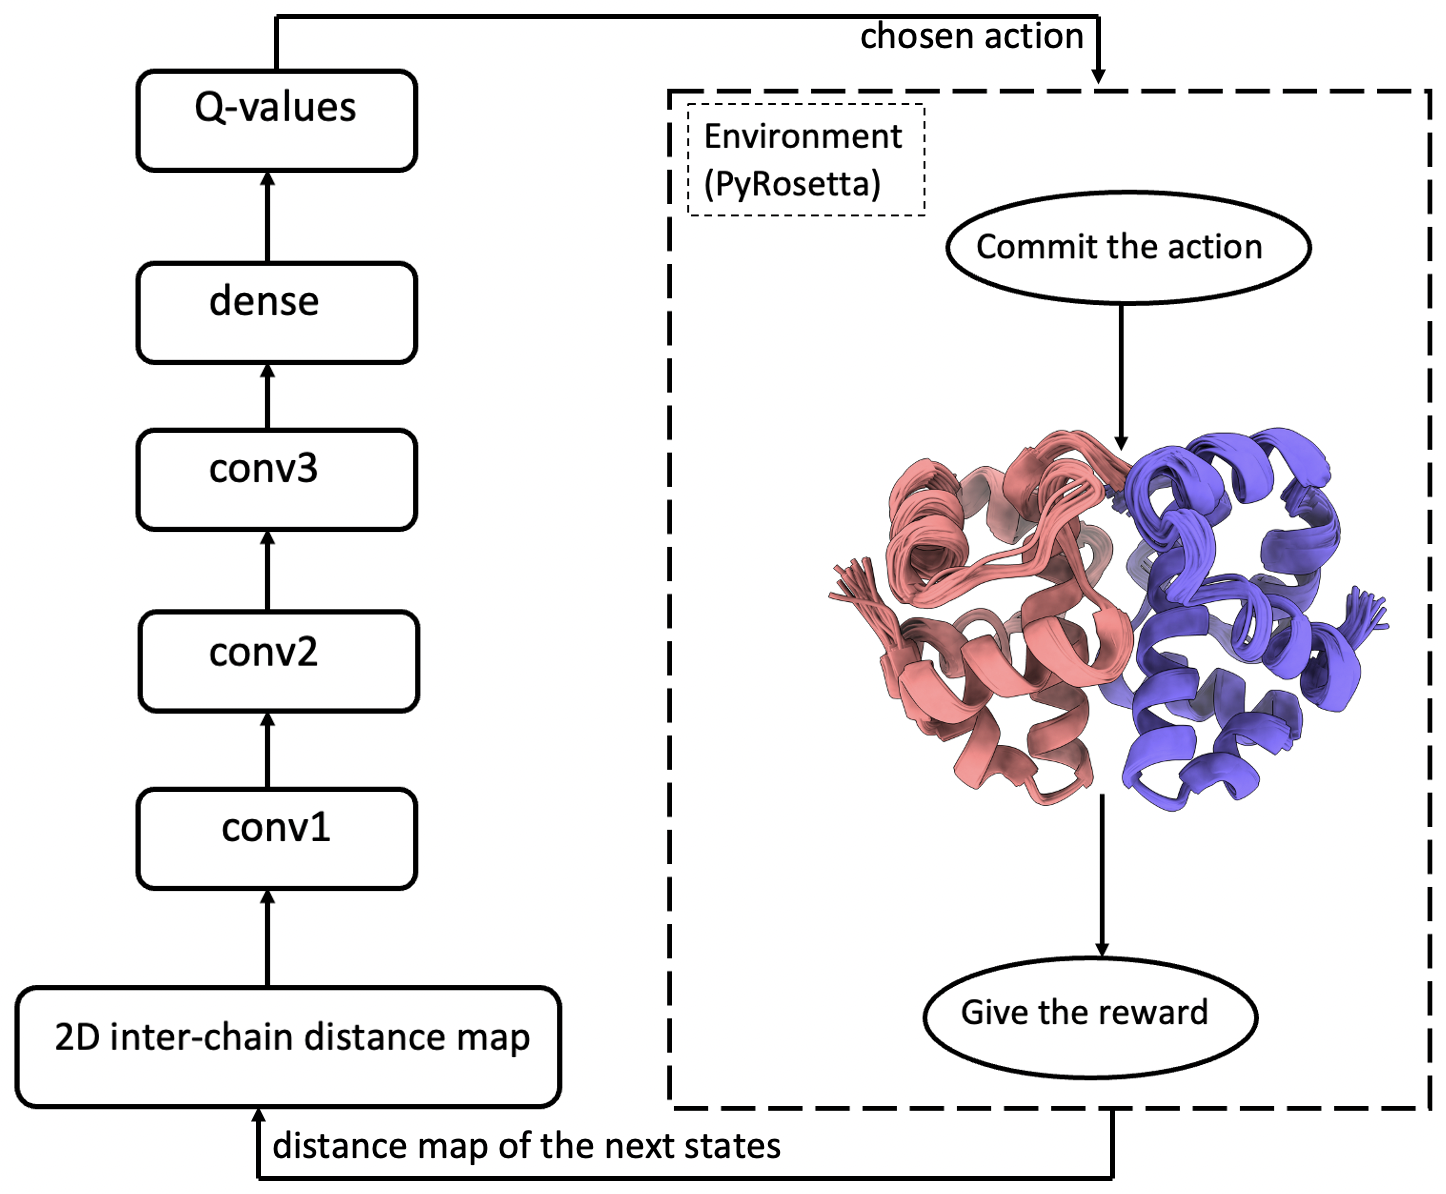
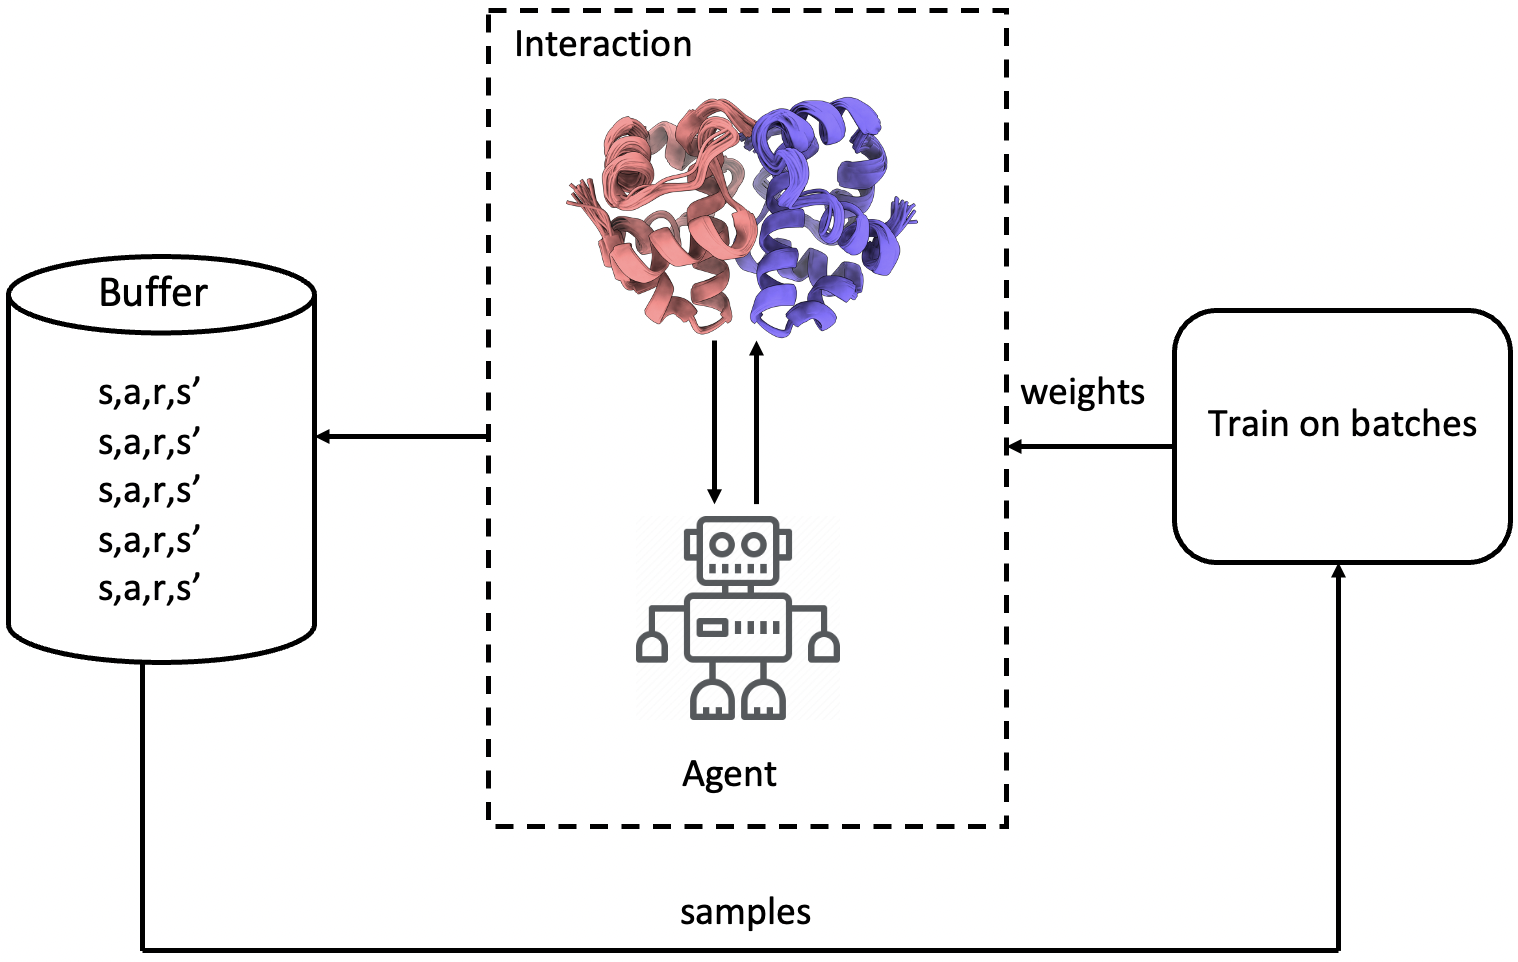
The deep convolutional neural network is trained using a sequence of examples (state (), action (), reward (), next State ()), which are automatically obtained by the agent continuously interacting with the modeling environment (implemented within PyRosetta [34]) to choose actions to adjust the position of the ligand according to an -greedy policy. Given a state at each step, the agent selects either an action having the highest value predicted by the deep network with a probability of 1 - or a random action with probability. The action () is then applied to the 3D structure of the current state () by the environment () to generate a new 3D structure corresponding to the next state (). The immediate reward () of the action is calculated as the difference between the quality of () and () with respect to the target state , which can be either the true structure of the dimer or the predicted inter-chain contact map provided to the agent at the beginning. The process is repeated to generate many examples. Notably, we use Experience Replay to train the deep network, which stores the agent’s experience at each step () within a computational buffer. Training with Experience Replay is illustrated in Figure 2.
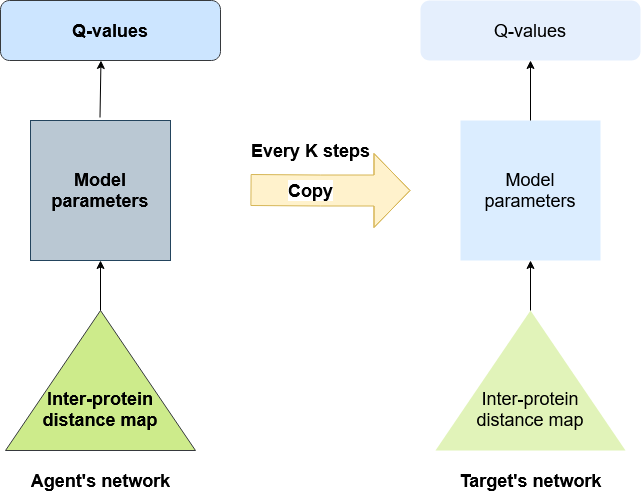
We used the immediate reward and the output of a target network (Qtarget) to generate the reference Q-value (Qreference(S, a)) for an action and a state to serve as the labels to train the deep network (Q) of the agent. The target network uses a copy of the weights of the deep network of the agent at every steps to predict the Q-value of each action (Qtarget()) for the next state (shown in Figure 3), a Q-value that is then used to estimate the future value of each action. The reference Q-value for and (Qreference(s, a)) is the immediate reward plus the predicted-highest future value, including a multiplicative discount factor (i.e, Qreference(s, a) = r(s, a) + ). The maximum future value is the maximum Q-value predicted by the target network for the next state and any possible action .
State evaluation strategies. We tested two different strategies to evaluate the quality of a state (S) to calculate the immediate reward: (1) the root mean square distance (RMSD) between the 3D structure of S and the true structure (S∗), and (2) the contact energy - the agreement between the distance map of S and the inter-chain contact map provided as the initial input. We note that only the latter is used in our final experiments, as the true structure is typically unknown in many real applications. For our first strategy, the RMSD of the current structure of S and the next state (S) is calculated as RMSDs and RMSD and the immediate reward is equal to RMSDs - RMSD. If the quality of the next state generated by action is better (i.e., RMSD < RMSDs), the agent receives a positive reward; otherwise, it gets a negative reward (i.e., a penalty).
For our second strategy, the immediate reward is the contact energy of minus the contact energy of S. The contact energy function measuring the satisfaction of a contact between any two residues is defined as shown in Equation 1.
| (1) |
In Equation 1, and represent the lower bound and upper bound of the distance () between two residues that are predicted to be in contact. Two residues are considered in contact if the distance between their closet heavy atoms is less than or equal to 6 Å. is the standard deviation, which is set to 0.1. Based on this cost function, if the distance between two residues predicted to be in contact is 6 Å, i.e., the contact restraint is satisfied, and the contact energy is 0. Otherwise, it is a positive value. The complete contact energy function for the structural model of a state (S or S) is the sum of the energies for all predicted inter-chain contacts used in modeling (called contact energy). The immediate reward is the contact energy of (S) minus that of S. The goal is to find actions to increase the satisfaction of contacts in the structure (i.e, to reduce the contact energy).
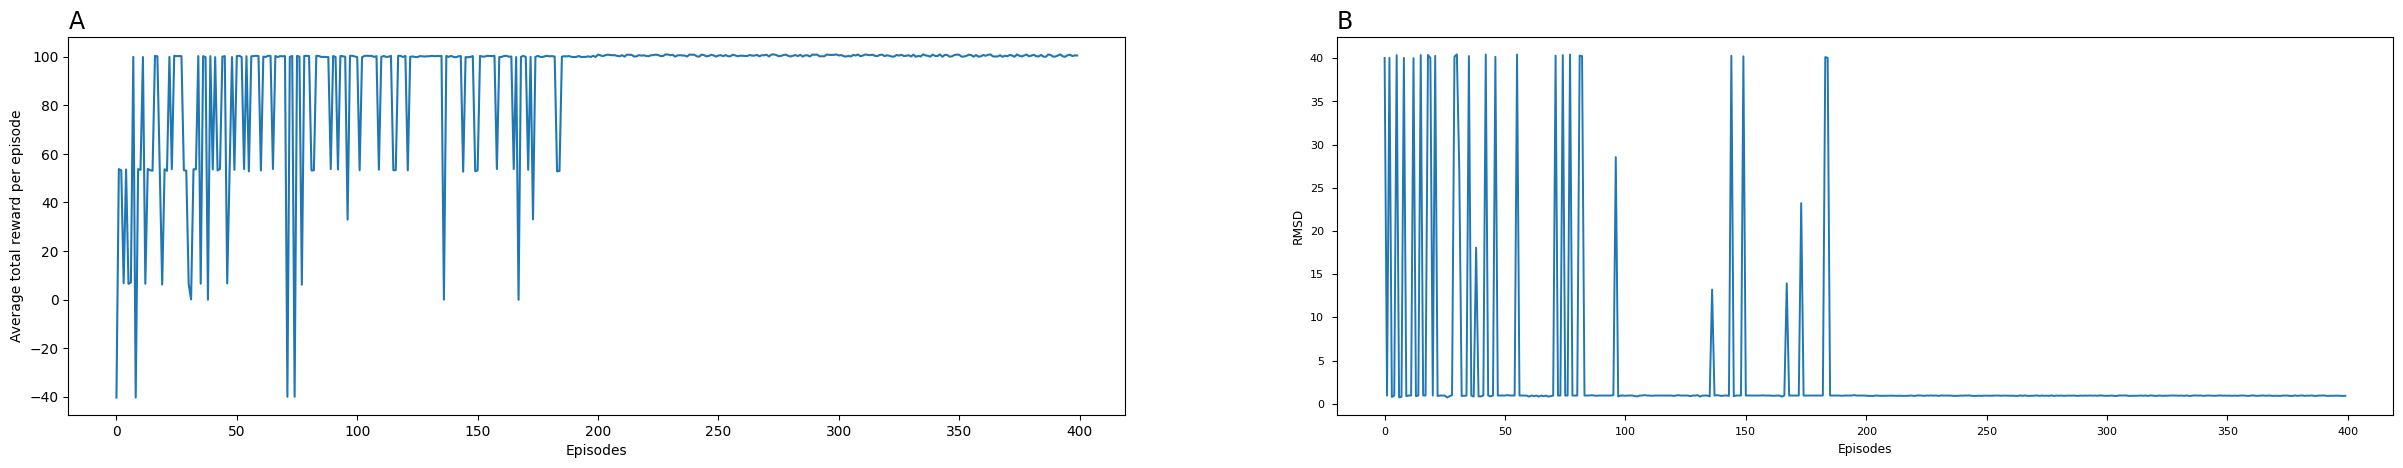
State evaluation experiment. As an example to illustrate the effect of our state evaluation strategies on DRLComplex’s reconstruction performance, Figure 4 shows how the accumulated award and the RMSD of the reconstructed structure for a protein dimer (PDB Code: 1A2D) change across episodes in the self-learning process by using the contact energy to calculate the reward. Notably, the accumulated reward converges in the last 200 episodes. The self-learning mechanism (i.e., game) finishes by generating a structure with an RMSD of 0.94 Å. This experiment demonstrates that a high-quality structure can be generated using DRLComplex to maximize rewards based on predicted inter-chain contacts. This deep network was trained for 100K steps, using a batch size of 32. Furthermore, the target network was updated every 500 steps. It is worth noting that the deep network is trained specifically for each target through self-learning. Therefore, the inference time for each target involves the training time as well.
4 Experiments
4.1 Evaluation Setup
Test Datasets. We conduct all subsequent experiments for model evaluation on two standard protein dimer datasets: CASP_CAPRI and Std_32. The CASP_CAPRI dataset consists of 28 homodimer [15] targets, and the Std_32 contains 32 heterodimer targets [22]. We note that we exclude one of the Std_32 targets from our experiments, as this target (PDB Code: 1IXRA_1IXRC) contains no inter-chain contacts between its ligand and receptor structures.
Baselines. We compare DRLComplex with four existing methods, namely gradient descent (GD) [22], Markov Chain Monte Carlo simulation (MC), EquiDock [35], and CNS [36, 37], the simulated annealing simulation used in ConComplex [13] that constructs quaternary structures. Here, we note that EquiDock is an equivariant neural network that directly predicts quaternary structures of dimers without using inter-chain contacts as input. In contrast, DRLComplex, GD, MC, and CNS all reconstruct quaternary structures from inter-chain contacts.
Evaluation Methods. Each method is evaluated under three scenarios: the optimal scenario, the suboptimal scenario, and the realistic scenario. In the optimal scenario, true inter-chain contacts are extracted from the native quaternary structures of protein dimers and used as input to guide the assembly of the true tertiary structures of monomers in their bound state into quaternary structures. Here, an inter-chain contact is a pair of residues from the two chains in a dimer in which the shortest distance between their heavy atoms is less than or equal to 6 Å [14]. In the suboptimal scenario, the predicted inter-chain contacts together with the true tertiary structure of monomers in their bound state are used as input. We used two inter-chain contact predictors for this scenario, DRCon (6 Å version) to predict inter-chain contacts for the CASP_CAPRI homodimer dataset and GLINTER [17] to predict inter-chain contacts for the Std_32 heterodimer dataset. In the final and most realistic scenario, both the predicted inter-chain contacts as well as the unbound tertiary structures of monomers predicted by AlphaFold 2 [10] are used as input.
The performance of these methods is evaluated by comparing their reconstructed structures with native/true structures of the dimers using TMalign [38] and DockQ [39]. The evaluation metrics include TM-score, root-mean-square deviation (RMSD) of the entire structure with respect to the native structure, the fraction of the native inter-chain contacts in the reconstructed structures (, interface RMSD (I_RMSD), and Ligand(L_RMSD).
Implementation Details. As shown in Equation 2, we used the average squared error as the loss to train DRLComplex’s Q network, where is the number of states. We also used a stochastic gradient descent optimizer with a mini-batch size of 64 for training. During each experiment, of the -policy is decreased from 1 to 0.1 for the first 100,000 iterations via exponential decay (decay factor = 0.99) and is fixed at 0.1 thereafter. We trained DRLComplex using three Nvidia GPUs, each with 32 GB, on a system with 350GB of RAM in total.
| (2) |
4.2 Results
Evaluation on the Std_32 Heterodimer Dataset.
| Optimal Scenario | |||||
|---|---|---|---|---|---|
| Methods | TM-score ( ) | RMSD ( ) | fnat (%, ) | I_RMSD ( ) | L_RMSD ( ) |
| DRLComplex | 0.98 | 0.88 | 90.03 | 0.92 | 2.15 |
| GD | 0.95 | 2.9 | 92.43 | 1.99 | 7.16 |
| MC | 0.94 | 3.1 | 92.24 | 2.2 | 7.18 |
| CNS | 0.82 | 10.04 | 69.13 | 3.71 | 14.99 |
| Suboptimal Scenario | |||||
|---|---|---|---|---|---|
| Methods | TM-score ( ) | RMSD ( ) | fnat (%, ) | I_RMSD ( ) | L_RMSD ( ) |
| DRLComplex | 0.76 | 13.93 | 19.64 | 13.68 | 34.16 |
| GD | 0.75 | 13.92 | 16.68 | 13.72 | 34.17 |
| MC | 0.73 | 14.14 | 13.88 | 13.82 | 35.36 |
| CNS | 0.68 | 17.09 | 17.26 | 15.81 | 43.12 |
| EquiDock | 0.61 | 18.53 | 4.95 | 14.98 | 36.11 |
| Realistic Scenario | |||||
|---|---|---|---|---|---|
| Methods | TM-score ( ) | RMSD ( ) | fnat (%, ) | I_RMSD ( ) | L_RMSD ( ) |
| DRLComplex | 0.74 | 14.53 | 11.80 | 13.86 | 36.18 |
| GD | 0.73 | 14.54 | 11.71 | 13.85 | 36.17 |
| MC | 0.70 | 15.06 | 11.25 | 14.60 | 36.66 |
| CNS | 0.66 | 19.02 | 3.78 | 14.74 | 37.91 |
| EquiDock | 0.59 | 18.63 | 3.55 | 14.42 | 35.97 |
The performance of all the methods on the Std_32 heterodimer dataset is reported in Table 1, Table 2, and Table 3 for optimal, suboptimal, and realistic scenarios, respectively. In the optimal scenario, Table 1 shows that DRLComplex outperforms all other the methods in all the evaluation metrics except for . In particular, the difference in terms of RMSD is even more pronounced. For example, the average RMSDs of DRLComplex, GD, MC, and CNS are 0.88 Å, 2.9 Å, 3.1 Å, and 10.04 Å, respectively.
In the suboptimal scenario, Table 2 shows that DRLComplex’s performance is better overall than all other methods. For instance, the TM-score of the DRLComplex is 1.33%, 4.1%, 11.7%, and 24.5% better than that of GD, MC, CNS, and EquiDock, respectively.
Similarly, regarding the realistic scenario, Table 3 demonstrates that DRLComplex’s performance is better overall than other methods, as it has the best performance in terms of TM-score, RMSD, and . As shown in Table 6, the TM-score of DRLComplex is 1.3%, 5.7%, 12.2% and 25.4% better than that of GD, MC, CNS, and EquiDock, respectively.
Performance on CASP_CAPRI Homodimer Dataset.
| Optimal Scenario | |||||
|---|---|---|---|---|---|
| Methods | TM-score ( ) | RMSD ( ) | fnat (%, ) | I_RMSD ( ) | L_RMSD ( ) |
| DRLComplex | 0.9895 | 0.3753 | 99.05 | 0.2197 | 0.8235 |
| GD | 0.9895 | 0.3753 | 99.03 | 0.3468 | 0.8235 |
| MC | 0.9631 | 1.2089 | 78.91 | 1.1611 | 2.8897 |
| CNS | 0.9234 | 2.003 | 73.45 | 3.9234 | 4.6841 |
| Suboptimal Scenario | |||||
|---|---|---|---|---|---|
| Methods | TM-score ( ) | RMSD ( ) | fnat (%, ) | I_RMSD ( ) | L_RMSD ( ) |
| DRLComplex | 0.73 | 11.88 | 32.21 | 10.43 | 26.52 |
| GD | 0.74 | 11.09 | 35.51 | 9.66 | 25.21 |
| MC | 0.72 | 12.04 | 32.65 | 10.47 | 26.98 |
| CNS | 0.62 | 14.55 | 28.32 | 14.37 | 36.25 |
| EquiDock | 0.56 | 18.57 | 6.51 | 14.5 | 35.24 |
| Realistic Scenario | |||||
|---|---|---|---|---|---|
| Methods | TM-score ( ) | RMSD ( ) | fnat (%, ) | I_RMSD ( ) | L_RMSD ( ) |
| DRLComplex | 0.64 | 12.18 | 27.1 | 10.73 | 26.54 |
| GD | 0.69 | 12.15 | 28.05 | 10.69 | 26.50 |
| MC | 0.63 | 12.78 | 26.81 | 11.89 | 28.92 |
| CNS | 0.62 | 14.55 | 13.58 | 12.62 | 31.69 |
| EquiDock | 0.50 | 26.59 | 22.27 | 18.39 | 44.66 |
The average performance of methods on the CASP_CAPRI homodimer dataset for the optimal, suboptimal, and realistic scenarios are reported in Tables 4, 5, and 6, respectively. In the optimal scenario, Table 4 shows that DRLComplex performs equally well or better than all other predictors in terms of all evaluation metrics, followed by GD. For 10 of the 28 targets, DRLComplex reconstructs quaternary structures with a perfect score of 1.0. Here, DRLComplex’s average fraction of true inter-chain contacts recalled in the reconstructed structures () is 99.05 %, indicating that DRLComplex reconstructs highly accurate quaternary structures for dimers when an optimal input is provided. We note that EquiDock was not included in this scenario as it does not use any inter-chain contacts as input but rather directly predicts a translation and rotation of the ligand with respect to the receptor.
In the sub-optimal scenario, Table 5 shows that GD, DRLComplex, and MC’s performance is close, while they all outperform CNS and EquiDock by a large margin. For instance, the average TM-score of DRLComplex is 17.7% and 30.4% higher than that of CNS and EquiDock, respectively.
Lastly, in the realistic scenario, Table 6 shows that GD performs best here, with DRLComplex following as the second-best method. Nonetheless, here DRLComplex outperforms all other methods. For example, the TM-score of the complexes constructed by DRLComplex is 1.59%, 3.22%, and 28% better than that of MC, CNS, and EquiDock, respectively. We note that here the TM-score of DRLComplex drops from 0.989 to 0.73 since in this case, its predicted inter-chain contacts contain fewer true contacts as well as some false contacts.
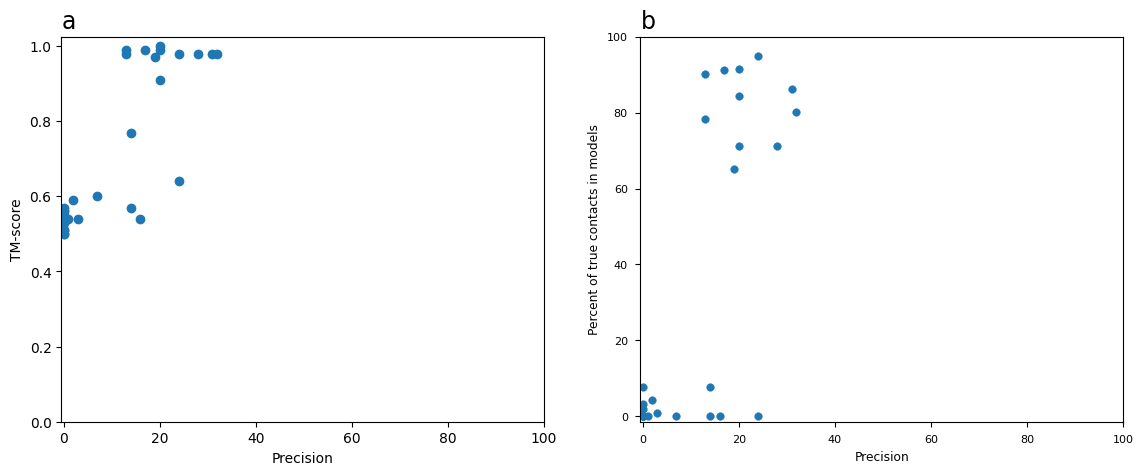
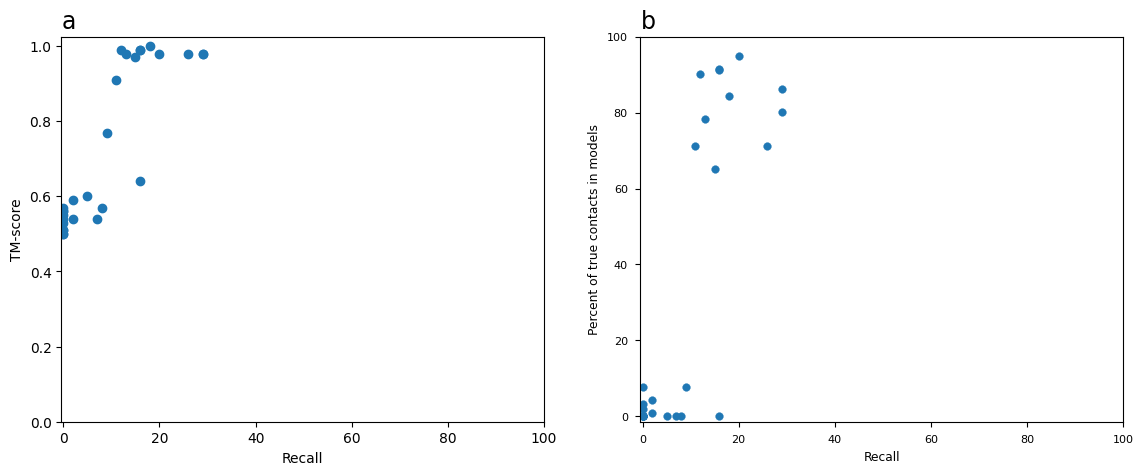
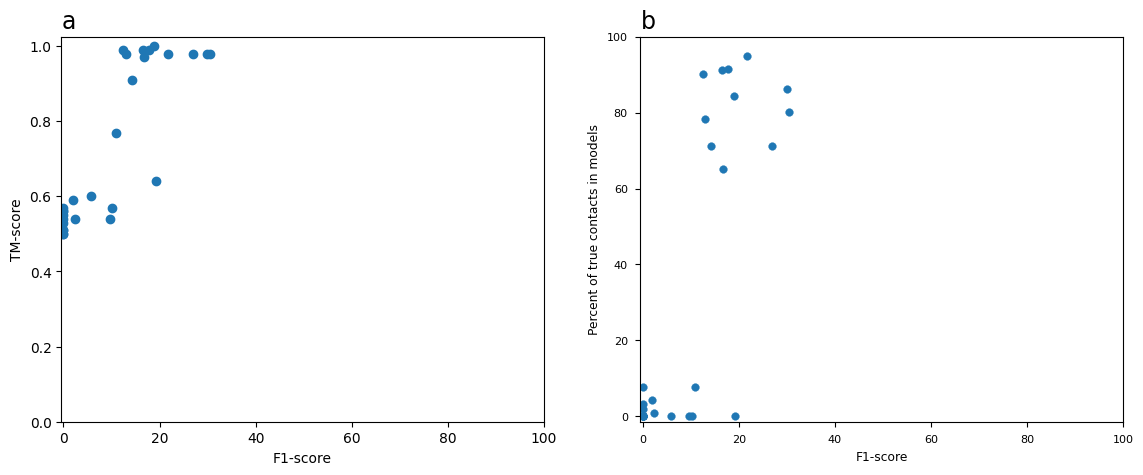
Relationship between structural quality and inter-chain contact accuracy. In Appendix A, we further investigate TM-score and ’s relationship to the precision, recall, and F1 score of DRLComplex’s predicted inter-chain contact inputs. In particular, Figures 6, 7, and 8 demonstrate that the quality of DRLComplex’s reconstructed structures largely increases with an increase in the accuracy of its predicted inter-chain contact inputs.
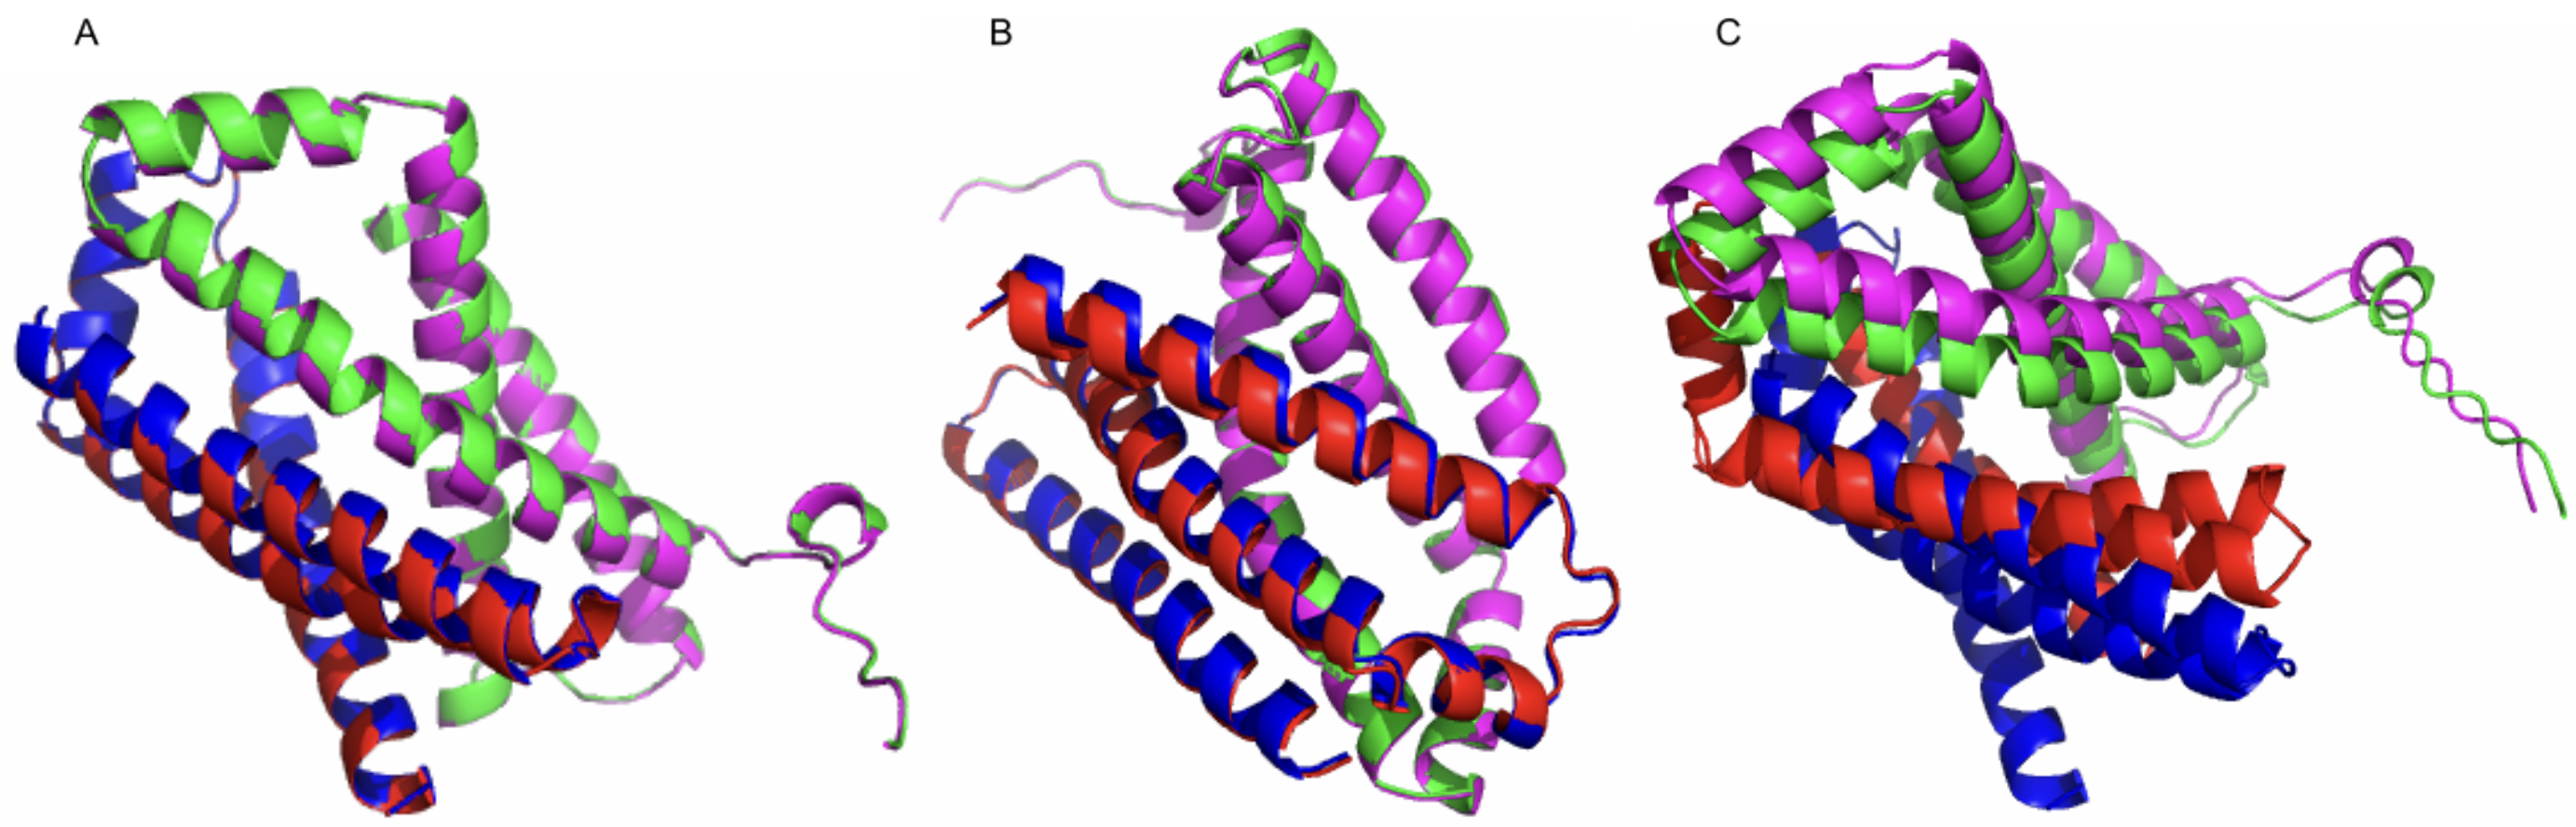
Visualization. Figure 5 illustrates the reconstructed quaternary structure for a heterodimer alongside its corresponding true structure.
Limitations. Currently, DRLComplex adopts a self-play mechanism to speed up its predictions. However, in future works, we would like to investigate alternative data-efficient means of decreasing the time required to train DRLComplex models.
5 Conclusion
We developed a novel deep reinforcement learning method (DRLComplex) to reconstruct the quaternary structures from inter-chain contacts. It is the first such method to use the reinforcement self-learning to adjust the position of one protein (a ligand) with respect to another (a receptor), considering both short and long-term rewards to search for near-native quaternary structures. Our experiments demonstrate that DRLComplex can successfully generate high-quality structural models for nearly all dimers tested when true inter-chain contacts are provided. We have shown that DRLComplex can also construct the structural model of protein complexes from predicted contacts with reasonable quality if such contact inputs are of sufficient accuracy. Evaluating DRLComplex under increasingly-difficult real-world scenarios demonstrates that our method achieves state-of-the-art results for reconstruction of protein dimer structures using inter-chain contacts as input. In future works, we plan to pre-train DRLComplex on a large set of representative protein dimers to enable the model to directly predict the assembly actions for two units of any new dimer into near-native structures without using on-the-fly self-learning to speed up the model’s predictions. As such, we believe DRLComplex will help encourage the adoption of novel deep learning algorithms in drug discovery.
6 Broader Impacts
Built upon a simple architecture, our novel method, DRLComplex, is a good case to prove that a self-learning algorithm can learn to reconstruct protein complexes without any guidance or domain knowledge, as accurately as possible. This method can significantly enhance the ability to reconstruct the protein complexes from disoriented or disordered protein clusters by rearranging them in their native conformation state. As explained in our future work, further training of DRLComplex on larger datasets and extending it to predict structures of higher-order multimers could significantly increase the accuracy of its predictions with drastic improvements in speed in comparison to the other simulation methods such as Monte Carlo and simulated annealing methods. Our ideas may also inspire other researchers to conduct new research into the applications of deep reinforcement learning to similar fields like gene regulation, protein-ligand interaction, and drug design, with the introduction of better and more complex architectures as suited to their field. To enable reproducibility and extensions of our work, we have made our code open-source.
References
- Jones and Kandathil [2018] David T Jones and Shaun M Kandathil. High precision in protein contact prediction using fully convolutional neural networks and minimal sequence features. Bioinformatics, 34(19):3308–3315, 2018.
- Adhikari et al. [2018] Badri Adhikari, Jie Hou, and Jianlin Cheng. Dncon2: improved protein contact prediction using two-level deep convolutional neural networks. Bioinformatics, 34(9):1466–1472, 2018.
- Li et al. [2019] Yang Li, Jun Hu, Chengxin Zhang, Dong-Jun Yu, and Yang Zhang. Respre: high-accuracy protein contact prediction by coupling precision matrix with deep residual neural networks. Bioinformatics, 35(22):4647–4655, 2019.
- Senior et al. [2019] Andrew W Senior, Richard Evans, John Jumper, James Kirkpatrick, Laurent Sifre, Tim Green, Chongli Qin, Augustin Žídek, Alexander WR Nelson, Alex Bridgland, et al. Protein structure prediction using multiple deep neural networks in the 13th critical assessment of protein structure prediction (casp13). Proteins: Structure, Function, and Bioinformatics, 87(12):1141–1148, 2019.
- Yang et al. [2020] Jianyi Yang, Ivan Anishchenko, Hahnbeom Park, Zhenling Peng, Sergey Ovchinnikov, and David Baker. Improved protein structure prediction using predicted interresidue orientations. Proceedings of the National Academy of Sciences, 117(3):1496–1503, 2020.
- Wu et al. [2021] Tianqi Wu, Zhiye Guo, Jie Hou, and Jianlin Cheng. Deepdist: real-value inter-residue distance prediction with deep residual convolutional network. BMC bioinformatics, 22(1):1–17, 2021.
- Kryshtafovych et al. [2014] Andriy Kryshtafovych, Bohdan Monastyrskyy, and Krzysztof Fidelis. Casp prediction center infrastructure and evaluation measures in casp10 and casp roll. PROTEINS: structure, function, and bioinformatics, 82:7–13, 2014.
- Kryshtafovych et al. [2019] Andriy Kryshtafovych, Torsten Schwede, Maya Topf, Krzysztof Fidelis, and John Moult. Critical assessment of methods of protein structure prediction (casp)—round xiii. Proteins: Structure, Function, and Bioinformatics, 87(12):1011–1020, 2019.
- Won et al. [2019] Jonghun Won, Minkyung Baek, Bohdan Monastyrskyy, Andriy Kryshtafovych, and Chaok Seok. Assessment of protein model structure accuracy estimation in casp13: challenges in the era of deep learning. Proteins: Structure, Function, and Bioinformatics, 87(12):1351–1360, 2019.
- Jumper et al. [2020] John Jumper, Richard Evans, Alexander Pritzel, Tim Green, Michael Figurnov, Kathryn Tunyasuvunakool, Olaf Ronneberger, Russ Bates, Augustin Žídek, Alex Bridgland, et al. Alphafold 2, 2020.
- Zeng et al. [2018] Hong Zeng, Sheng Wang, Tianming Zhou, Feifeng Zhao, Xiufeng Li, Qing Wu, and Jinbo Xu. Complexcontact: a web server for inter-protein contact prediction using deep learning. Nucleic acids research, 46(W1):W432–W437, 2018.
- Hou et al. [2020] Jie Hou, Tianqi Wu, Zhiye Guo, Farhan Quadir, and Jianlin Cheng. The multicom protein structure prediction server empowered by deep learning and contact distance prediction. In Protein Structure Prediction, pages 13–26. Springer, 2020.
- Quadir et al. [2021a] Farhan Quadir, Raj S Roy, Elham Soltanikazemi, and Jianlin Cheng. Deepcomplex: A web server of predicting protein complex structures by deep learning inter-chain contact prediction and distance-based modelling. Frontiers in Molecular Biosciences, page 827, 2021a.
- Quadir et al. [2021b] Farhan Quadir, Raj S Roy, Randal Halfmann, and Jianlin Cheng. Dncon2_inter: predicting interchain contacts for homodimeric and homomultimeric protein complexes using multiple sequence alignments of monomers and deep learning. Scientific reports, 11(1):1–10, 2021b.
- Yan and Huang [2021] Yumeng Yan and Sheng-You Huang. Accurate prediction of inter-protein residue–residue contacts for homo-oligomeric protein complexes. Briefings in bioinformatics, 22(5):bbab038, 2021.
- Roy et al. [2022] Raj S Roy, Farhan Quadir, Elham Soltanikazemi, and Jianlin Cheng. A deep dilated convolutional residual network for predicting interchain contacts of protein homodimers. Bioinformatics, 38(7):1904–1910, 2022.
- Xie and Xu [2022] Ziwei Xie and Jinbo Xu. Deep graph learning of inter-protein contacts. Bioinformatics, 38(4):947–953, 2022.
- Lyskov and Gray [2008] Sergey Lyskov and Jeffrey J Gray. The rosettadock server for local protein–protein docking. Nucleic acids research, 36(suppl_2):W233–W238, 2008.
- Pierce et al. [2014] Brian G Pierce, Kevin Wiehe, Howook Hwang, Bong-Hyun Kim, Thom Vreven, and Zhiping Weng. Zdock server: interactive docking prediction of protein–protein complexes and symmetric multimers. Bioinformatics, 30(12):1771–1773, 2014.
- Park et al. [2021] Taeyong Park, Jonghun Won, Minkyung Baek, and Chaok Seok. Galaxyheteromer: protein heterodimer structure prediction by template-based and ab initio docking. Nucleic Acids Research, 49(W1):W237–W241, 2021.
- Evans et al. [2021] Richard Evans, Michael O’Neill, Alexander Pritzel, Natasha Antropova, Andrew W Senior, Timothy Green, Augustin Žídek, Russell Bates, Sam Blackwell, Jason Yim, et al. Protein complex prediction with alphafold-multimer. BioRxiv, 2021.
- Soltanikazemi et al. [2022] Elham Soltanikazemi, Farhan Quadir, Raj S Roy, Zhiye Guo, and Jianlin Cheng. Distance-based reconstruction of protein quaternary structures from inter-chain contacts. Proteins: Structure, Function, and Bioinformatics, 90(3):720–731, 2022.
- Tuncbag et al. [2012] Nurcan Tuncbag, Ozlem Keskin, Ruth Nussinov, and Attila Gursoy. Fast and accurate modeling of protein–protein interactions by combining template-interface-based docking with flexible refinement. Proteins: Structure, Function, and Bioinformatics, 80(4):1239–1249, 2012.
- Guerler et al. [2013] Aysam Guerler, Brandon Govindarajoo, and Yang Zhang. Mapping monomeric threading to protein–protein structure prediction. Journal of chemical information and modeling, 53(3):717–725, 2013.
- Lensink et al. [2021] Marc F Lensink, Guillaume Brysbaert, Théo Mauri, Nurul Nadzirin, Sameer Velankar, Raphael AG Chaleil, Tereza Clarence, Paul A Bates, Ren Kong, Bin Liu, et al. Prediction of protein assemblies, the next frontier: The casp14-capri experiment. Proteins: Structure, Function, and Bioinformatics, 89(12):1800–1823, 2021.
- Morehead et al. [2021] Alex Morehead, Chen Chen, and Jianlin Cheng. Geometric transformers for protein interface contact prediction. arXiv preprint arXiv:2110.02423, 2021.
- Baek et al. [2021] Minkyung Baek, Frank DiMaio, Ivan Anishchenko, Justas Dauparas, Sergey Ovchinnikov, Gyu Rie Lee, Jue Wang, Qian Cong, Lisa N Kinch, R Dustin Schaeffer, et al. Accurate prediction of protein structures and interactions using a three-track neural network. Science, 373(6557):871–876, 2021.
- Silver et al. [2016] David Silver, Aja Huang, Chris J Maddison, Arthur Guez, Laurent Sifre, George Van Den Driessche, Julian Schrittwieser, Ioannis Antonoglou, Veda Panneershelvam, Marc Lanctot, et al. Mastering the game of go with deep neural networks and tree search. nature, 529(7587):484–489, 2016.
- Mnih et al. [2013] Volodymyr Mnih, Koray Kavukcuoglu, David Silver, Alex Graves, Ioannis Antonoglou, Daan Wierstra, and Martin Riedmiller. Playing atari with deep reinforcement learning. arXiv preprint arXiv:1312.5602, 2013.
- Vinyals et al. [2019] Oriol Vinyals, Igor Babuschkin, Wojciech M Czarnecki, Michaël Mathieu, Andrew Dudzik, Junyoung Chung, David H Choi, Richard Powell, Timo Ewalds, Petko Georgiev, et al. Grandmaster level in starcraft ii using multi-agent reinforcement learning. Nature, 575(7782):350–354, 2019.
- Wang et al. [2018] Zi Wang, Dali Wang, Chengcheng Li, Yichi Xu, Husheng Li, and Zhirong Bao. Deep reinforcement learning of cell movement in the early stage of c. elegans embryogenesis. Bioinformatics, 34(18):3169–3177, 2018.
- Hou et al. [2019] Hanxu Hou, Tian Gan, Yaodong Yang, Xianglei Zhu, Sen Liu, Weiming Guo, and Jianye Hao. Using deep reinforcement learning to speed up collective cell migration. BMC bioinformatics, 20(18):1–10, 2019.
- Bocicor et al. [2011] Maria-Iuliana Bocicor, Gabriela Czibula, and Istvan-Gergely Czibula. A reinforcement learning approach for solving the fragment assembly problem. In 2011 13th international symposium on symbolic and numeric algorithms for scientific computing, pages 191–198. IEEE, 2011.
- Chaudhury et al. [2010] Sidhartha Chaudhury, Sergey Lyskov, and Jeffrey J Gray. Pyrosetta: a script-based interface for implementing molecular modeling algorithms using rosetta. Bioinformatics, 26(5):689–691, 2010.
- Ganea et al. [2021] Octavian-Eugen Ganea, Xinyuan Huang, Charlotte Bunne, Yatao Bian, Regina Barzilay, Tommi Jaakkola, and Andreas Krause. Independent se (3)-equivariant models for end-to-end rigid protein docking. arXiv preprint arXiv:2111.07786, 2021.
- Brünger et al. [1998] Axel T Brünger, Paul D Adams, G Marius Clore, Warren L DeLano, Piet Gros, Ralf W Grosse-Kunstleve, J-S Jiang, John Kuszewski, Michael Nilges, Navraj S Pannu, et al. Crystallography & nmr system: A new software suite for macromolecular structure determination. Acta Crystallographica Section D: Biological Crystallography, 54(5):905–921, 1998.
- Brunger [2007] Axel T Brunger. Version 1.2 of the crystallography and nmr system. Nature protocols, 2(11):2728–2733, 2007.
- Zhang and Skolnick [2005] Yang Zhang and Jeffrey Skolnick. Tm-align: a protein structure alignment algorithm based on the tm-score. Nucleic acids research, 33(7):2302–2309, 2005.
- Basu and Wallner [2016] Sankar Basu and Björn Wallner. Dockq: a quality measure for protein-protein docking models. PloS one, 11(8):e0161879, 2016.
Appendix A Additional Results
Inter-chain contact importance study. In Figures 6, 7, and 8, we inspect the relationship between TM-score (and ) and the precision, recall, and F1 score of DRLComplex’s predicted inter-chain contact inputs, to better understand the factors influencing DRLComplex’s success in reconstructing quaternary structures. In short, we find that as inter-chain contact accuracy increases, so does the structural quality of DRLComplex’s quaternary reconstructions.
Expanded structure quality results. In this section, we describe detailed evaluations done on each target of both the CASP_CAPRI homodimer and Std_32 heterodimer datasets. The performance of DRLComplex on all the targets of the CASP_CAPRI homodimer dataset is reported in Tables 7, 8, and 9. Similarly, the performance of DRLComplex on all the targets of the Std_32 heterodimer dataset is reported in Tables 10, 11, and 12.
| Optimal Scenario | |||||
|---|---|---|---|---|---|
| Targets | RMSD ( ) | TM-score ( ) | fnat (%, ) | I_RMSD ( ) | L_RMSD ( ) |
| T0759 | 0.22 | 0.998 | 100 | 0.224 | 0.527 |
| T0764 | 0.18 | 0.9995 | 100 | 0.193 | 0.391 |
| T0770 | 0.26 | 0.9992 | 98.4 | 0.262 | 0.562 |
| T0776 | 0.19 | 0.9992 | 100 | 0.2 | 0.475 |
| T0780 | 0.15 | 0.9995 | 97.8 | 0.157 | 0.324 |
| T0792 | 0.56 | 0.9851 | 97.7 | 0.434 | 1.393 |
| T0801 | 0.22 | 0.9993 | 99.3 | 0.256 | 0.535 |
| T0805 | 0.16 | 0.9994 | 97.4 | 0.167 | 0.338 |
| T0811 | 0.23 | 0.9991 | 98.5 | 0.23 | 0.516 |
| T0813 | 0.12 | 0.9998 | 98.6 | 0.125 | 0.261 |
| T0815 | 3.57 | 0.768 | 100 | 2.979 | 7.106 |
| T0819 | 0.2 | 0.9994 | 99.2 | 0.209 | 0.424 |
| T0825 | 0.37 | 0.9967 | 100 | 0.326 | 0.922 |
| T0843 | 0.24 | 0.9993 | 99.4 | 0.252 | 0.532 |
| T0847 | 0.21 | 0.9989 | 100 | 0.218 | 0.468 |
| T0849 | 0.25 | 0.9988 | 99.2 | 0.264 | 0.537 |
| T0851 | 0.22 | 0.9995 | 99 | 0.222 | 0.45 |
| T0852 | 0.26 | 0.9991 | 98.6 | 0.279 | 0.636 |
| T0893 | 0.38 | 0.9852 | 99 | 0.278 | 0.89 |
| T0965 | 0.38 | 0.998 | 100 | 0.35 | 0.804 |
| T0966 | 0.24 | 0.9994 | 100 | 0.272 | 0.633 |
| T0976 | 0.23 | 0.9991 | 100 | 0.209 | 0.492 |
| T0984 | 0.29 | 0.9993 | 99.1 | 0.227 | 0.663 |
| T0999D1 | 0.38 | 0.9983 | 98.1 | 0.37 | 0.863 |
| T0999D4 | 0.28 | 0.9986 | 100 | 0.265 | 0.749 |
| T1003 | 0.18 | 0.9996 | 98.8 | 0.189 | 0.393 |
| T1006 | 0.34 | 0.9941 | 96.8 | 0.347 | 0.742 |
| T1032 | 0.2 | 0.999 | 98.2 | 0.208 | 0.433 |
| Mean | 0.3753 | 0.9895 | 99.05 | 0.2197 | 0.8235 |
| Suboptimal Scenario | |||||
|---|---|---|---|---|---|
| Targets | RMSD ( ) | TM-score ( ) | fnat (%, ) | I_RMSD ( ) | L_RMSD ( ) |
| T0976 | 18.69 | 0.54 | 0 | 17.8 | 36 |
| T0776 | 4.65 | 0.77 | 7.6 | 5.706 | 13.31 |
| T0813 | 0.98 | 0.99 | 90.1 | 0.925 | 2.366 |
| T0852 | 29.34 | 0.57 | 0 | 21.71 | 48.98 |
| T0966 | 27.26 | 0.53 | 0 | 12.55 | 62.44 |
| T1003 | 0.89 | 0.99 | 91.3 | 0.833 | 1.719 |
| T0819 | 0.62 | 1 | 84.3 | 0.631 | 1.211 |
| T0965 | 16.28 | 0.59 | 4.3 | 13.86 | 28.57 |
| T0792 | 14.57 | 0.5 | 0 | 14.93 | 40.23 |
| T0851 | 1.3 | 0.98 | 80.2 | 0.858 | 1.819 |
| T0815 | 10.52 | 0.51 | 0 | 11.9 | 32.47 |
| T0770 | 24.99 | 0.54 | 0 | 23.16 | 50.39 |
| T1032 | 18.13 | 0.54 | 0.9 | 17.07 | 29.24 |
| T0999D1 | 14.42 | 0.64 | 0 | 12.66 | 27.34 |
| T0805 | 1.07 | 0.98 | 78.4 | 1.08 | 2.326 |
| T0780 | 22.7 | 0.55 | 0 | 21.52 | 55.84 |
| T1006 | 16.05 | 0.5 | 0 | 19.34 | 50.87 |
| T0843 | 0.92 | 0.99 | 91.4 | 0.942 | 1.466 |
| T0893 | 0.85 | 0.98 | 94.8 | 0.92 | 1.94 |
| T0811 | 1.08 | 0.98 | 86.3 | 0.901 | 3.675 |
| T0984 | 39.94 | 0.56 | 1.8 | 31.43 | 72.91 |
| T0849 | 1.07 | 0.98 | 71.2 | 1.086 | 3.437 |
| T0764 | 13.7 | 0.56 | 3.2 | 12.97 | 33.29 |
| T0759 | 14.09 | 0.51 | 0 | 12.38 | 38.39 |
| T0999D4 | 2.48 | 0.91 | 71.1 | 1.661 | 10.3 |
| T0825 | 17.39 | 0.57 | 7.8 | 14.91 | 32.18 |
| T0847 | 17.08 | 0.6 | 0 | 16.69 | 55.77 |
| T0801 | 1.67 | 0.97 | 65.24 | 1.72 | 3.98 |
| Mean | 11.8832 | 0.73 | 33.2121 | 10.4336 | 26.5163 |
| Realistic Scenario | ||||||
|---|---|---|---|---|---|---|
| Targets | RMSD ( ) | TM-score ( ) | fnat (%, ) | I_RMSD ( ) | L_RMSD ( ) | TM-score (monomer) |
| T1003 | 0.58 | 0.92 | 78 | 0.51 | 0.8 | 0.9964 |
| T0984 | 33.57 | 0.48 | 2 | 27.17 | 57.5 | 0.9805 |
| T0792 | 12.7 | 0.49 | 7 | 12.16 | 30.47 | 0.9585 |
| T0805 | 1.83 | 0.94 | 75 | 1.85 | 2.39 | 0.9675 |
| T0851 | 2.03 | 0.93 | 73 | 1.68 | 3.01 | 0.9687 |
| T0999D1 | 16.52 | 0.51 | 2 | 13.24 | 34.22 | 0.9708 |
| T0815 | 14.7 | 0.49 | 1 | 11.29 | 47.88 | 0.9789 |
| T0759 | 15.62 | 0.4 | 7 | 12.42 | 35.6 | 0.7475 |
| T0893 | 20.09 | 0.36 | 32 | 15.39 | 54.24 | 0.7178 |
| T0825 | 18.23 | 0.49 | 0 | 15.64 | 30.46 | 0.9655 |
| T0819 | 1.94 | 0.88 | 47 | 2.28 | 2.22 | 0.9705 |
| T1006 | 11.39 | 0.47 | 0 | 11.93 | 33.96 | 0.9859 |
| T0966 | 32.4 | 0.48 | 9 | 30.28 | 76.42 | 0.9529 |
| T0770 | 11.7 | 0.53 | 8 | 13.61 | 28.94 | 0.9777 |
| T0843 | 1.04 | 0.95 | 63 | 0.9 | 1.72 | 0.988 |
| T0999D4 | 7.03 | 0.59 | 0 | 8.09 | 17.99 | 0.9767 |
| T0780 | 22.17 | 0.46 | 4 | 21.1 | 56.72 | 0.9599 |
| T0976 | 18.16 | 0.52 | 3 | 16.99 | 34.17 | 0.9777 |
| T0811 | 0.88 | 0.96 | 77 | 0.87 | 2.24 | 0.993 |
| T0852 | 33.26 | 0.45 | 6 | 21.91 | 52.15 | 0.9334 |
| T1032 | 6.25 | 0.6 | 45 | 5.6 | 8.49 | 0.7 |
| T0776 | 4.8 | 0.75 | 26 | 3.57 | 18.46 | 0.9765 |
| T0801 | 2.12 | 0.88 | 57 | 2.3 | 4.11 | 0.9648 |
| T0813 | 1.14 | 0.97 | 69 | 1.34 | 1.2 | 0.9818 |
| T0764 | 15.14 | 0.55 | 1 | 16.74 | 27.8 | 0.9882 |
| T0849 | 1.38 | 0.88 | 64 | 1.14 | 1.79 | 0.9727 |
| T0965 | 15.64 | 0.57 | 1 | 13.24 | 27.57 | 0.9851 |
| T0847 | 18.81 | 0.52 | 2 | 17.41 | 50.72 | 0.9901 |
| Mean | 12.18 | 0.64 | 27.1 | 10.74 | 26.54 | 0.95 |
| Optimal Scenario | |||||
|---|---|---|---|---|---|
| Targets | RMSD ( ) | TM-score ( ) | fnat (%, ) | I_RMSD ( ) | L_RMSD ( ) |
| 3RRLA_3RRLB | 0.93 | 0.98 | 98.2 | 0.902 | 2.441 |
| 2NU9A_2NU9B | 0.95 | 0.99 | 96.1 | 0.995 | 1.678 |
| 1EP3A_1EP3B | 0.84 | 0.99 | 99.3 | 1.044 | 1.541 |
| 2Y69B_2Y69C | 0.74 | 0.99 | 84.1 | 0.756 | 2.28 |
| 3RPFA_3RPFC | 0.93 | 0.97 | 50 | 0.864 | 2.475 |
| 1TYGB_1TYGA | 0.81 | 0.99 | 99.2 | 0.927 | 1.986 |
| 3MMLA_3MMLB | 0.96 | 0.99 | 94.8 | 0.932 | 2.063 |
| 2VPZA_2VPZB | 0.91 | 0.99 | 93.8 | 1.172 | 2.305 |
| 2Y69A_2Y69C | 0.86 | 0.99 | 82.6 | 0.916 | 2.123 |
| 1I1QA_1I1QB | 0.87 | 0.99 | 98.8 | 0.906 | 2.069 |
| 2Y69A_2Y69B | 0.75 | 0.99 | 86.3 | 0.842 | 1.96 |
| 1EFPA_1EFPB | 0.97 | 0.99 | 97.5 | 1.04 | 3.152 |
| 1W85A_1W85B | 0.77 | 0.99 | 99.3 | 0.76 | 2.263 |
| 1ZUNA_1ZUNB | 0.93 | 0.99 | 98.11 | 0.954 | 1.761 |
| 3PNLA_3PNLB | 0.87 | 0.99 | 99.4 | 0.782 | 2.077 |
| 3OAAH_3OAAG | 0.9 | 0.99 | 93.8 | 1.008 | 1.851 |
| 3G5OA_3G5OB | 0.86 | 0.97 | 90.2 | 0.839 | 1.685 |
| 2WDQC_2WDQD | 0.94 | 0.97 | 97.1 | 0.95 | 1.853 |
| 1BXRA_1BXRB | 0.96 | 0.99 | 97.6 | 1.14 | 3.119 |
| 1RM6A_1RM6B | 0.79 | 0.99 | 96.5 | 0.604 | 1.892 |
| 1QOPA_1QOPB | 0.78 | 0.99 | 97.2 | 0.761 | 1.625 |
| 1B70A_1B70B | 0.96 | 0.99 | 92.4 | 1.123 | 2.165 |
| 3A0RA_3A0RB | 0.8 | 0.99 | 98.1 | 0.699 | 2.017 |
| 2ONKA_2ONKC | 0.9 | 0.99 | 96.4 | 0.535 | 1.932 |
| 2D1PB_2D1PC | 0.92 | 0.97 | 83.7 | 0.935 | 2.325 |
| 4HR7A_4HR7B | 0.93 | 0.99 | 82.6 | 1.03 | 2.472 |
| 1RM6A_1RM6C | 0.95 | 0.99 | 74.5 | 1.323 | 2.434 |
| 3IP4B_3IP4C | 0.93 | 0.99 | 79.7 | 0.946 | 2.628 |
| 3IP4A_3IP4C | 0.97 | 0.99 | 74.3 | 1.158 | 2.77 |
| 1RM6B_1RM6C | 0.81 | 0.99 | 69.3 | 0.9 | 1.696 |
| Mean | 0.88 | 0.987 | 90.03 | 0.92 | 2.15 |
| Suboptimal Scenario | |||||
|---|---|---|---|---|---|
| Targets | RMSD ( ) | TM-score ( ) | fnat (%, ) | I_RMSD ( ) | L_RMSD ( ) |
| 1EFPA_1EFPB | 3.19 | 0.87 | 15 | 3.24 | 7.82 |
| 1EP3A_1EP3B | 8.08 | 0.67 | 11 | 6.45 | 17.9 |
| 1I1QA_1I1QB | 19.29 | 0.76 | 5 | 21.2 | 55.52 |
| 1QOPA_1QOPB | 20.38 | 0.62 | 5 | 23.72 | 51.28 |
| 1W85A_1W85B | 0.73 | 1 | 80 | 0.48 | 2.02 |
| 1ZUNA_1ZUNB | 15.48 | 0.65 | 8 | 16.54 | 30.22 |
| 2D1PB_2D1PC | 14.89 | 0.49 | 4 | 14.17 | 34.35 |
| 2NU9A_2NU9B | 2.63 | 0.89 | 48 | 2.23 | 5.17 |
| 2ONKA_2ONKC | 27.47 | 0.52 | 2 | 25.26 | 65.44 |
| 2VPZA_2VPZB | 34.39 | 0.84 | 2 | 32.21 | 92.48 |
| 2WDQC_2WDQD | 0.65 | 1 | 92 | 0.58 | 1.12 |
| 2Y69A_2Y69B | 26.1 | 0.68 | 8 | 27.41 | 65.18 |
| 2Y69A_2Y69C | 25.66 | 0.61 | 6 | 25.21 | 59.85 |
| 2Y69B_2Y69C | 20.94 | 0.53 | 10 | 16.56 | 65.58 |
| 3A0RA_3A0RB | 17.56 | 0.82 | 7 | 20.38 | 43.67 |
| 3G5OA_3G5OB | 8.85 | 0.66 | 4 | 9.41 | 13.83 |
| 3IP4A_3IP4B | 25.71 | 0.5 | 8 | 20.64 | 57.94 |
| 3IP4A_3IP4C | 12.22 | 0.87 | 7 | 14.91 | 31.5 |
| 3IP4B_3IP4C | 0.67 | 1 | 89 | 0.44 | 2.16 |
| 3MMLA_3MMLB | 2.64 | 0.9 | 27 | 2.36 | 5.62 |
| 3OAAH_3OAAG | 3.79 | 0.93 | 35 | 4.22 | 7.93 |
| 3PNLA_3PNLB | 6.95 | 0.7 | 6 | 6.29 | 17.11 |
| 3RPFA_3RPFC | 17.47 | 0.73 | 7 | 9.07 | 53.93 |
| 3RRLA_3RRLB | 12.91 | 0.62 | 5 | 12.63 | 25.17 |
| 4HR7A_4HR7B | 8.35 | 0.95 | 12 | 9.6 | 23.34 |
| 1B70A_1B70B | 16.77 | 0.82 | 2 | 20.58 | 34.72 |
| 1BXRA_1BXRB | 20.79 | 0.81 | 6 | 20.82 | 49.85 |
| 1RM6A_1RM6B | 26.13 | 0.74 | 6 | 25.87 | 59.09 |
| 1RM6A_1RM6C | 17.4 | 0.74 | 9 | 18.68 | 48.44 |
| 1RM6B_1RM6C | 13.13 | 0.65 | 4 | 12.86 | 29.88 |
| 1TYGB_1TYGA | 0.53 | 0.91 | 79 | 0.34 | 0.87 |
| Mean | 13.9274 | 0.7574 | 19.6451 | 13.689 | 34.1606 |
| Realistic Scenario | |||||||
|---|---|---|---|---|---|---|---|
| Targets | RMSD | TM-score | fnat | I_RMSD | L_RMSD | TM-score | TM-score |
| ( ) | ( ) | (%, ) | ( ) | ( ) | (Ligand) ( ) | (Receptor) ( ) | |
| 1EFPA_1EFPB | 2.83 | 0.89 | 25 | 3.21 | 6.08 | 0.98 | 0.96 |
| 1EP3A_1EP3B | 5.07 | 0.86 | 16 | 4.48 | 11.12 | 0.97 | 0.98 |
| 1I1QA_1I1QB | 20.79 | 0.67 | 5 | 21.52 | 62.06 | 0.97 | 0.97 |
| 1QOPA_1QOPB | 20.22 | 0.64 | 7 | 23.35 | 50.21 | 0.97 | 0.99 |
| 1W85A_1W85B | 4.64 | 0.82 | 11 | 3.33 | 5.88 | 0.99 | 0.99 |
| 1ZUNA_1ZUNB | 16.22 | 0.67 | 3 | 17.45 | 27.81 | 0.93 | 0.95 |
| 2D1PB_2D1PC | 10.61 | 0.61 | 0 | 10.77 | 28.47 | 0.99 | 0.99 |
| 2NU9A_2NU9B | 1.92 | 1 | 52 | 1.83 | 3.41 | 0.99 | 0.97 |
| 2VPZA_2VPZB | 32.16 | 0.81 | 1 | 30.17 | 89.68 | 0.98 | 0.94 |
| 2WDQC_2WDQD | 6.03 | 0.75 | 1 | 6.07 | 10.6 | 0.96 | 0.98 |
| 2Y69A_2Y69B | 24.2 | 0.77 | 9 | 23.51 | 58.93 | 0.99 | 0.98 |
| 2Y69A_2Y69C | 19.97 | 0.79 | 1 | 21.49 | 40.44 | 0.99 | 0.99 |
| 2Y69B_2Y69C | 18.91 | 0.56 | 3 | 7.11 | 58 | 0.98 | 0.99 |
| 3A0RA_3A0RB | 21.38 | 0.6 | 0 | 20.33 | 53.29 | 0.77 | 0.9 |
| 3G5OA_3G5OB | 14.11 | 0.54 | 3 | 14.14 | 26.31 | 0.9 | 0.96 |
| 3IP4A_3IP4B | 20.31 | 0.51 | 4 | 14.58 | 81.33 | 0.99 | 0.88 |
| 3IP4A_3IP4C | 11.57 | 0.82 | 1 | 14.83 | 29.61 | 0.99 | 0.92 |
| 3IP4B_3IP4C | 5.01 | 0.95 | 34 | 2.18 | 6.99 | 0.88 | 0.92 |
| 3MMLA_3MMLB | 3.83 | 0.81 | 40 | 3.2 | 9.24 | 0.99 | 0.97 |
| 3OAAH_3OAAG | 14.53 | 0.81 | 26 | 17.55 | 26.62 | 0.59 | 0.97 |
| 3PNLA_3PNLB | 7.07 | 0.69 | 1 | 6.59 | 18.67 | 0.98 | 0.99 |
| 3RPFA_3RPFC | 16.36 | 0.64 | 10 | 7.73 | 54.69 | 0.97 | 0.96 |
| 3RRLA_3RRLB | 7.66 | 0.73 | 9 | 8.03 | 12.29 | 0.99 | 0.93 |
| 4HR7A_4HR7B | 19.39 | 0.73 | 6 | 20.02 | 57.84 | 0.9 | 0.96 |
| 1B70A_1B70B | 17.59 | 0.83 | 2 | 21.32 | 36.1 | 0.97 | 0.95 |
| 1BXRA_1BXRB | 20.93 | 0.79 | 2 | 20.99 | 50.06 | 0.99 | 0.99 |
| 1RM6A_1RM6B | 26.29 | 0.6 | 4 | 25.94 | 59.11 | 0.99 | 0.99 |
| 1RM6A_1RM6C | 17.74 | 0.85 | 0 | 18.84 | 49.08 | 0.99 | 0.98 |
| 1RM6B_1RM6C | 13.9 | 0.63 | 5 | 12.95 | 29.93 | 0.99 | 0.98 |
| 1TYGB_1TYGA | 0.4 | 0.97 | 81 | 0.41 | 0.82 | 0.9 | 0.96 |
| 2ONKA_2ONKC | 28.65 | 0.5 | 4 | 25.68 | 66.83 | 0.97 | 0.93 |
| Mean | 14.525 | 0.7367 | 11.806 | 13.858 | 36.177 | 0.95 | 0.962 |