Supplementary Information for
Superconductivity induced by gate-driven hydrogen intercalation
in the charge-density-wave compound -TiSe2
Supplementary Note 1: X-ray photoelectron spectroscopy of the titanium diselenide crystals
We employed X-ray photoelectron spectroscopy (XPS) to confirm that the ionic liquid gating induced protonation did not result in the intercalation of undesired species in the TiSe2 lattice, such as the cations of the ionic liquid itself [1, 2]. XPS spectra were acquired with a PHI Model 5000 electron spectrometer equipped with an aluminum anode (1486 eV) monochromatic source, with a power of 25 W, at pressures below mbar. All crystals were cleaved immediately before loading them in the XPS load-lock, preliminarily degassed overnight at room temperature, and a surface cleaning step was performed by etching the first few atomic layers via sputtering with the built-in Ar-ion gun. The binding energies of the acquired spectra were corrected for specimen charging by referencing the C 1 line (acquired in dedicated survey scans before the Ar cleaning procedure) to 284.8 eV. Peak assignments were obtained using the MultiPak Software 9.7 for peak recognition.
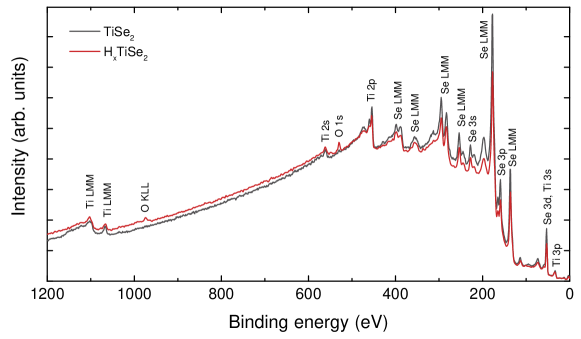
Supplementary Fig. 1 shows the full survey scans up to 1200 eV acquired on a pristine TiSe2 crystal (solid black line) and a H2TiSe2 crystal (solid red line) after the surface cleaning by Ar-ion sputtering, together with the corresponding peak assigments. Only peaks arising from Ti, Se, and O atomic species are observed in both scans. The Ti and Se signals obviously arise from the TiSe2 lattice, whereas the presence of an O signal indicates a small degree of oxidation even in the pristine crystal, which is nearly unavoidable when any TiSe2 surface is exposed to ambient air [3]. The intensity of the O signal is found to increase in the H2TiSe2 crystal: we ascribe this to an enhanced level of oxidation in the exposed TiSe2 surfaces triggered by the harsh electrochemical environment of the protonation cell, which cannot be fully removed by the Ar cleaning treatment across the whole area probed by the X-ray beam. Most importantly, no additional peaks ascribable to the atomic species building up the EMIM-BF4 ionic liquid molecular structure (C, N, B, or F) are detected in the H2TiSe2 crystal, thereby confirming a negligible incorporation (if any) of either the EMIM+ cation or the BF4- anion in the TiSe2 lattice structure, in full agreement with the minute unit cell expansion detected by X-ray diffraction as discussed in the Main Text.
Supplementary Note 2: Quantification of intercalated protons in the titanium diselenide crystals
We quantified the number of protons in the investigated collection of TiSe2Hx crystals, with overall mass mg and volume mm3, by means of 1H nuclear magnetic resonance (NMR). We prepared a resonant circuit using an in-series combination of a pF capacitor and of a seven-loop solenoidal coil which was deformed in order to mimic the flake-like shape of the crystals and to maximize the geometrical filling factor in turn. We also prepared a flake-like reference sample of hexamethylbenzene (C12H18), with similar mass mg and dimensions if compared to the TiSe2Hx crystals, aiming at a comparable geometrical filling factor of the solenoidal coil.
The proton quantification was performed at constant temperature ( K) and magnetic field T, corresponding to a Larmor frequency MHz for the 1H nuclear magnetic moments. The procedure relied on the two-pulse solid-echo sequence shown in Supplementary Fig. 2. The first radiofrequency (RF) pulse generates a free-induction decay signal which is refocused into a spin-echo signal by the second pulse. Both pulses have the same duration . The spin-echo is centred at a time after the first pulse, being the time separation between the two pulses. After the acquisition time , the idle time is such that , where is the spin-lattice relaxation time of the considered sample. This latter calibration guarantees that the system reaches conditions of thermodynamical equilibrium before the sequence is started over again and repeated until a satisfactory signal/noise ratio is reached.
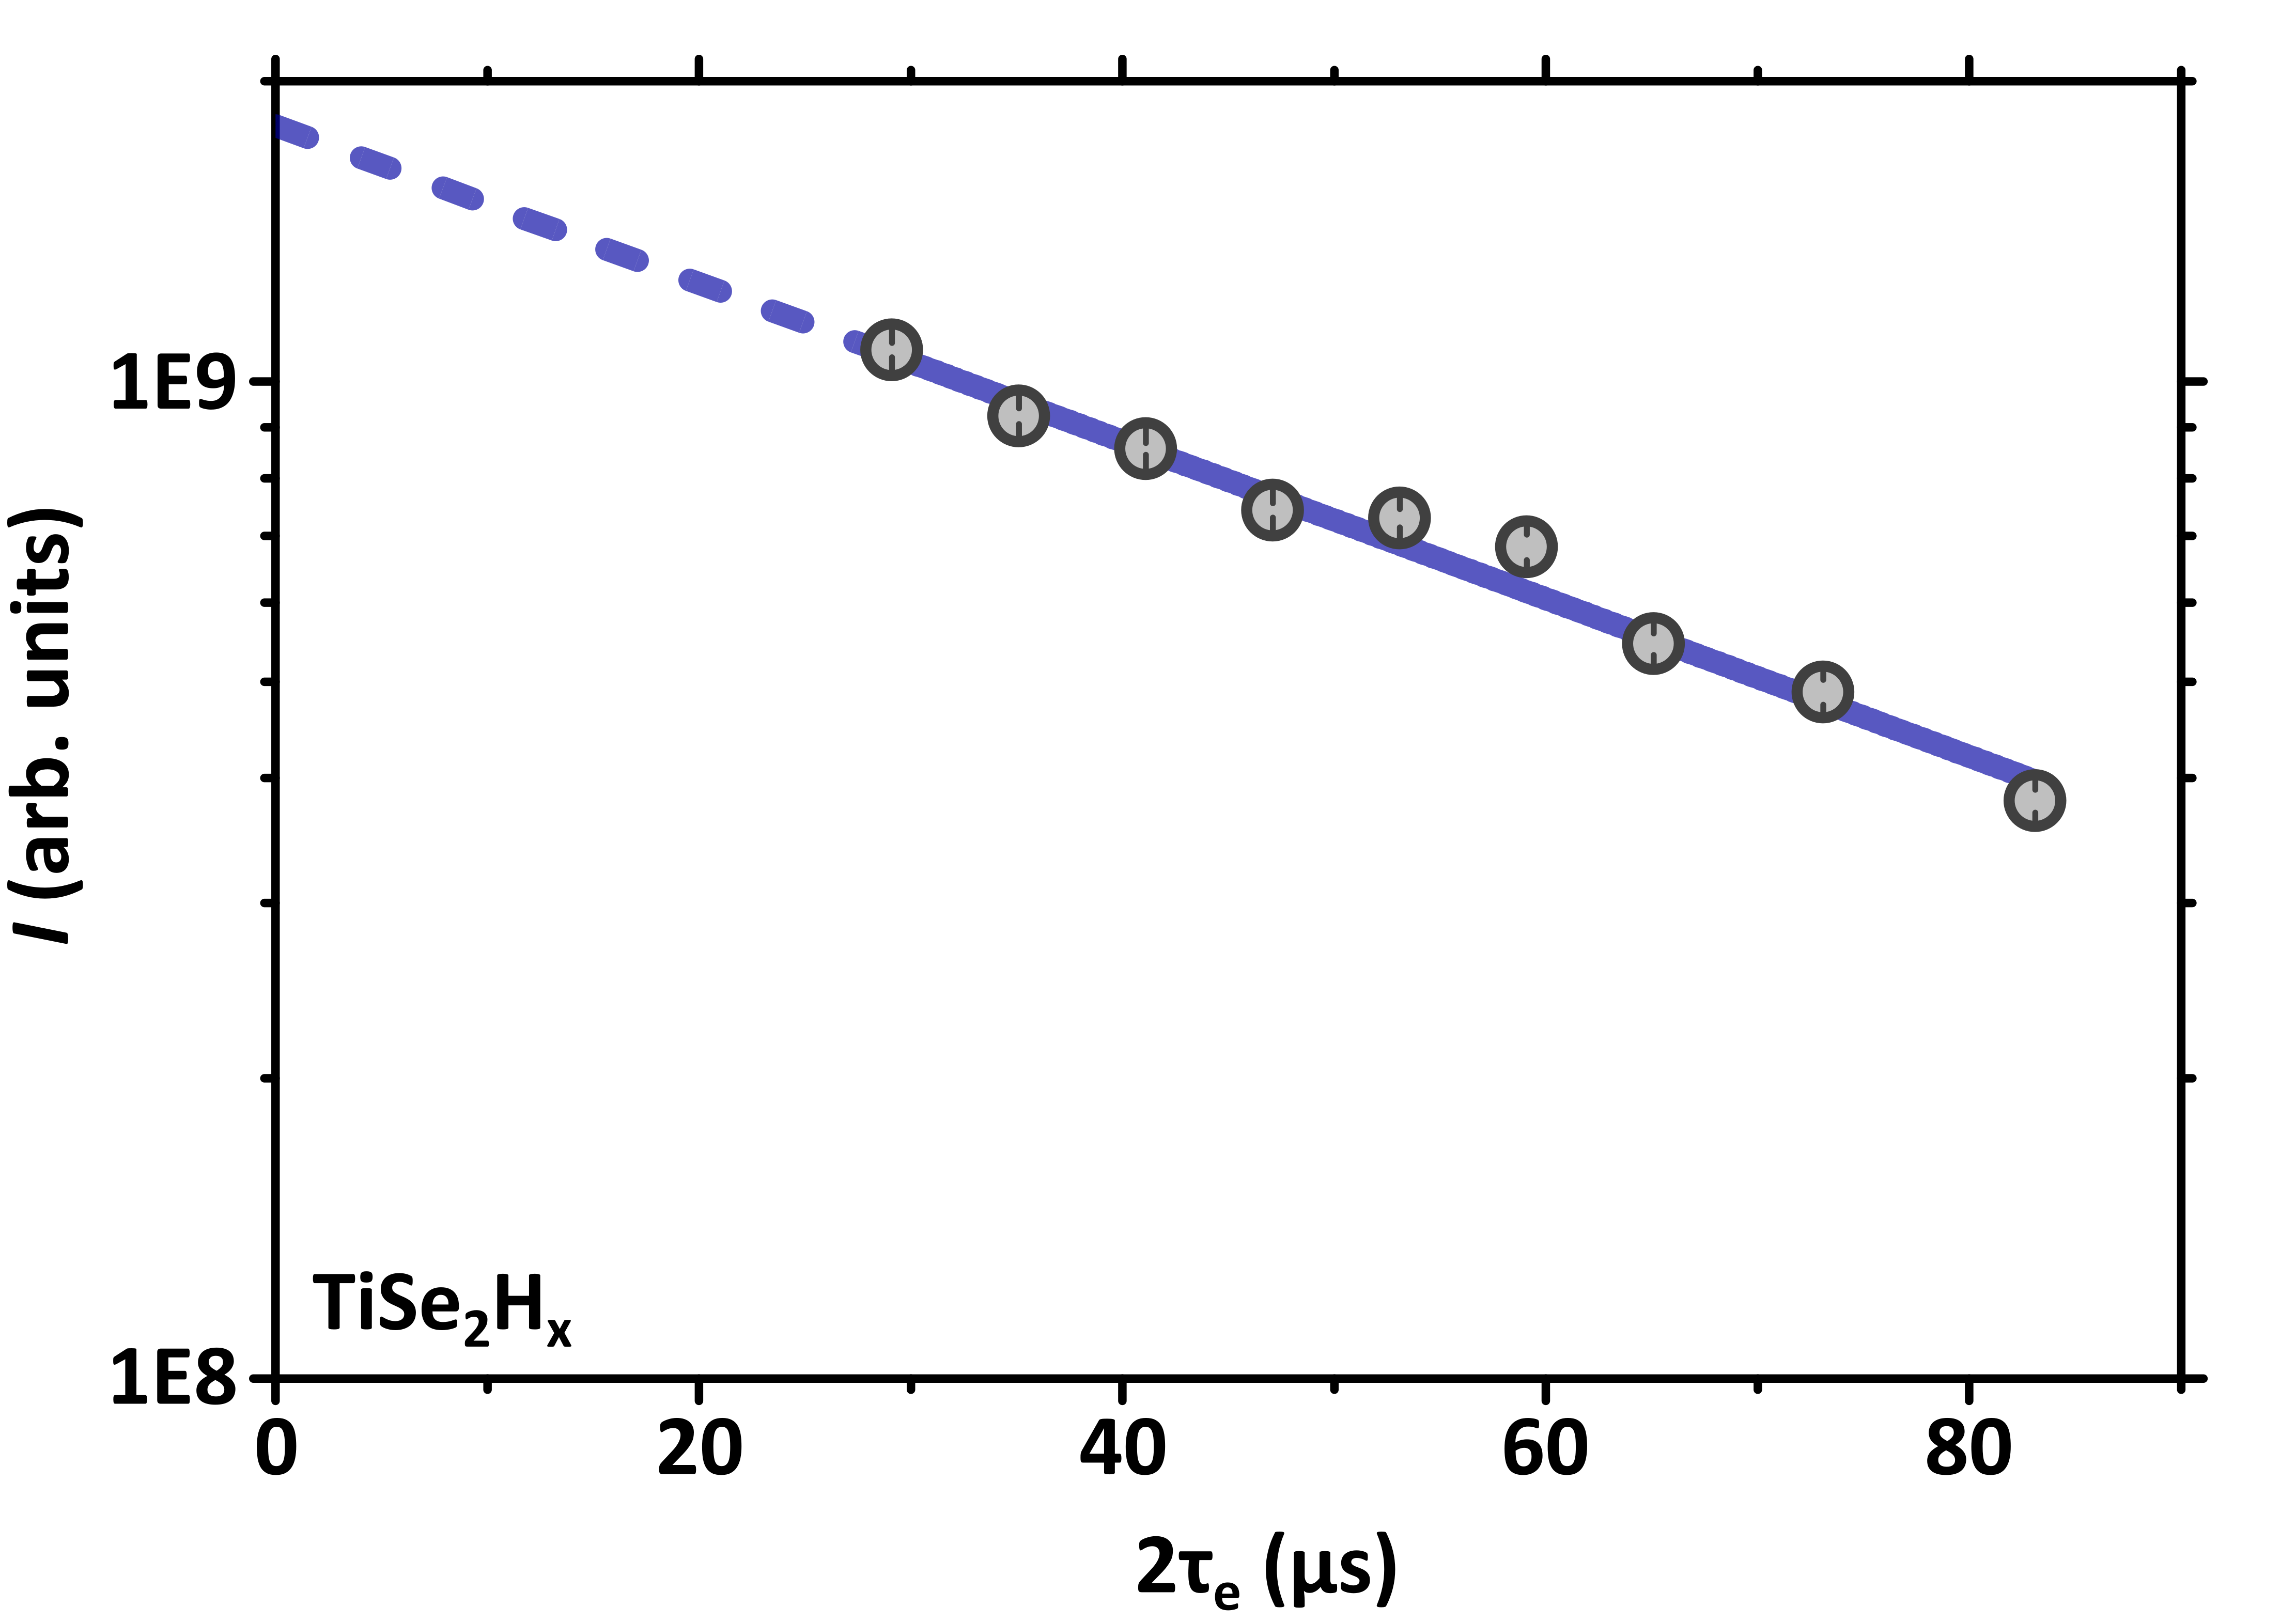
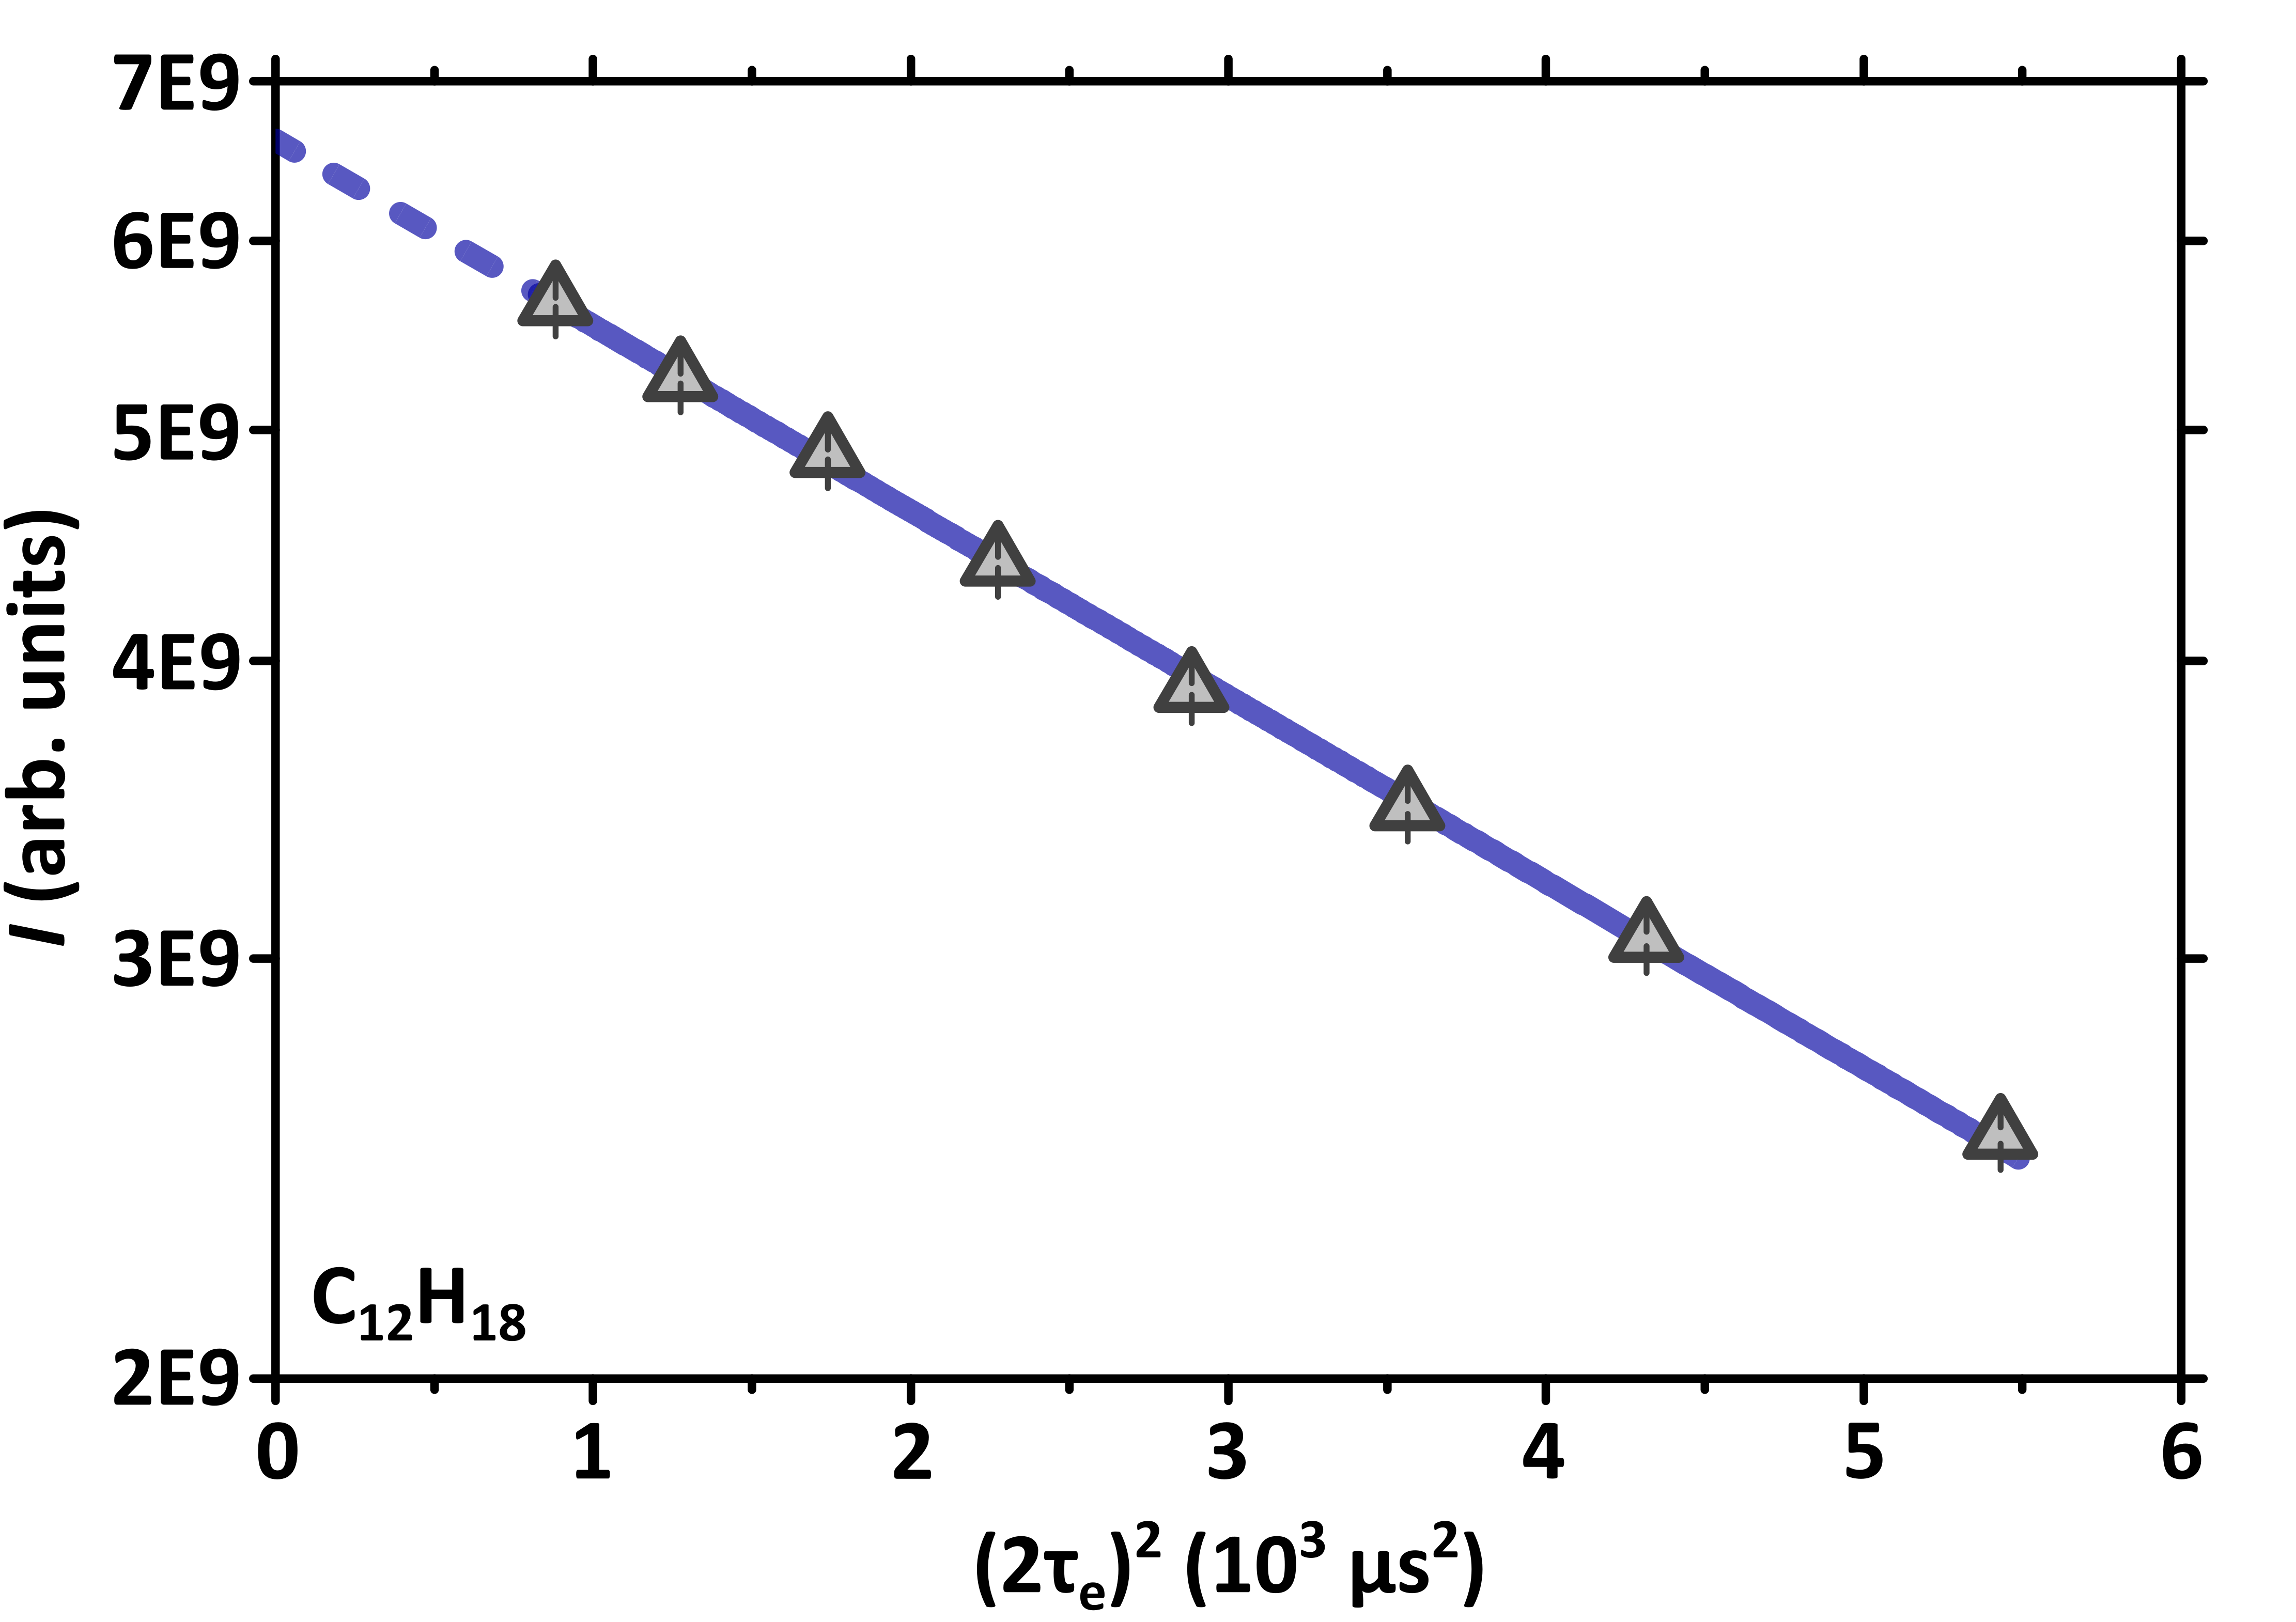
The acquisition window is adjusted so that only the second half of the spin-echo signal is detected (see Supplementary Fig. 2). The resulting signal undergoes fast Fourier transform and the transformed signal is numerically integrated, resulting in the value . The whole process is repeated for different values and, eventually, the value of is plotted as a function of . Representative curves for both TiSe2Hx and C12H18 are reported in the left-hand and right-hand panels of Supplementary Fig. 3, respectively. The experimental data are best-fitted based on exponential-decay (TiSe2Hx) and Gaussian-decay (C12H18) curves, making it possible to extrapolate the integrated signal amplitude back to the limit . This extrapolated value is independent on any signal suppression due to sample-specific processes and is directly related to the number of resonating 1H nuclear magnetic moments – as such, this is the relevant quantity for the proton quantification procedure. Incidentally, we stress that both the TiSe2Hx crystals and the reference C12H18 sample were wrapped in teflon tape and we ensured that both the empty coil and the teflon tape did contribute with negligible signal amplitude. We repeated the procedure described above for different RF pulse durations, aiming at the maximization of the extrapolated value at (achieved for a pulse, with duration ).
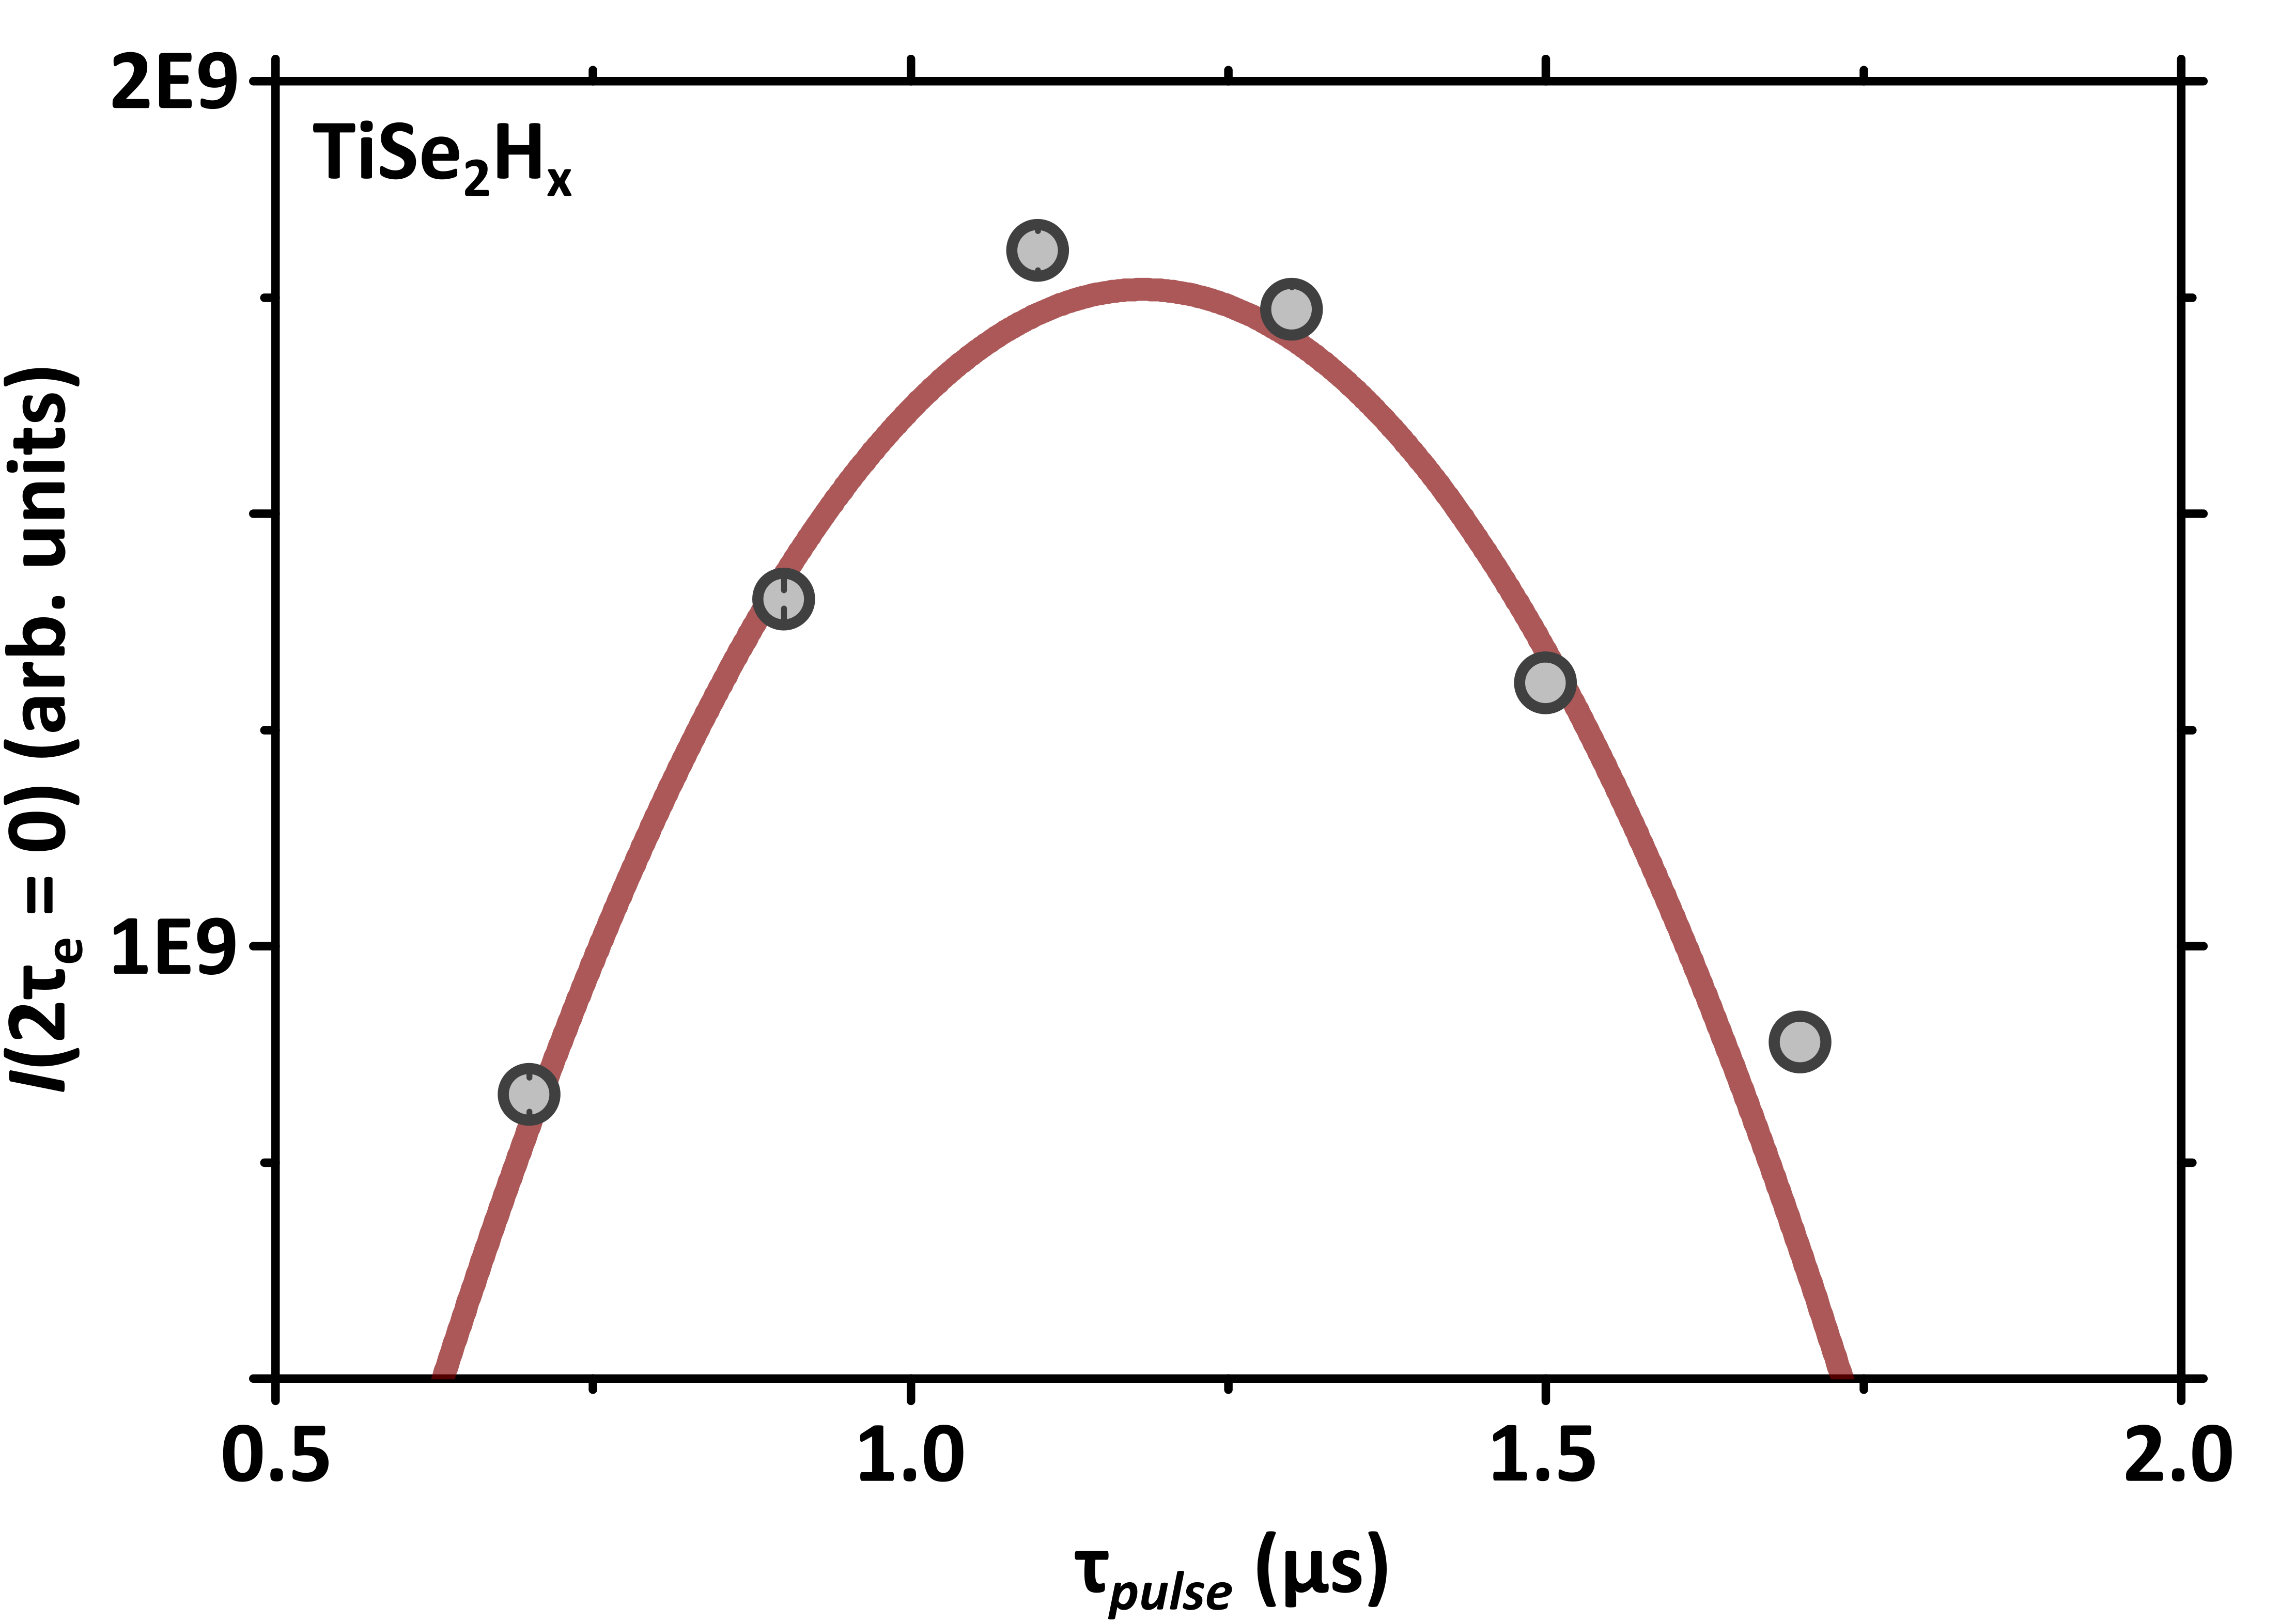
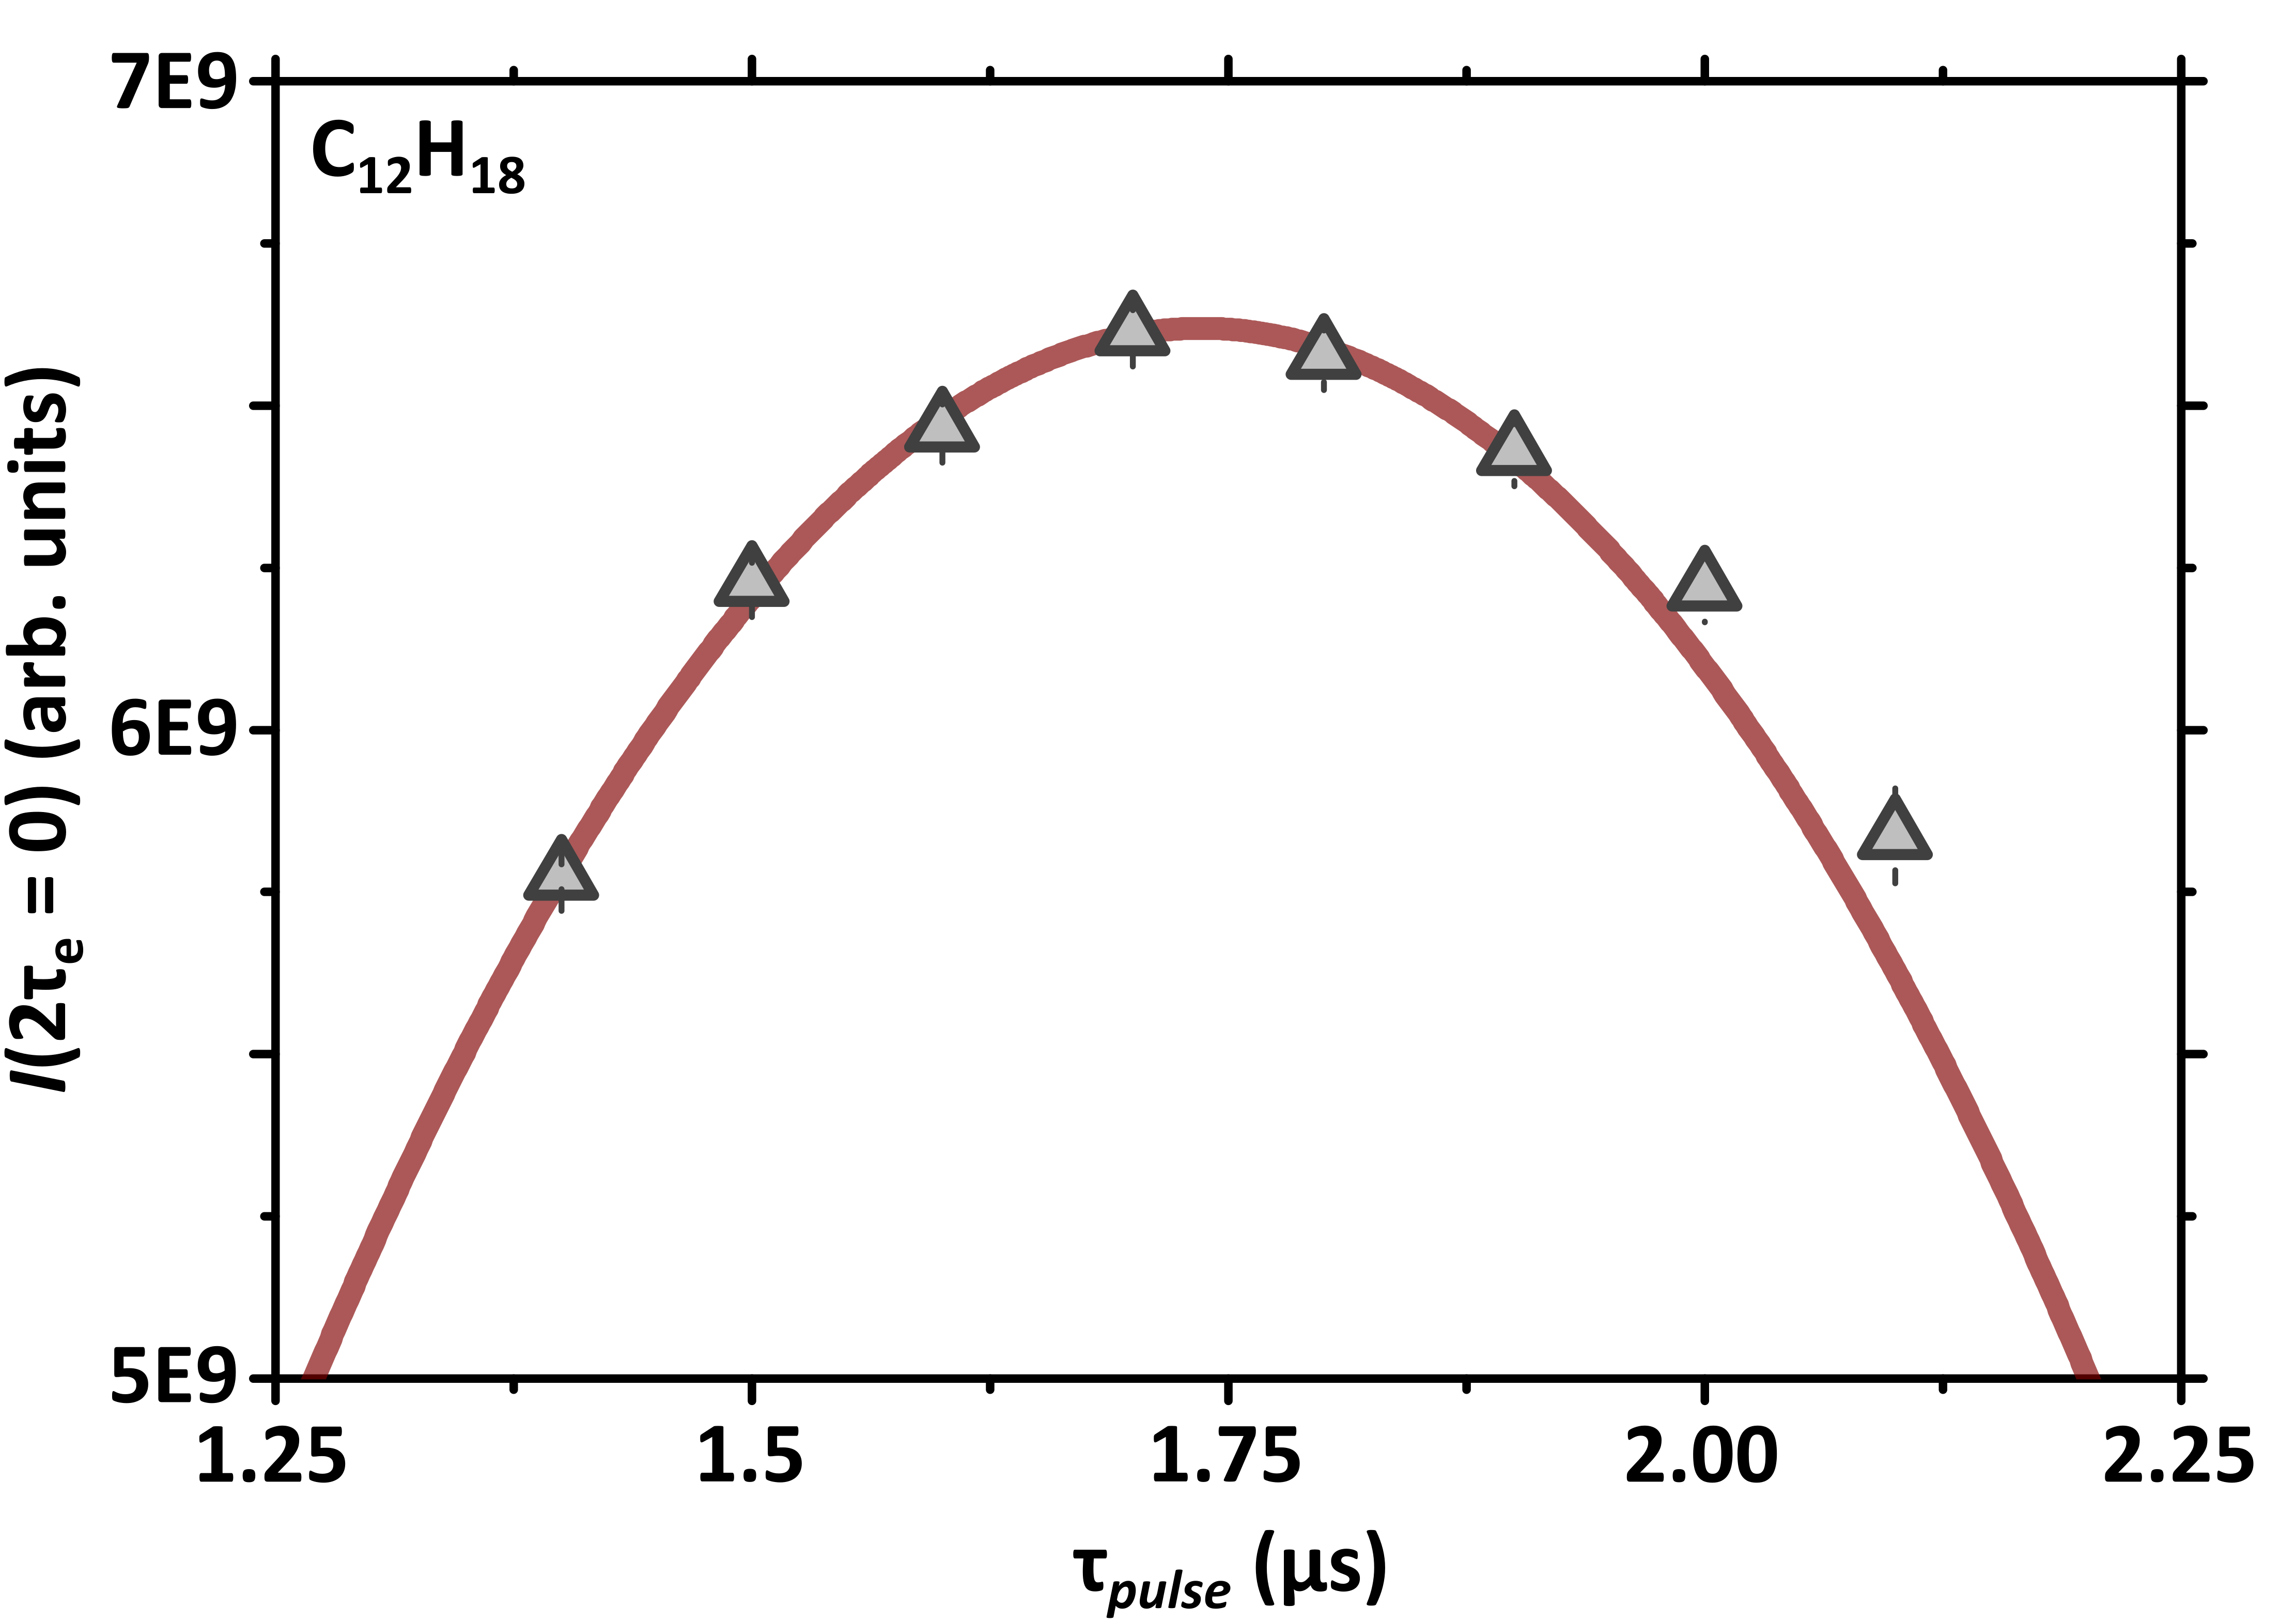
The results for TiSe2Hx and C12H18 are reported in the left-hand and right-hand panels of Supplementary Fig. 4, respectively. The ratio between the maximum values for TiSe2Hx and C12H18 should be equal to the ratio between the number of protons in the two samples. However, we notice that the maxima for the two samples correspond to two different calibrated pulse durations (s for TiSe2Hx and s for C12H18), suggesting different quality factors for the circuit when the different samples are inserted in the coil. In particular, a higher quality factor is associated to the circuit transferring power more effectively, i.e., with a shorter . At the same time, based on the reciprocity principle, a higher quality factor also corresponds to a higher coil sensitivity for the signal detection. Overall, neglecting the small discrepancies in the geometrical filling factor in the two measurements, we have that [4, 5]
| (1) |
In the equation above, we have defined as the maximum value (see Supplementary Fig. 4) normalized by the number of repetitions of the sequence. We can calculate based on the sample mass ( mg) and the associated molar mass ( g/mol) and, specifically, we have
| (2) |
with the Avogadro constant. Now, – i.e., the total number of resonating 1H nuclear magnetic moments inside the TiSe2Hx sample – is the only unknown quantity in Supplementary Eq. (1). Based on the experimental values extracted from Supplementary Fig. 4, we have a direct quantification of as
| (3) |
This is more easily expressed as x, i.e., the number of 1H nuclear magnetic moments per crystallographic cell of TiSe2Hx. The number of crystallographic cells in the TiSe2Hx crystals can be approximated based on the sample mass ( mg) and the molar mass of pristine TiSe2 ( g/mol) as
| (4) |
Overall, our final result is
| (5) |
Supplementary Note 3: Raman spectra of hydrogen-doped titanium diselenide
As mentioned in the Main Text, the inclusion of H dopants removes the symmetries of the systems making all modes Raman active. Although formally all modes are Raman active, it is not certain that their intensity is actually detectable. Since after the inclusion of H atoms the systems are metallic (at least the system with only one H), it is not possible to calculate the theoretical intensity of the peaks. It is however possible to analyse the phononic eigenvectors against the Raman-active ones in the pristine system searching for a possible relation in atomic displacements. From this analysis we can directly justify the appearance of the peaks at 156 and 260 cm-1 in the experimental Raman spectra of H2TiSe2 (Main Fig. 1g). Specifically, the presence of the two peaks can be accounted in part by the configuration involving a single H atom in the "bridge position" modifying the Se vibrational properties, and in part by configuration where two H atoms are included in the TiSe2 structure, one in the VdW gap and the other one in the TiSe2 trilayer (see also Supplementary Note 7).
Accounting for the broad band at 2900 cm-1 on the other hand is more complex. In general, molecular hydrogen shows a high-frequency stretching mode which falls around 4000 cm-1 and strongly depends on the structural environment in which H2 is hosted [6]. Our calculations indicate that the H2 vibrational frequency lies at 4100 cm-1 when the molecule is isolated; but when the H2 is intercalated in the TiSe2 matrix (i.e, the H2TiSe2 phase where the H2 molecule lies in the VdW gap with the H–H bond parallel to the TiSe2 plane) its vibrational frequency softens down to 3700 cm-1, due to the structural and metallic electronic environment. This result is in line with what observed for other systems containing molecular hydrogen, in which the interstitial H2 molecule shows a strongly renormalized frequency down to 3000 cm-1 [6, 7]. Based on this result, the very broad band roughly centered at 2900 cm-1 in the experimental spectrum can be naturally interpreted as originating from H2 molecules confined in the TiSe2 matrix, with renormalized phonon frequency. Considering that our estimation of the frequency shift was obtained for H2 in the most stable site found in TiSe2, disorder effects related to multiple-site intercalation, interaction with other molecules due to inhomogeneities, temperature effects and/or interactions with free atomic hydrogens will result in a broad feature statistically including different frequency shifts (depending on structural environment and electronic doping). Overall, the experimental observation of the additional low-frequency peaks and of the broad band at high frequencies in the Raman spectrum is therefore a further indication of the presence of disorder in the hydrogen concentration, phase and distribution in the intercalated TiSe2 samples.
Supplementary Note 4: Temperature-dependent transverse resistivity measurements
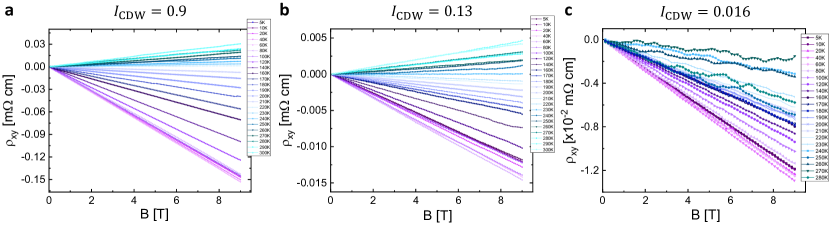
Magnetic field ()-dependent transverse resistivity () measurements were carried out at temperatures ranging between 5 K and 300 K on three representative TiSe2 crystals as discussed in the Main Text and in the Methods. Supplementary Fig. 5 reports the full sets of temperature-dependent antisymmetrized curves. The corresponding values of reported in the Main Text are obtained by linearly fitting the experimental data at a given temperature in the entire range. Additionally, all curves exhibit good linear behaviour up to 9 T. This indicates that, if HxTiSe2 is a multi-band superconductor as suggested by the observed upturn in the temperature-dependence of the critical magnetic field, its electronic structure does not support the ideal conditions for the observation of a non-linear Hall effect, namely a first band with high carrier density and low mobility and a second band with low density and high mobility [8]. This is consistent with existing data in undoped TiSe2 [9]. However, the limited range of magnetic fields accessible in our cryostat do not allow us to discern whether the possible multi-band superconductivity would be supported by two bands of comparable mobility and different density, or two bands of comparable density and different mobility, or a first band with high density and high mobility and a second band with low density and low mobility.
Supplementary Note 5: Additional temperature-dependent magnetotransport measurements in the superconducting phase of H2TiSe2
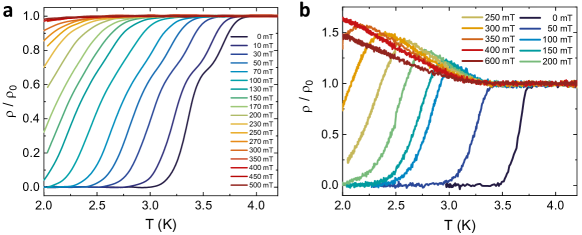
Supplementary Fig. 6 shows the temperature-dependent resistivity of two additional H2TiSe2 crystals across the superconducting transition, at different values of the magnetic field applied perpendicular to the planes. The resistivity is normalized to its value in the normal state immediately above the SC transition.
Supplementary Note 6: Sample preparation for muon spectroscopy measurements
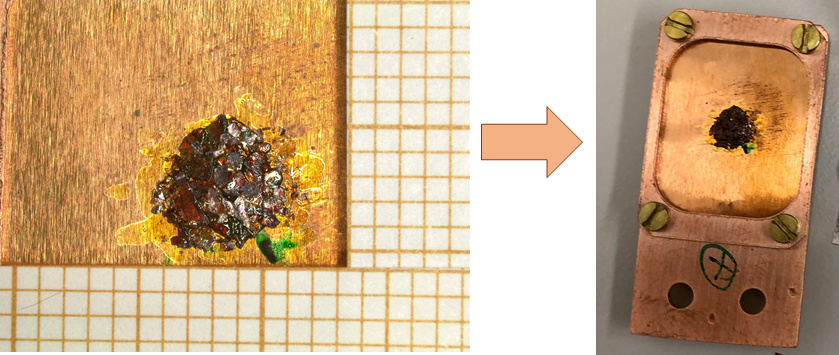
A set of H2TiSe2 single crystals belonging to the same batch was glued using cryogenic heat-sinking varnish (GE 7031) on a thin (25-m) Cu foil, so as to realize a mosaic (surface exposed to the muon beam mm2 – see Supplementary Fig. 7). The resulting sample consisted of crystals with aligned axes, but with random orientation of the in-plane and axes. A few layers of crystals were necessary in order to achieve a minimum thickness of about 0.2 mm. Such average sample thickness and the presence of a 100-m-thick high-purity silver degrader on the sample surface ensure that muons are implanted in the sample (and do not pass through it).
Supplementary Note 7: Zero-field muon spin rotation measurements
Supplementary Fig. 8 shows a selected set of zero-field muon-spin relaxation (ZF-SR) measurements whose aim was twofold: to detect a possible time-reversal symmetry breaking (TRSB), usually associated with unconventional pairing, and to evaluate the amount of hydrogen atoms effectively intercalated in the layered TiSe2 structure. As to the former, by measuring the time-dependent polarization in a strictly zero field (the background magnetic fields being actively compensated) one can detect the tiny magnetic fields associated with the electrons paired in a spin-triplet state. The TRSB has been observed in Sr2RuO4 [10] and related compounds [11], as well as in some topological superconductors, such as Sr0.1Bi2Se3 [12]. In Supplementary Fig. 8c, we show the time-dependent ZF-SR polarization above and below the superconducting transition. Clearly, the two datasets fully overlap, thus excluding a possible increase of depolarization rate in the superconducting state due to spontaneous magnetic fields and ruling out any TRSB.
All the ZF-SR datasets were fitted by means of the model below:
| (6) |
Here, the long-time relaxing tail is due to the muons implanted in the silver degrader. Both and were fixed to the values determined by TF-SR measurements. Under some broad assumptions, the second term can be referred to the sample: is the static Gaussian Kubo-Toyabe function reflecting the contribution of randomly-oriented nuclear magnetic moments.
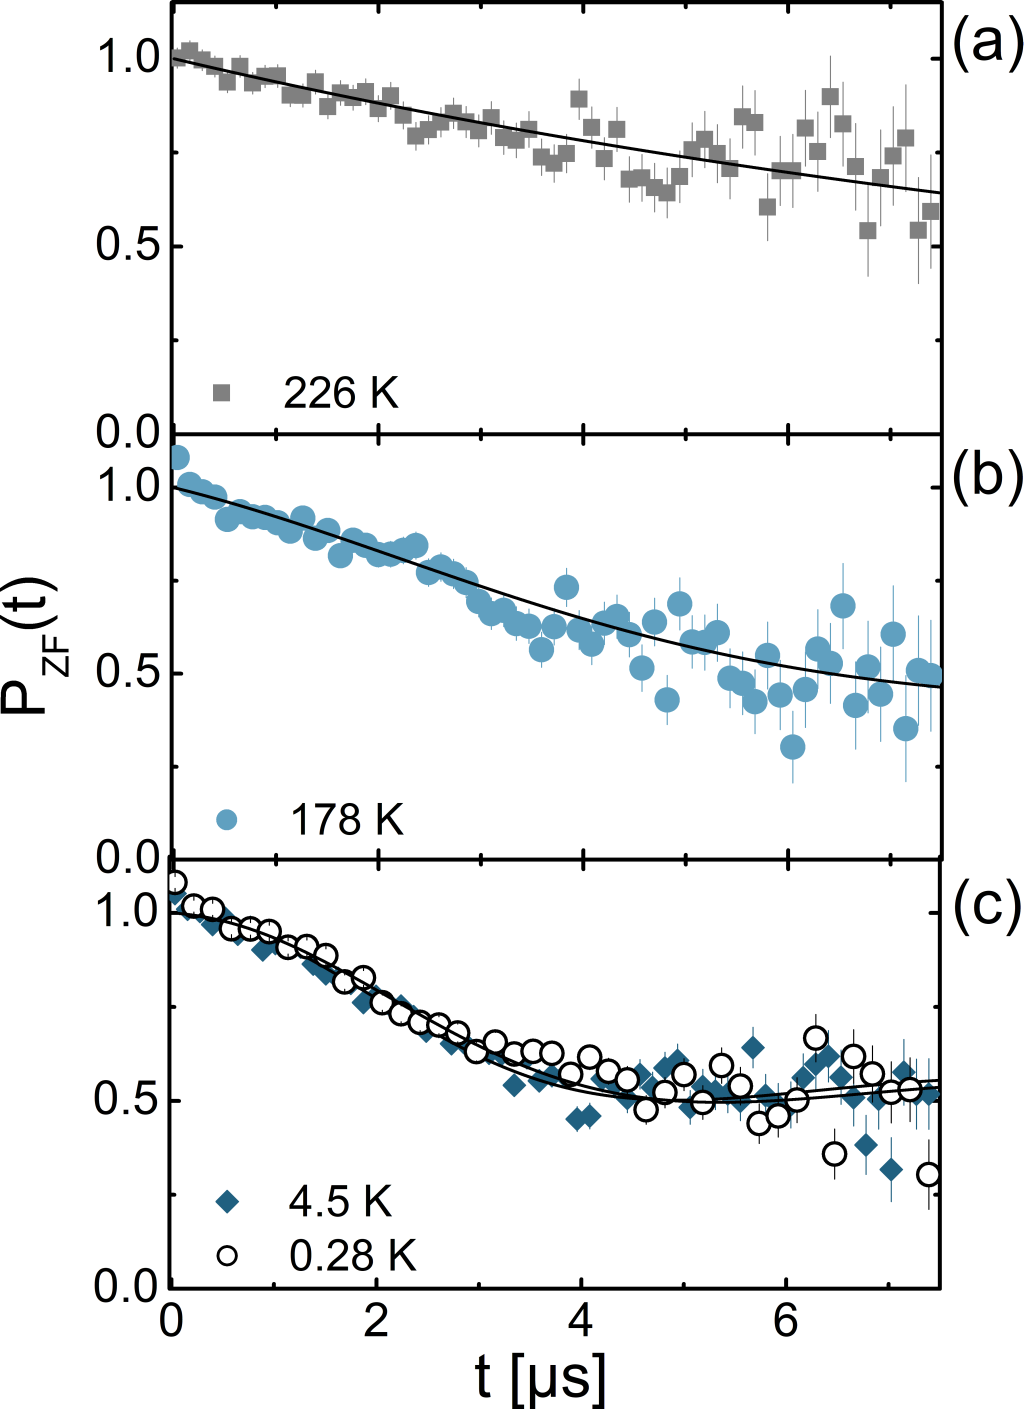
Such term is multiplied by a simple exponential decay which accounts for possible dynamic processes, such as muon- and/or hydrogen hopping (expected to occur at high temperatures [13, 14]), with being the hopping rate.
Supplementary Fig. 9 presents the temperature evolution of the ZF-SR depolarization and the hopping rates, as resulting from fitting the data to Supplementary Eq. (6). First, we observe that our results agree closely (at least qualitatively) with those of ZrV2Hx, a Laves-phase material [15], where one can distinguish two
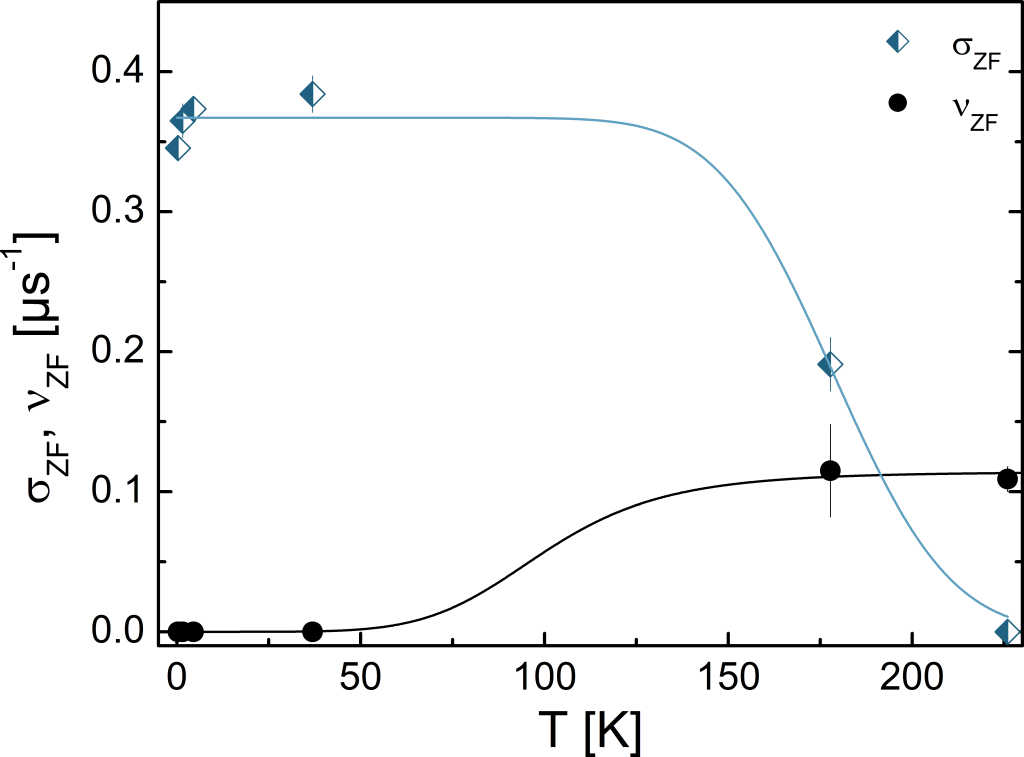
different regimes. At low temperatures (below 50 K), muons are static and show a relatively large depolarization rate, s-1. For K, decreases progressively because motional narrowing sets in. The latter is fully effective for K, where both a sharp decrease of and a corresponding increase of take place. As observed already in ZrV2Hx, also in our case, muon motions seem to be highly correlated with those of the intercalated hydrogen atoms: most of the interstitial sites available for muon hopping being occupied by the hydrogen. When, at high temperatures, hydrogen too starts to diffuse, “new” interstitial sites become available for the muon diffusion, thus explaining the sharp decrease in depolarization rate observed for K. Experimental data on ZrV2Hx suggest also that, in such system, muon hopping is slower than hydrogen hopping [16, 15], a counter-intuitive result considering the ninefold lower mass of muon compared to that of proton. To date, there are no clear explanations for this apparently contradictory result.
Interestingly, it was also shown that, at low temperatures, the value increases with increasing H content [16], reaching 0.37 s-1 for . Since this decay rate agrees with that observed in our case, it suggests a high degree of H intercalation also in TiSe2, thereby confirming – at least qualitatively – the results of proton-content quantification by 1H-NMR measurements discussed above.
Supplementary Note 8: Additional details on the density functional theory calculations
.1 Electronic properties as a function of increasing hydrogen doping
The random-search algorithm analysis highlighted the existence of several different metastable intercalation sites, indicating that hydrogen can easily be “trapped" (at ) in different local minima. The lowest-energy phase discovered features the H-atom located in the van der Waals gap, at the “bridge" position between two Se-atoms belonging to different planes. Interestingly, a metastable phase where the H atom is located inside the TiSe2 trilayer is found very close in energy to the lowest-energy one ( eV). The band structure of 1-H0.125TiSe2, unfolded in the () Brillouin Zone (Supplementary Fig. 10a) strongly resembles that of ideal TiSe2, but with the Fermi level now shifted in the conduction band populating the electron valley at the -point of the Brillouin zone, with an estimated electron doping is of about 0.1 with respect to the pristine 1-TiSe2. Thus at low-doping regime, H acts as an electron-donor, without appreciable changes of the band structure.
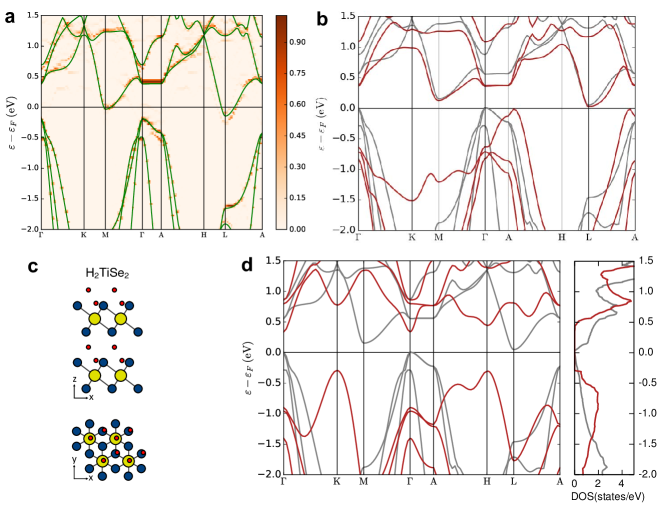
Following the experimental indications for large H doping, the hydrogen concentration was then increased to and . At , the obtained intercalation sites are in line with the dilute case, but the band structure becomes strongly modified (as shown in Fig. 5b of the Main Text). At this higher doping level hydrogen still acts as an electron donor, but it now induces a strong band reconstruction lowering the Ti- which becomes half-filled. A nominal doping of (i.e. considering two inequivalent H atoms per unit cell, in line with the H content determined in fully-doped TiSe2 crystals via NMR) results in the formation of the H2 molecule (laying in the VdW gap with the H–H bond parallel to the TiSe2 plane) and with a negligible effect on the band structure of the pristine TiSe2 (see Supplementary Fig. 10b). However, the random search provides other (metastable) phases where H atoms remain in the atomic form and are bonded to the Se or Ti atoms, thus avoiding the formation of the molecule. The electronic structure of one of these metastable phases, in which one H atom is intercalated in the vdW gap and the other within the trilayer (Supplementary Fig. 10c), shows a transition to an insulating phase as the Ti- becomes completely filled (Supplementary Fig. 10d).
.2 Dynamical stabilization of the metallic H1TiSe2 phase via the application of external pressure
As discussed in the Main Text, all the single-phase structural models discussed above necessarily turn out to be dynamically unstable, as verified by the calculation of their phonon dispersion relations (not shown). This instability, which is likely resolved in the actual samples thanks either to the formation of H superstructures coupled with TiSe2 CDW distortions, or to the strong H disorder, makes a calculation of their dynamical properties from first principles computationally unfeasible.
Nevertheless, we conceived a computational experiment which allows us to have solid first-principles predictions of the superconducting phase even in the high density regime. It consists in artificially stabilizing the metallic -H1TiSe2 phase (in which the Ti- band is partially filled) by slightly compressing the unit cell, so as to stiffen the short-range force constants and lift the phononic instabilities, without significantly changing the electronic properties of the material. This approach, already exploited to remove the CDW distortion in pure -TiSe2 [17] and reduce anharmonic effects in H-doped palladium alloys [18], can here be used to obtain a dynamically stable high-doping phase.
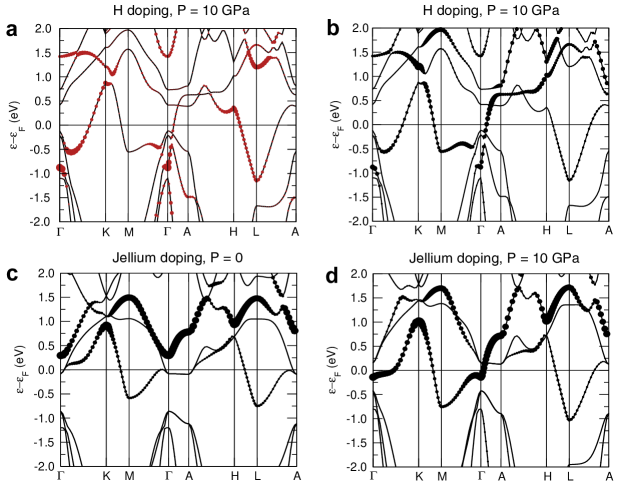
Supplementary Fig. 11a-b show the electronic band structure of the -H1TiSe2 phase (solid black lines) once the lattice constants are reduced by 4% (that corresponds to an external pressure of GPa). Despite a slight reduction in the bandwidths, the pressurized band structure closely resembles that computed at 0 GPa and shown in Fig. 5b of the Main Text, confirming that at this applied external pressure, the main features of the electronic properties of -H1TiSe2 are not strongly affected. Conversely, this same pressure is sufficient to make the system dynamically stable and bring it far from the critical region of the instability, as demonstrated by the phonon dispersion shown in Fig.5 d of the Main Text. This confirms that this phase retains the important topology of the band structure of the doped phase, within a dynamically-stable phase. In particular, the electronic band structure shows a significant hybridization (depicted as red circles in Supplementary Fig. 11a) between the TiSe2 bands and the H-derived orbitals. The largest percentage of the H component (%) is found at the point and at an energy of eV, but is still sizeable (%) around the Fermi level.
.3 Comparison between the electronic structures of hydrogen-doped TiSe2 and jellium-doped TiSe2
The role played by the H dopants in determining the SC phase of -TiSe2 can be further clarified by comparing the electronic properties of -H1TiSe2 with those of a -TiSe2 where one electron per unit cell is added to the system together with a uniform compensating background (jellium model, see Methods), for both the experimental structure (0 GPa) and the pressurized structure (10 GPa). Supplementary Fig. 11c shows the electronic band structure at 0 GPa of jellium-doped model, to be compared with that of H1TiSe2 shown in Fig. 5c of the Main Text. In both figures the size of the circles indicates the character of the bands. The comparison with the band structure of the TiSe2 (grey lines in Fig. 5b of the Main Text) immediately highlights the differences between the effects of actual H-insertion and pure H-driven charge doping. In particular, in the jellium model (Supplementary Fig. 11c) the doping is nearly rigid and the states at the Fermi level have a predominant in-plane character, while the band remains unoccupied. Instead, as discussed in the Main Text, the H insertion also leads to a significant deformation of the electronic dispersion and completely switches the orbital character of the bands which cross the Fermi level to states with a predominant out-of-plane character.
Upon the application of external pressure, the orbital character of the states at the Fermi level remains unaffected in the H-doped system (Supplementary Fig. 11b), thus indicating once again that the lattice compression necessary to stabilize the -H1TiSe2 does not give rise to any relevant change in the electronic and SC properties of the system. In the jellium-doped system, instead, pressure triggers a band inversion that leads, once again, to a partial filling of the highly-coupled band (Supplementary Fig. 11d) but, crucially, the system remains dynamically unstable. This indicates that the effect of a high concentration of H dopants in the TiSe2 structure cannot simply be conceptualized as a combination of charge doping and chemical pressure.
.4 Dynamical and superconducting properties of jellium-doped TiSe2
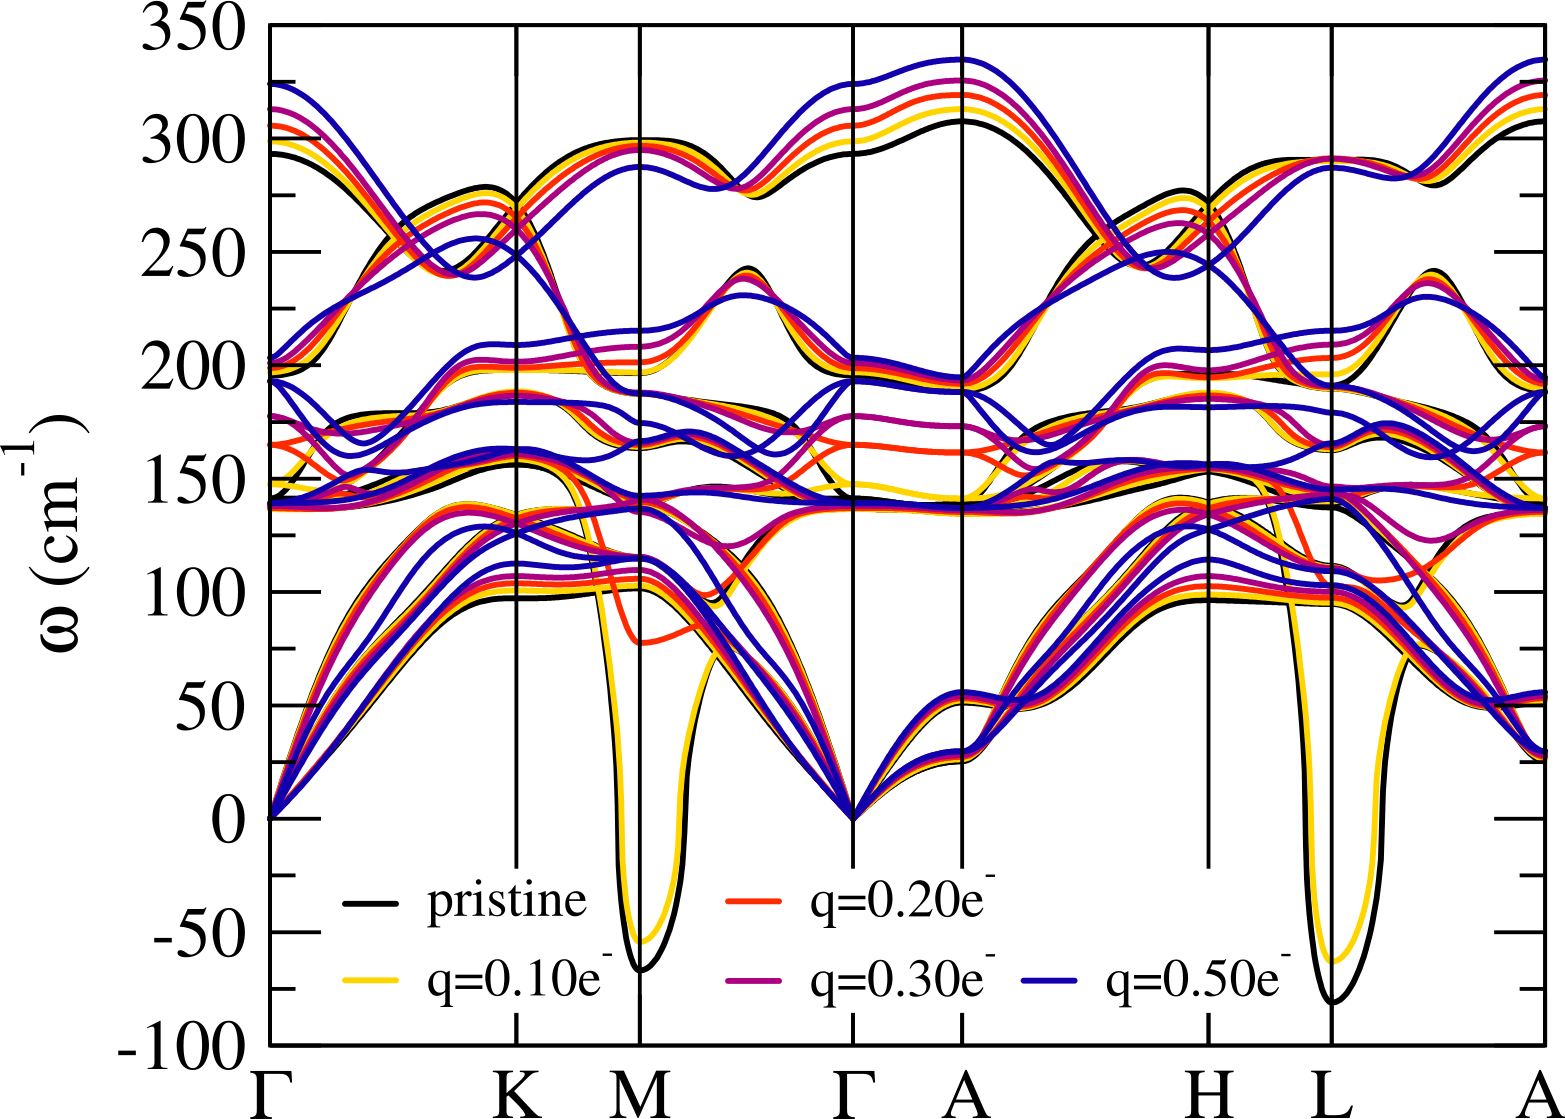
We verified that 1-TiSe2 doped in the jellium approximation can also support superconductivity. Supplementary Fig. 12 shows the phononic band structure of jellium-doped -TiSe2 as a function of electron doping, which evidences how, as known for the 1-TiSe2 single layer [19, 20], electron doping is responsible for the dynamical stabilization of the system. In turn, the strong phonon softening associated with the disappearing phononic instability is responsible for the large electron-phonon coupling able to support a sizable . Specifically, when a charge doping of per unit cell is added to the -TiSe2 system, the first conduction band becomes populated and an electron-phonon coupling of is obtained, corresponding to a K. However, we stress again that – unlike in the real H-doped system – in this simplified “toy" model high levels of electron doping ( per unit cell) make the compressed TiSe2 structure dynamically unstable. Furthermore, the large H concentration levels estimated even in the least-doped samples (average at the shortest gating time of min) indicate that the jellium approximation does not correctly describe the superconducting properties of our HxTiSe2 crystals at any gating time, and would be more suited to describe superconducting Cu- and Li-doped TiSe2. This lack of applicability is particularly relevant in the likely case that, in samples at reduced H loading, the inhomogeneity in the H concentration leads to samples characterized by a percolating filamentary network of highly-doped regions embedded in a nearly undoped matrix.
Supplementary References
- [1] Wang, J. et al. Superconductivity at 44.4 K achieved by intercalating EMIM+ into FeSe. Chin. Phys. B 30, 107402 (2021).
- [2] Piatti, E., Montagna Bozzone, J. & Daghero, D. Anomalous metallic phase in molybdenum disulphide induced via gate-driven organic ion intercalation. Nanomaterials 12, 1842 (2022).
- [3] Sun, L. et al. Suppression of the Charge Density Wave state in two-dimensional 1-TiSe2 by atmospheric oxidation. Angew. Chem. Int. Ed. 56, 8981–8985 (2017).
- [4] Hoult, D. I. & Richards, R. E. The signal-to-noise ratio of the nuclear magnetic resonance experiment. J. Magn. Reson. 24, 71 (1976).
- [5] Mo, H. et al. : a quantitative measure of NMR signal receiving efficiency. J. Magn. Reson. 200, 239 (2009).
- [6] Futera, Z. et al. Vibrational modes of hydrogen hydrates: A first-principles molecular dynamics and Raman spectra study. J. Phys. Chem. C 121, 3690–3696 (2017).
- [7] Okamoto, Y., Saito, M. & Oshiyama, A. Comparative study of vibrational frequencies of H2 molecules in Si and GaAs. Phys. Rev. B 56, R10016 (1997).
- [8] Ding, D. et al. Multivalley superconductivity in monolayer transition metal dichalcogenides. Nano Lett. 22, 7919–7926 (2022).
- [9] Knowles, P. et al. Fermi surface reconstruction and electron dynamics at the charge-density-wave transition in TiSe2. Phys. Rev. Lett. 124, 167602 (2020).
- [10] Luke, G. M. et al. Time-reversal symmetry-breaking superconductivity in Sr2RuO4. Nature 394, 558 (1998).
- [11] Shiroka, T. et al. SR studies of superconductivity in eutectically grown mixed ruthenates. Phys. Rev. B 85, 134527 (2012).
- [12] Neha, P., Biswas, P. K., Das, T. & Patnaik, S. Time-reversal symmetry breaking in topological superconductor Sr0.1Bi2Se3. Phys. Rev. Mater. 3, 074201 (2019).
- [13] Hayano, R. S. et al. Zero- and low-field spin relaxation studied by positive muons. Phys. Rev. B 20, 850–859 (1979).
- [14] Yaouanc, A. & Dalmas de Réotier, P. Muon Spin Rotation, Relaxation, and Resonance: Applications to Condensed Matter (Oxford University Press, Oxford, 2011).
- [15] Soetratmo, M., Hempelmann, R., Hartmann, O., Wäppling, R. & Ekström, M. Muon spin relaxation in hydrogen-loaded ZrV2. J. Phys.: Condens. Matter 9, 1671–1677 (1997).
- [16] Hempelmann, R., Richter, D., Hartmann, O., Karlsson, E. & Wäppling, R. The positive muon in the intermetallic hydride ZrV2Hx: A muon tracer study supplemented by differential thermoanalysis, neutron vibrational spectroscopy, and quasielastic neutron scattering. J. Chem. Phys. 90, 1935–1949 (1989).
- [17] Calandra, M. & Mauri, F. Charge-density wave and superconducting dome in from electron-phonon interaction. Phys. Rev. Lett. 106, 196406 (2011).
- [18] Vocaturo, R., Tresca, C., Ghiringhelli, G. & Profeta, G. Prediction of ambient-pressure superconductivity in ternary hydride PdCuHx. J. Appl. Phys. 131, 033903 (2022).
- [19] Wei, M. J. et al. Manipulating charge density wave order in monolayer by strain and charge doping: A first-principles investigation. Phys. Rev. B 96, 165404 (2017).
- [20] Zhou, J. S. et al. Anharmonicity and doping melt the charge density wave in single-layer TiSe2. Nano Lett. 20, 4809–4815 (2020).