Pneumococcus and the stress-gradient hypothesis: a trade-off links and susceptibility to co-colonization across countries
Abstract
Modern molecular technologies have revolutionized our understanding of bacterial epidemiology, but reported data across different settings remain under-integrated in common theoretical frameworks. Pneumococcus serotype co-colonization, caused by the polymorphic bacteria Streptococcus pneumoniae, has been increasingly investigated in recent years. While the global genomic diversity and serotype distribution of S. pneumoniae are well-characterized, there is limited information on how co-colonization patterns vary globally, critical for understanding bacterial evolution and dynamics. Gathering a rich dataset of cross-sectional pneumococcal colonization studies in the literature, we quantified patterns of transmission intensity and co-colonization prevalence in children populations across 17 geographic locations. Fitting these data to an SIS model with co-colonization under the assumption of similarity among interacting strains, our analysis reveals strong patterns of negative co-variation between transmission intensity () and susceptibility to co-colonization (). In support of the stress-gradient hypothesis in ecology (SGH), pneumococcus serotypes appear to compete more in high-transmission settings and less in low-transmission settings, a trade-off which ultimately leads to a conserved ratio of single to co-colonization . Within our mathematical model, such conservation suggests preservation of ’stability-diversity-complexity’ regimes in multi-strain coexistence. We find no major study differences in serotype composition, pointing to underlying adaptation of the same set of serotypes across environments. Our work highlights that understanding pneumococcus transmission patterns from global epidemiological data can benefit from simple analytical approaches that account for quasi-neutrality among strains, co-colonization, as well as variable environmental adaptation.
I. Introduction
One of the most intriguing hypotheses in ecology is the stress-gradient hypothesis (SGH), which predicts that positive interactions in multispecies communities should be more prevalent in stressful environments, while more benign environments should favour competition [1, 2, 3]. This hypothesis has been empirically tested, refined and supported mainly by studies of plant systems [4, 5, 6, 7, 8], and only more recently in microbial communities [9, 10, 11, 12, 13]. For example, [13] studied 4 bacterial species that could degrade toxic industrial fluids and showed that positive interactions in the system were most common at high levels of abiotic stress and intermediate nutrient concentrations where most species could not grow, whereas making the environment more habitable promoted competition.
In general, how environmental variability (both temporal or spatial) affects species diversity is a highly debated topic in ecology. It has been argued that intermediate disturbance intensity and frequency of disturbances maximize species diversity [14, 15]. Changes may come externally (e.g., abiotic resource supplies) or be caused by the organisms themselves, e.g. via resource consumption. Modern coexistence theory argues that such environmental factors mediate the sign and/or magnitude of interspecific interactions [16, 11, 13], and ultimately whether species tend to cooperate or compete in a system can critically drive community diversity and stability [17, 18].
Infectious disease epidemiology offers another context where the stress gradient hypothesis can be studied in relation to biodiversity. Infectious diseases often involve multiple pathogen species or multiple strains of the same pathogen [19, 20]. For infectious agents, interactions between pathogens or pathogen strains can take many forms: for example, infection by one strain can alter susceptibility to subsequent infection by others, or simultaneous presence of multiple strains can affect the duration, infectiousness, as well as severity of infection [21, 22, 23]. While pathogen interactions are recognized to have far-reaching clinical, epidemiological, and eco-evolutionary implications, investigations of the stress-gradient hypothesis in polymorphic epidemiological contexts, to our knowledge, have not been undertaken so far. This may be partly due to the complexity of defining and inferring interactions in multi-strain pathogens, and partly due to the lack of a simple and general enough framework linking ”stress” to ”interactions” in such systems.
In this paper, we address this gap, by considering the stress-gradient-hypothesis in an epidemiological multi-strain system, namely Streptococcus pneumoniae bacteria, shaped by heterogeneous interactions in co-colonization between multiple serotypes. We study application of SGH using microbial co-colonization prevalence data from different geographical and epidemiological settings and linking them with the predictions of a mathematical model [20, 21]. Streptococcus pneumoniae is an important human pathogen, which despite being carried asymptomatically most of the time in the nasopharynx, can cause acute otitis media, bacterial meningitis, sepsis and pneumonia, in children and vulnerable adults such as the elderly [26, 27]. The natural habitat of the pneumococci is the mucosa of the human nasopharynx, where a single strain can persist for weeks or months, sometimes in parallel with other strains. The phenomenon of more than one pneumococcal strain colonizing the nasopharynx at the same time, is known as co-colonization, or multiple carriage, which can refer to these being different serotypes, or clones, or distinct strains defined by some trait of interest [14].
There are more than 90 serotypes defined by the polysaccharide capsule in Streptococcus pneumoniae, which have associations with host immunity and invasive disease [29], although much genetic diversity exists also within each serotype. Furthermore, there is wide variation in the range of pneumococcal colonization and co-colonization prevelances, as well as serotype and clonal diversity in different parts of the world, and this variability is not completely understood, both when considering pre-vaccine trends and trends in the post-vaccine era. This may reflect variations in transmission environment, study populations with respect to age, ethnicity, underlying host genetics, socioeconomic living conditions, vaccine coverage, and differences in sampling, isolation techniques and transport, and methods of sampling [30, 3, 2]. The health conditions of study subjects at the time of sampling may also vary and impact results. In addition, overcrowding and poor hygiene in some settings may favour the interchange of infecting microorganisms. Finally, different geographical settings offer also different climate conditions, including temperature, humidity, light exposure, and eco-epidemiological contexts in terms of other co-circulating pathogens and diseases which can interfere with pneumococcus transmission.
How to interpret all this variation? While a single model for natural carriage cannot take all these factors into account in individual detail, an abstract and sufficiently general epidemiological framework can encapsulate all these variations into a global transmission intensity parameter for the focal colonizing species of interest, in this case, pneumococcus basic reproduction number . On the other hand, the complexities of inter-strain interactions and local composition at the level of serotypes and co-circulating clones can be encapsulated into a global parameter of susceptibility to co-colonization .
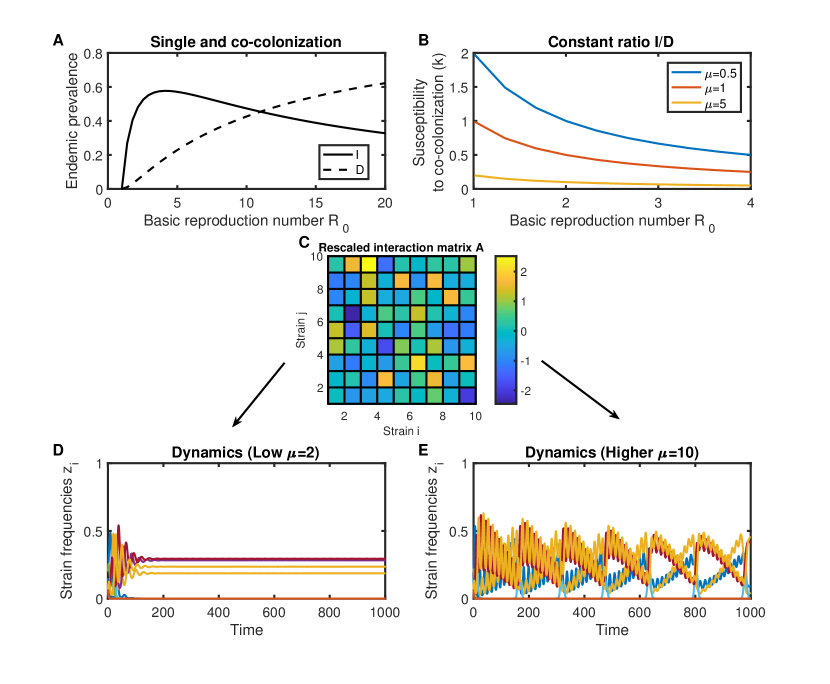
A recent mathematical model proposed by [20], helps to formalize and integrate this approximation, by describing the processes of single and co-colonization in a polymorphic microbial ecosystem by an SIS (susceptible-infected-susceptible) epidemiological model with similar strains and co-infection in two timescales (a fast neutral one, and a slow non-neutral timescale). The strains exhibit slight variation in pairwise co-colonization susceptibility coefficients , enough to drive hierarchical epidemiological dynamics between them, in a broad spectrum of stable and unstable possible configurations. In the matrix, describe pairwise facilitation between and , while entries below 1, denote pairwise competition or antagonism between and . Such variability in interactions between strains, creates frequency-dependent competition in epidemiological transmission and leads to explicit replicator dynamics over a slow timescale between strains [20].
Studying mathematically the feedbacks between neutral and non-neutral dynamics, and the range of system behavior for different mean-field parameters and special cases (see Figure 1), they have suggested that the single-to-cocolonization ratio may act as a gradient for dynamic complexity of multi-strain coexistence [21]. In the limit of low , for the same relative variation in co-colonization coefficients between strains (, the system tends to (multi-) stable fixed point coexistence and a smaller number of strains coexisting per site. In contrast, in the limit of large , the system displays oscillatory coexistence behavior of more strains, including limit and heteroclinic cycles, corresponding to well-studied classical examples of the replicator equation in evolutionary game theory [33, 34].
As the single to co-colonization ratio in their model [20] is given by , i.e. it encodes explicitly a trade-off between transmission intensity and mean interaction parameter in co-colonization, they argue that keeping constant under different environmental pressures and conditions would support application of the stress-gradient hypothesis [21], where in ‘harsher’ conditions (lower carriage prevalence, ) would show an increase, and conversely, in more ‘benign and favourable’ conditions (higher carriage prevalence, ) would be lower. Host susceptibility to co-colonization once colonized by a pneumococcus serotype has so far been estimated in the range 10-50% [35, 36, 37, 38]. If any trade-off variation in in response to is verified, it should imply upregulation/downregulation of cooperative interactions between strains in susceptibility to co-colonization if the same set of strains is found to occur across systems. In contrast, if different strains are associated to different settings, the trade-off should be verified as a result of differential selection, e.g. entities with different competitive abilities being effectively selected in different environments.
It is precisely this phenomenon that we investigate here, inspired by the -strain co-colonization model of [20, 21]. We use published pneumococcal studies in the literature, and comparatively analyze their reported data, to offer a fresh quantitative exploration of the stress-gradient hypothesis in epidemiology.
| Id. | Location | Year | Sample size | Age (y) | Susceptible | Single-col. | Co-col. | Nr. serotypes | Ref. |
| 1 | Iran | 2009 | 1291 | 850 (65.8%) | 213 (16.5%) | 228 (17.7%) | 30 | [1] | |
| 2 | Spain | 2004-2005 | 105 | 11 (10.5%) | 53 (50.5%) | 41 (39%) | 21+NT | [2] | |
| 3 | Venezuela-1 | 2004-2005 | 50 | 15 (30%) | 25 (50%) | 10 (20%) | 7 | [3] | |
| 4 | Iceland-1 | 2009 | 514 | 123 (23.9%) | 299 (58.2%) | 92 (17.9%) | 12+NT | [4] | |
| 5 | Netherlands | 2009 | 1169 | 366 (31.3%) | 623 (53.3%) | 180 (15.4%) | 32+NT | [5] | |
| 6 | Bangladesh | 2012 | 212 | 87 (41%) | 98 (46.2%) | 27 (12.7%) | 27+NT | [7] | |
| 7 | Nepal | 2010-2013 | 600 | 303 (50.5%) | 237 (39.5%) | 60 (10%) | 65+NT | [8] | |
| 8 | Portugal-1 | 2001 | 270 | 97 (35.9%) | 143 (53%) | 30 (11.1%) | 43+NT | [9];[10] | |
| 9 | Norway-2 | 2008 | 602 | 119 (19.8%) | 411 (68.3%) | 72 (12%) | 34+NT | [12] | |
| 10 | Portugal-2 | 2006 | 449 | 130 (29%) | 276 (61.5%) | 43 (9.6%) | 43+NT | [9];[10] | |
| 11 | Norway-1 | 2006 | 611 | 136 (22.3%) | 415 (67.9%) | 60 (9.8%) | 32+NT | [12] | |
| 12 | India | 2004-2005 | 510 | 232 (45.5%) | 249 (48.8%) | 29 (5.7%) | 34+NT | [13] | |
| 13 | Switzerland | 2015-2016 | 287 | 139 (48.4%) | 134 (46.7%) | 14 (4.9%) | 10 | [14] | |
| 14 | Brazil | 2010 | 242 | 101 (41.7%) | 128 (52.9%) | 13 (5.4%) | 25 | [6] | |
| 15 | Denmark | 1999-2000 | 437 | 190 (43.5%) | 225 (51.5%) | 22 (5%) | 35 | [15] | |
| 16 | Iceland-2 | 2008 | 514 | 143 (27.8%) | 341 (66.3%) | 30 (5.8%) | 12+NT | [4] | |
| 17 | Vietnam | 2010-2011 | 350 | 210 (60%) | 130 (37.1%) | 10 (2.9%) | 14+NT | [16] | |
| 18 | Mozambique | 2009-2010 | 927 | 144 (15.5%) | 739 (79.7%) | 44 (4.7%) | 44+NT | [17] | |
| 19 | Ghana | 2011 | 848 | 574 (67.7%) | 260 (30.7%) | 14 (1.7%) | 39+NT | [18] | |
| 20 | Kenya | 2009-2010 | 1087 | 104 (9.6%) | 939 (86.4%) | 44 (4%) | 56+NT | [19] | |
| Outliers | |||||||||
| Greece | 1997-1999 | 2448 | 1682 (69%) | 751 (30.7%) | 15 (0.6%) | [23] | |||
| Venezuela-2 | 2006-2008 | 1004 | 733 (73%) | 266 (26.5%) | 5 (0.5%) | [22] |
II. Methods
i. Data collection and preparation
We have reviewed published papers reporting nasopharyngeal carriage of S. pneumoniae, including co-colonization, in different countries. In the literature, we selected cross-sectional studies conducted in young children, typically years old, where they reported pneumococcal prevalence of colonization (% of carriers), prevalence of co-colonization (% of carriers), and predominantly sought studies performed on healthy children, although this was not used as a strict criterion. For example, we found one study in Switzerland involving children with respiratory infection [14], and this was also included, based on the assumption that carriage is a pre-requisite for disease, and hence overall patterns of carriage in diseased and healthy subjects are expected to be similar. Data were extracted from these studies for the following variables: prevalence of S. pneumoniae carriage, co-colonization prevalence, country, first author, year the study was conducted, age group of participants, detection method for S. pneumoniae, study period before or after vaccination, season or months of the year when the samples were collected, reported pneumococcus serotypes, and information on the gender of participants, when available.
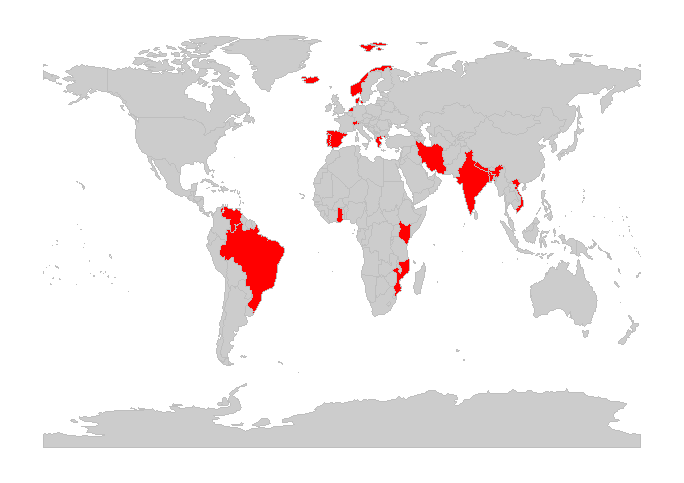
After retrieving a large number of pneumococcus articles and epidemiological surveys, we found 22 articles eligible (see Table 1). The reason for exclusion of studies was either because there was no co-colonization information declared, or the age group did not correspond to our target age. Also, we intentionally selected only cross-sectional studies to match with the mathematical model assumptions, and this condition made us exclude 4 articles that reported co-colonization rates from a longitudinal design (Finland [28], Peru [57], South Africa [29], Gambia [30]). The selected studies were conducted in different countries from four continents: Africa, Asia, Europe and South America. See Figure 2 for a visualization of the countries where the co-colonization reports were found. We included three instances of studies in the same countries: Iceland-1 and Iceland-2 [4], where two different methods were used for quantifying prevalence of multiple carriage, Portugal-1 and Portugal-2, conducted before and after implementation of the PCV7 vaccine [9], and Norway-1 and Norway-2 [12], also conducted in the pre- and post-vaccine era. Most of the studies corresponded to surveys conducted in children in the pre-vaccine era. We checked for outliers in our data. As outliers resulted to be the studies conducted in Greece [23] and Venezuela-2 [22]. These two studies studies appeared to have extremely low values for cocolonization prevalence , very distinct from the rest of the dataset. We removed these studies from our analysis leading to 20 articles in the final set of cross-sectional studies used. Finally we analyzed these studies under a common framework. The data were entered in an Excel spreadsheet for further analysis (See Supplementary files).
In Table 1 we provide a summary of the multi-country data used in our analysis. In our dataset, the prevalence of susceptible children in the total sample of the survey, was varying from about 10% [19] to 70% [18], the prevalence of single colonization, , was varying from about 16% [1] in Iran to 86% [19] in Kenya, and the prevalence of co-colonization, , was varying between 1.7% in Ghana [18] and 39% in Spain [2]. Sample sizes across studies vary between 50 and 1291 children in Venezuela [3] and Iran [1] respectively. The most common Streptococcus pneumoniae serotypes shared among all studies, demonstrating a high rate of occurrence globally, were: ”14” ”19F” ”6A” ”6B”, a majority of which are included in PCV7 (4, 6B, 9V, 14, 18C, 19F and 23F).
ii. The SIS co-colonization model framework
Following the SIS model in [20], we assume that the susceptible and colonized host prevalences and have already reached their steady-state values and (fast dynamics), in each country, at the time of the survey, and that the basic reproduction number is higher than 1. Thus, in each study, there is an endemic equilibrium for global prevalence of pneumococcal carriage:
| (1) |
Furthermore, when considering the subdivision of carriage into single and co-colonization, the equilibrium values for the proportion of children in these compartments are given by:
| (2) |
where the ratio of single to co-colonization at endemic equilibrium is
We will drop the asterisks from now onward, assuming always an equilibrium in these global quantities. Notice that the equilibrium assumption is often adopted in mathematical models of colonization to estimate epidemiological parameters be it from longitudinal data, manifested as constant time-inhomogeneous hazards [35, 37, 36] or from cross-sectional prevalence data [11].
The explicit analytical formulae above derived from the model [20], under the endemic equilibrium assumption, imply that using the different datasets, we can link the reported proportions of carriers of a single serotype and the proportion of double carriers, to the analytic expressions for single infection prevalence , and double infection prevalence , from this model. Thus, we can obtain the basic reproduction number and mean interaction coefficient in co-colonization from exactly solving two equations for two unknowns.
Using the SIS model [20] for epidemiological dynamics of Streptococcus pneumoniae serotypes (see Supplementary material S2), under the assumption of quasi-neutrality, we can estimate site-specific basic reproduction number as:
| (3) |
and the mean coefficient of susceptibility to co-colonization between serotypes as:
| (4) |
using the data proportions of hosts in different compartments (), as shown in Table 1.
iii. Serotype analysis and occurrence in reported studies
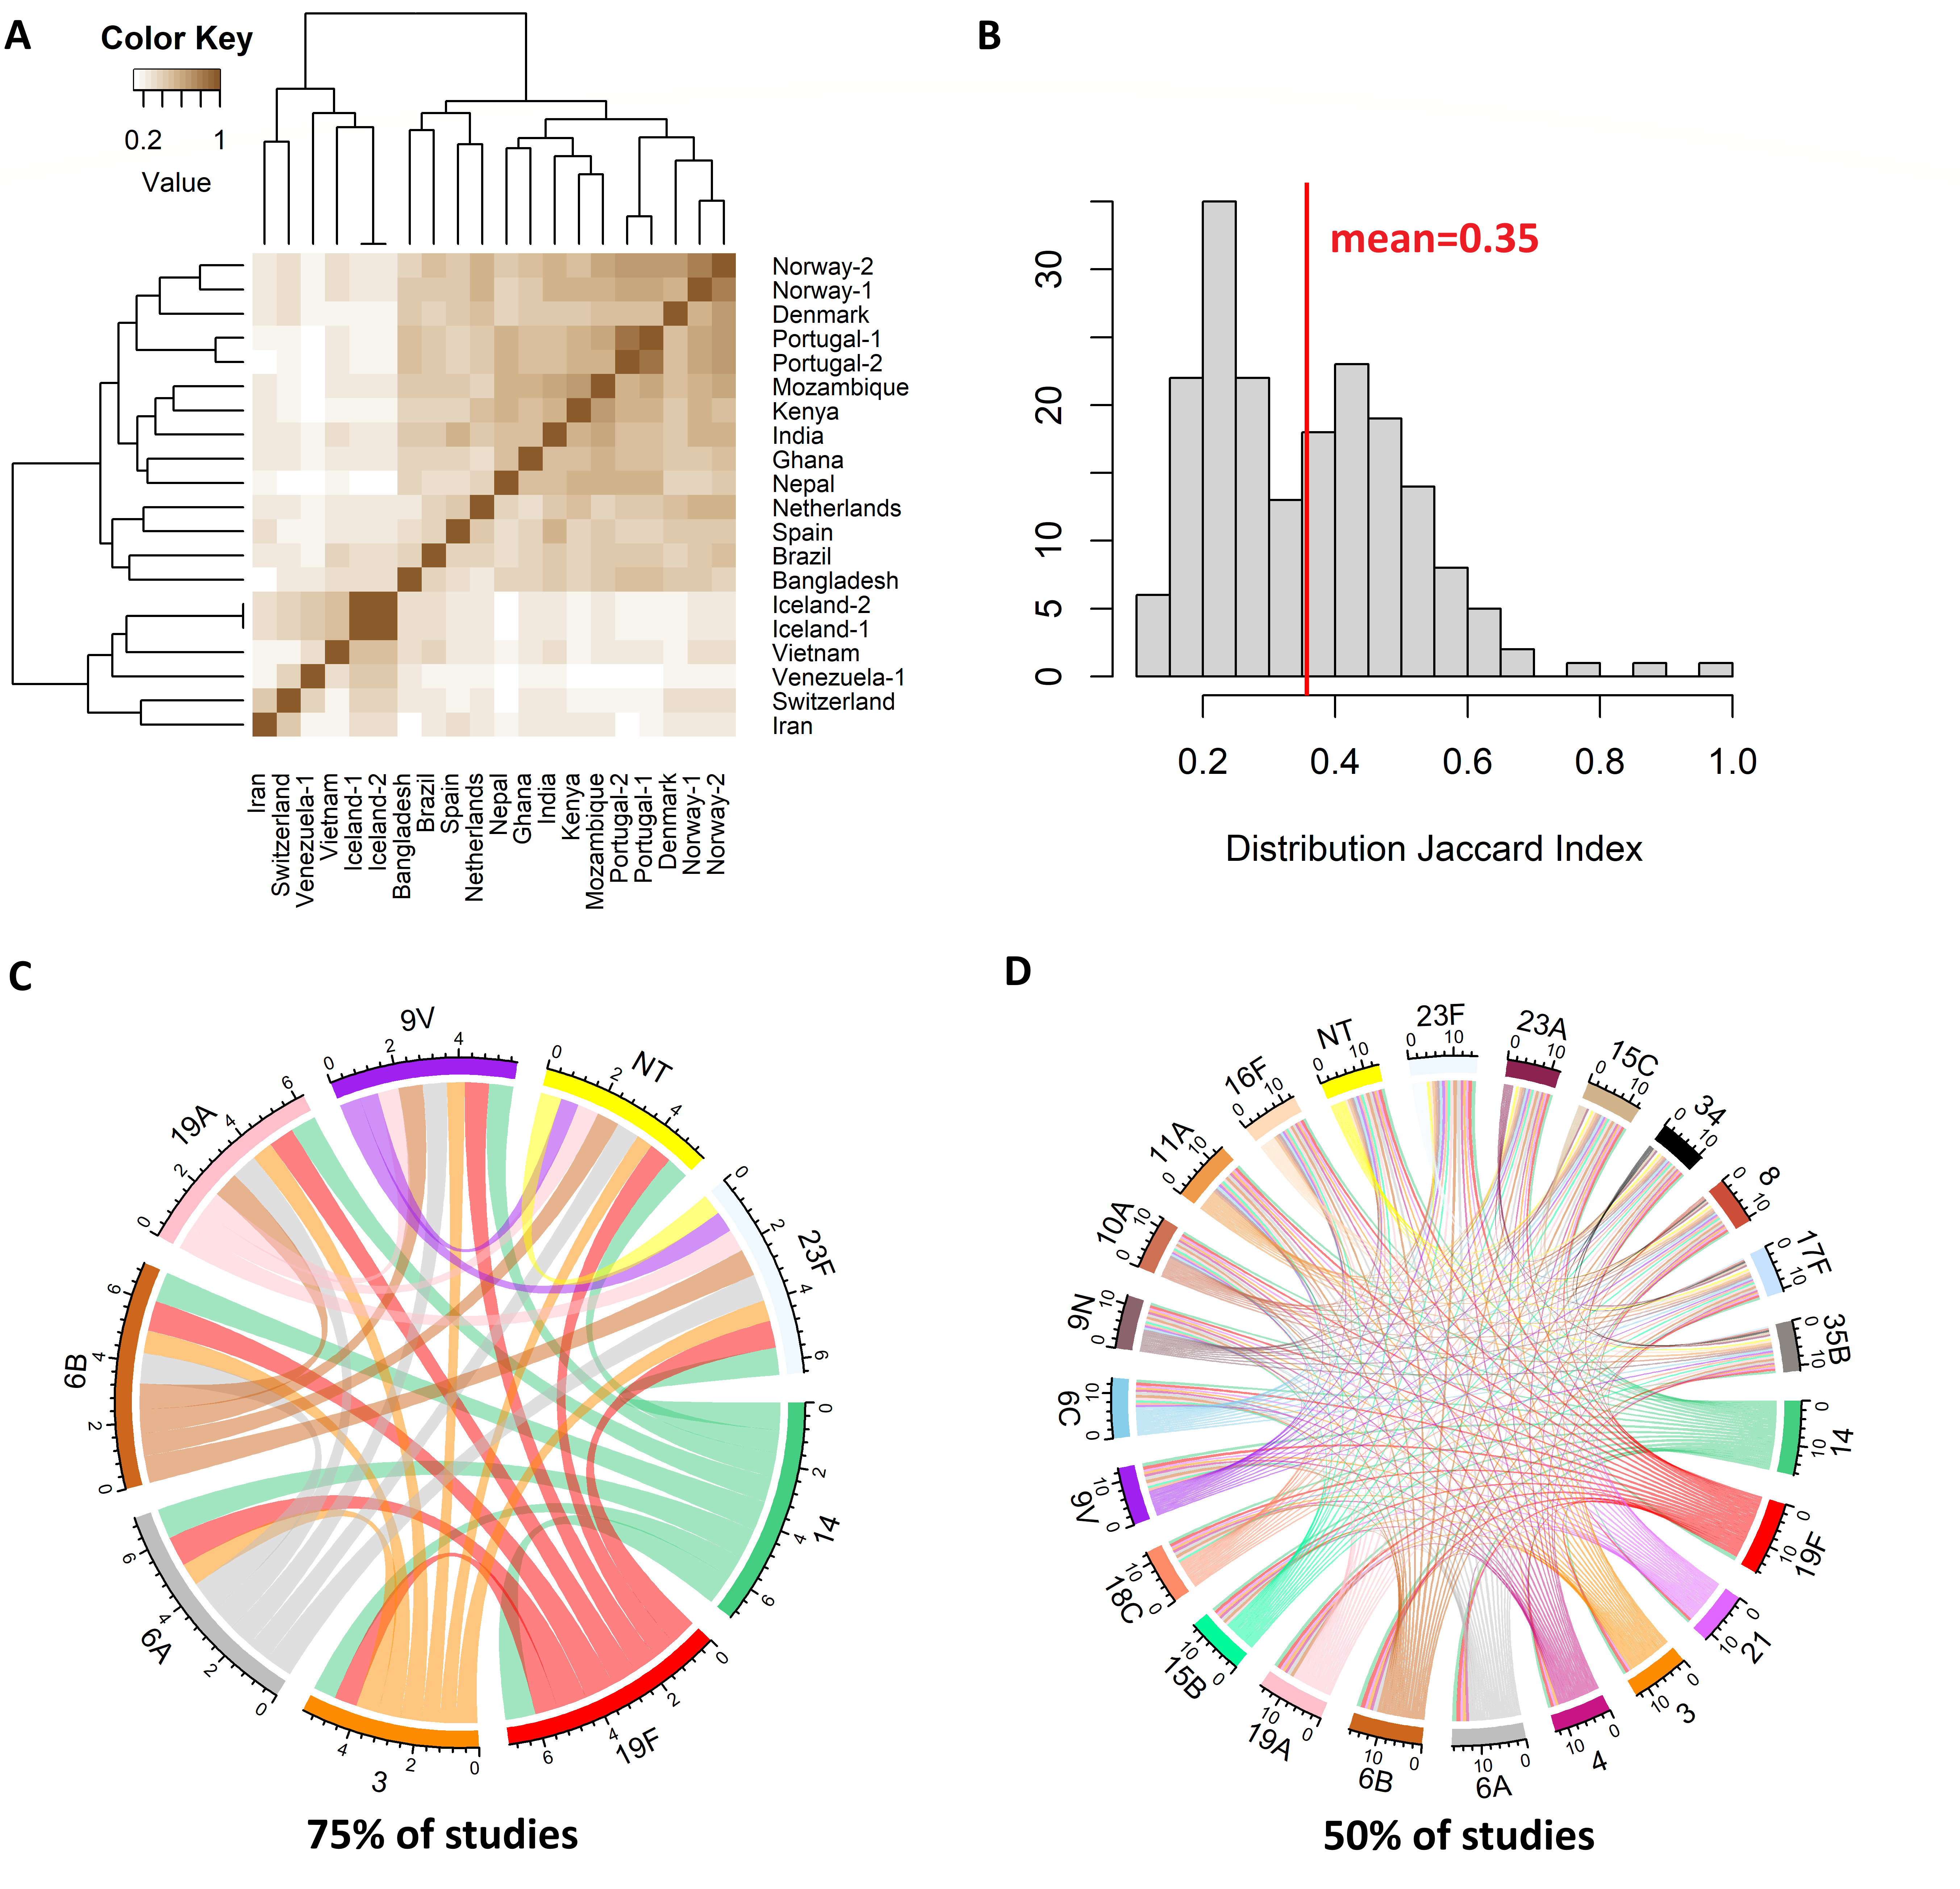
Each study reports the serotypes they detected by different methods like: multiplex PCR, Quelling method, culture, conventional. We retrieved all serotypes these studies reported, and we collected the information in an Excel Worksheet, noting that some studies report all serotypes they detected meanwhile other studies summarised only some of the serotypes. For example, in the Bangladesh study [7], the article mentions they found a total number of 46 serotypes, but we managed to retrieve from the actual data in their publication only 27 serotypes, besides the non-typable. On average the numbers of serotypes reported per study varied between 7 and 56 (Table 1). The total number of serotypes appearing at least once in our dataset (20 epidemiological settings) is 102, where commonly identified serotypes include: ”6A” ”6B” ”14” ”19F”. Then, we analyzed the occurrence and co-occurrence these serotypes had in all the studies of our dataset. We analyzed the number of studies each serotype was reported and the number of times each serotype was co-encountered with any of the other serotypes present in different studies. The co-occurrence patterns between serotypes are summarized in Figure 4C-D (See also Figures S2-S3 for more details). For details on pneumococcus diversity in terms of serogroup composition of the global dataset see also Figures S4-S6.)
iv. Similarity indices between studies
Epidemiological parameters ()
After estimating site-specific basic reproduction number and co-colonization susceptibility , we also calculate the epidemiological parameter distance () between any two studies as the Euclidean distance between their corresponding (, ) points in a 2-d space, as = .
Single to co-colonization ratio ()
We considered also pairwise distances in the single-to-colonization ratio reported in any two studies, as an additional epidemiological indicator of transmission similarity and constraints.
Serotype composition
After extracting the identities of the serotypes reported in all cross-sectional epidemiological studies, to compare any two sites on the basis of their serotype composition, we used the Jaccard index. This was calculated as an intersection index between the serotypes reported in study and divided by the union of all the serotypes in both studies. The higher this index is, the higher the proportion of common serotypes between the two studies, and the lower the index is, the lower the proportion of serotypes common between studies. Thus, for each pair of studies we have:
where and are the serotypes reported in studies and . Non-typeable serotypes (NT) were considered as one separate indistinguishable entity (NT equivalent to an extra ’serotype’).
Geographic distances
Geographic distances between any two study sites were evaluated, country-wise, using dataset dist_cepii from the library cepiigeodist in R. The distances are calculated following the great circle formula, which uses latitudes and longitudes of the most populated city or of its official capital.
Clustering based on similarity
Based on the similarity measures above, we typically also performed data clustering to examine whether distinct groups of studies would emerge. For the Jaccard indices and geographic distances, we considered the default hierarchical clustering emerging from the heatmap function in R. With regards to single to cocolonization ratios (), we used k-means clustering functions in R.
III. Results
i. Inferred epidemiological parameters for each setting
From applying the model to prevalence data of single and double colonization across all the locations, we are able to find the maximum-likelihood values of the basic reproduction number, and the reference interaction parameter in co-colonization, , as the exact solution of two mathematical equations (Eqs. 3-4), under the assumption of an endemic epidemiological equilibrium of the SIS model. Analyses are performed using R software (version 4.0.3). See Table 2 for results of this estimation for all countries.
| Location | Single to cocolonization ratio | Basic reproduction number | Mean susceptibility to co-colonization |
| (95% CI) | (95% CI) | (95% CI) | |
| Iran | 0.93 (0.66-1.06) | 1.52 (1.5-1.58) | 2.06 (1.9-2.6) |
| Spain | 1.29 (0.27-2.27) | 9.55 (7.5-21) | 0.09 (0.07-0.18) |
| Venezuela-1 | 2.5 (0.51-4.3) | 3.33 (2.94-5.56) | 0.17 (0.12-0.43) |
| Iceland-1 | 3.25 (2.03-3.86) | 4.18 (4.02-4.87) | 0.1 (0.09-0.13) |
| Netherlands | 3.46 (2.45-3.88) | 3.19 (3.1-3.5) | 0.13 (0.12-0.16) |
| Bangladesh | 3.63 (1.62-4.69) | 2.44 (2.33-2.9) | 0.19 (0.16-0.32) |
| Nepal | 3.95 (2.49-4.71) | 1.98 (1.92-2.14) | 0.26 (0.23-0.35) |
| Portugal-1 | 4.77 (2.33-6.23) | 2.78 (2.62-3.31) | 0.12 (0.1-0.19) |
| Norway-2 | 5.71 (3.31-7.03) | 5.06 (4.78-6.11) | 0.04 (0.04-0.06) |
| Portugal-2 | 6.42 (3.56-7.8) | 3.45 (3.3-4.01) | 0.06 (0.06-0.09) |
| Norway -1 | 6.92 (4.12-8.25) | 4.49 (4.27-5.27) | 0.04 (0.04-0.06) |
| India | 8.59 (4.95-10.85) | 2.2 (2.13-2.43) | 0.1 (0.08-0.14) |
| Switzerland | 9.57 (4.37-12.86) | 2.06 (1.98-2.35) | 0.1 (0.08-0.17) |
| Brazil | 9.85 (4.09-13.93) | 2.4 (2.28-2.86) | 0.07 (0.06-0.13) |
| Denmark | 10.23 (5.44-13.16) | 2.3 (2.22-2.56) | 0.08 (0.06-0.12) |
| Iceland-2 | 11.37 (6.31-14.33) | 3.59 (3.43-4.15) | 0.03 (0.03-0.05) |
| Vietnam | 13 (5.98-18.24) | 1.67 (1.62-1.8) | 0.12 (0.09-0.21) |
| Mozambique | 16.8 (10.05-20.38) | 6.44 (6.14-7.69) | 0.01 (0.009-0.015) |
| Ghana | 18.57 (10.35-24.34) | 1.48 (1.45-1.55) | 0.11 (0.09-0.18) |
| Kenya | 21.34 (12.64-26.2) | 10.45 (9.79-12.35) | 0.00496 (0.004-0.007) |
| Global mean | 8.1 (4.38-10.4) | 3.73 (3.47-4.9) | 0.19 (0.17-0.28) |
| Global mode | 3.55 (2.47-4.7) | 2.42 (2.3-2.4) | 0.097 (0.08-0.18) |
From these data, the highest basic reproduction number emerges in the study in Kenya (), whereas the lowest transmission intensity are displayed in the studies in Ghana and Iran () in Iran. The highest susceptibility to co-colonization emerges in Iran (), and the lowest in the study in Kenya (). Notice that with the exception of Iran, all the other coefficients support competition between pneumococcus serotypes in co-colonization (), indicating that a pre-existing serotype in colonization makes it harder for a second serotype to co-colonize the same host. In contrast, Iran’s value for above 1 indicates average facilitation between colonizer and co-colonizer serotypes in co-colonization in this epidemiological setting.
To obtain confidence intervals for these parameters, we then accounted for sample size and variability in sample sizes across countries. We calculated 95% confidence intervals for each estimated and , using the multinomial distribution. In our case, we adopted an empirical simulation procedure (500 simulations), assuming a multinomial distribution for the three variables: number of susceptible hosts , number of single infected , number of coinfected , taking into account the sample size of each study () and the maximum-likelihood 3-dimensional probability vector for , with . For each new realization of (), using the equations (4-4), we obtain new estimates for and , consistent with that sample size and the reported prevalences in that location. Finally, for each study we report the 95% confidence intervals for all such estimates of and , from the limits of the 2.5% and 97.5% lower and upper quantiles, capturing uncertainty due to sampling process (Table 2). From this simulation procedure (besides distributions for and , as illustrated in detail in Figures S7-S8), we also obtained 95% uncertainty intervals for the single-to-co-colonization ratio in each study (Figure S9).
ii. Testing for the stress-gradient hypothesis across settings
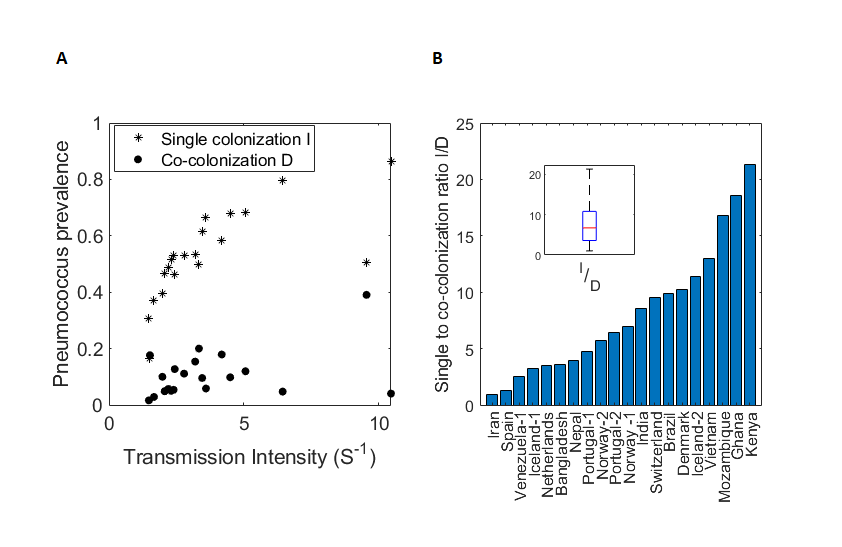
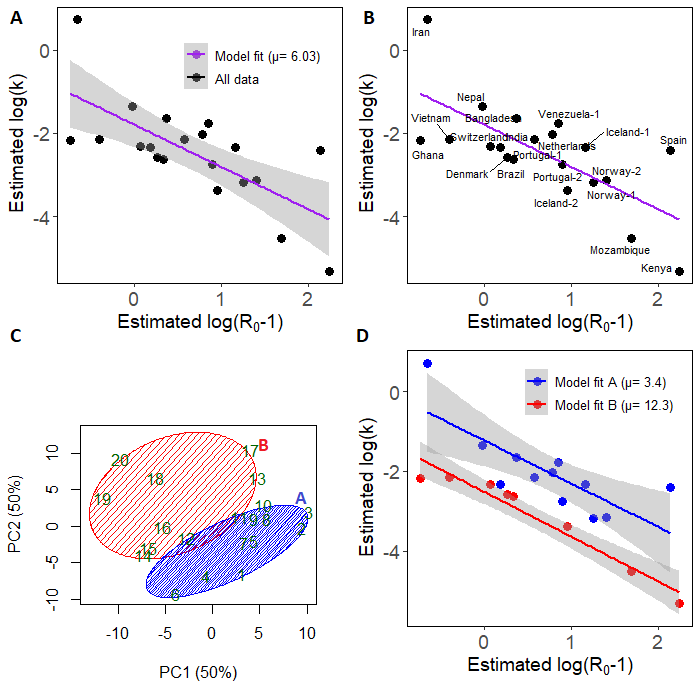
After collecting all the data from different countries, and fitting the SIS epidemiological model to infer site specific values for and [20], we tested for the Stress Gradient Hypothesis, as predicted by this model [21]. In order for SGH to hold, the requirement within our model is that the ratio of single-to-cocolonization does not co-vary with , i.e. is constant, as varies, thus implying a trade-off between and values. In our dataset the ratio of single to co-colonization varies from 0.93 to 21.34 in all studies (see Fig.3), but there is no significant trend for its co-variation with (linear regression for slope different from zero, p-value¿0.1).
The expectation for constant is that if the basic reproduction number increases in a setting, the susceptibility to co-colonization should decrease in that same setting. This implies in settings with high prevalence of carriage, pneumococcus serotypes should display higher competition, whereas in settings of lower , should increase, hence increasing more cooperation and facilitative interactions in co-colonization between serotypes. When considering the relationship in logarithmic scale, the model becomes linear, and hence we used linear regression between the estimated and in each study as a test for the stress-gradient hypothesis, expecting a slope of -1 (Model: ), expecting:
This linear regression confirmed our hypothesis (Fig.5A-B), for we obtained as best-fitting parameters an intercept equal to -1.796 (p-value = 1.14e-06 ) and a slope equal to -1.0133, very close to 1 (p-value= 0.000468). This implies the best-fitting single to-co-colonization ratio that matches our data is with 95% confidence interval [3.56, 10.21]. The mean-squared-error for the model-data differences in estimated , (MSE) for this is equal to 0.15, and coefficient of determination for the model adj. =0.4747.
Notice that this best-fitting line has a distinct predicted from the value obtained using simply the empirical arithmetic mean of values of all countries (equal to 8.1 ). The mean squared error of the model-predicted corresponding to this value () is 0.17, higher than the error for (see Figure S10). On the other hand, the resulting from the model is very close to the geometric mean of the empirical ratios of single to co-colonization in our dataset (Geo.mean [I/D]=6.08).
iii. Emergence of two epidemiological settings: lower and higher ratio
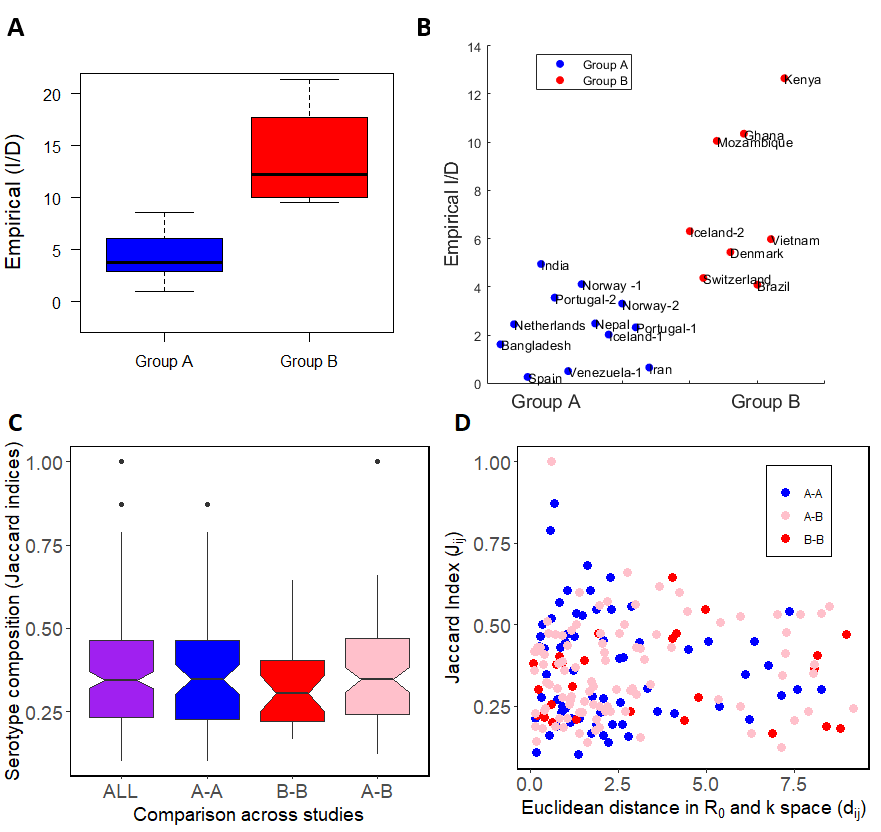
The variability in empirical single-to-colonization ratios , reported across studies (Figure 3), led us to explore similarity and clustering based on this epidemiological quantity. We performed study clustering according to empirical values. Our analysis attempted to find studies that were below and above the global mean, and revealed two clusters of studies, as shown in Figure 5C:
-
•
Low- settings: ”Iran” ”Spain” ”Venezuela-1” ”Iceland-1” ”Netherlands” ”Bangladesh” ”Nepal” ”Portugal-1” ”Norway-2” ”Portugal-2” ”Norway-1” ”India” - grouped in blue color, with arithmetic mean of empirical ratios equal to 4.28, i.e. co-colonization about 4 times less frequent than single colonization.
-
•
High- settings: ”Switzerland” ”Brazil” ”Denmark” ”Iceland-2” ”Vietnam” ”Mozambique” ”Ghana” ”Kenya”, -grouped in red color, with arithmetic mean of empirical ratios, about 3 times higher, equal to 13.84, implying co-colonization of children by more than one serotype is much less likely, about 14 times less frequent than single colonization.
Next, we applied the linear regression for the stress-gradient hypothesis, to each group separately in logarithmic scale (Fig. 5D). We obtained significant slopes very close to -1 in both cases. For group A (blue line), we obtained slope=-1.082 [95%CI: -0.45 -1.72] (p-value= 0.00351) and intercept=-1.225 (p-value=0.00182), confirming the trade-off between and around a lower constant [95%CI: 1.78 - 6.52]. For the linear model applied to the second group, B (red line), we obtained a slope = -1.123 [95%CI: -0.84, -1.4](p-value= 6.41e-05) and intercept= -2.5159, (p-value=1.02e-06), maintaining again the expectation from the SGH for this set of studies, but now corresponding to a higher = 12.38 [95%CI: 9.09-16.85]. These model-estimates for are close to the empirical geometric means of empirical values of single to co-colonization ratios in the two groups (Geo.mean , and Geo.mean ).
Finally, we verified in a single global regression model that this separation of data in two groups statistically improves model fit, including cluster-id as another variable, (Model: lm( Clustering)). The model with two clusters, preserves the same slope, while significantly improving the fit (p-value=6.691e-06, Multiple , Adj. ), compared to the model with just a single global (Multiple , Adj. ). This indicates the potential relevance of two epidemiological environments, where pneumococcus serotype coexistence can be found, for explaining the global distribution of and : in low and high single to co-colonization ratios (although finer-scale resolution is also plausible as shown in Figures S11- S12, but requiring more studies for high statistical power).
iv. Serotype composition similarity across studies
Jaccard indices and global similarity
To investigate whether there were any differences between serotype compositions reported in all the studies across different geographical locations, and ) settings, we first examined the Jaccard indices and compared them across the entire dataset, as well as with respect to the two groups: low and high . In Figure 6 we see the comparison of empirical single to co-colonization ratios across the two groups (6A), a summary of the regression results (6B), and how the Jaccard index values vary with respect to these groupings (6C-D). In Fig.6C, t-test results confirmed that serotype compositions do not vary significantly across groups. In particular, we did not find that for pairs of studies in group (A-A comparisons in ) or in group B (B-B Jaccard indices) or between groups, the serotype compositions are significantly different, (Two-sample Welch t-test, p-value¿0.1). We examined also how serotype similarity indices varied continuously along the epidemiological gradient as described by the Euclidean distance between site pairs (Fig. 6D) . We did not find a significant linear relationship, neither for all studies, neither when focusing on subgroup comparisons, i.e. studies in group A or group B only.
This suggests that, when looked at this resolution level, even though sites may differ in epidemiological parameters, while still satisfying the trade-off between carriage prevalence (transmission intensity ) and competition in co-colonization (), it is ultimately the same serotypes which broadly occur everywhere, hence pointing to the same serotypes adapting in their mutual interaction coefficients in response to alteration.
Serotype identities and occurrence patterns
Then we examined more closely the actual serotype compositions, in terms of precise identities, and their number of occurrences within each subset of the data (A and B) hence going deeper into any potential subtler differences between the two subgroups obtained from clustering. In group A, we found 5 unique serogroups: 45, 48, 32, 40, 27, which can be said to be associated with the epidemiological settings of low ratio of single to co-colonization. In group B, we found 3 unique serogroups: 46, 44, 47, which may be associated with epidemiological settings of high ratio of single to co-colonization. In any case, the group-specific serotype and serogroup occurrences were manifested in rare serotypes/serogroups, appearing in just 1-2 studies in either case.
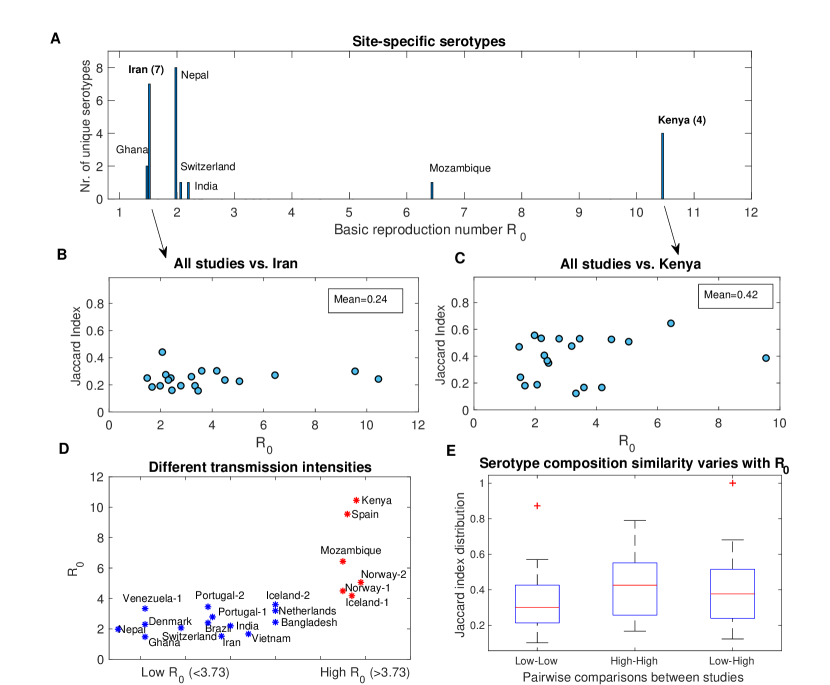
Notice that in terms of countries in the two extremes, we found that Iran in the limit of lowest (co-colonization in fact dominates in carriage) has these unique serotypes not reported in any other studies: 19, 6, 23, 10, 23C, 9, 4B. Whereas, Kenya in the limit of highest ratio of single to co-colonization (single colonization dominates in carriage), has these unique serotypes not reported in any other studies: 47F, 33D, 25A, 5B.
In each group of studies, any epidemiological setting displays on average about 30 serotypes co-circulating in the same population of children, 32 in A, and 31 in B. When comparing the rank-frequency distributions of serotype occurrences in each group of studies, counting in how many studies (within A and B, respectively) each serotype had been reported, we did not find differences in the rank-frequency distributions for serotype occurrences in each group and when compared to the global dataset (see Supplementary Figs. S13-S17).
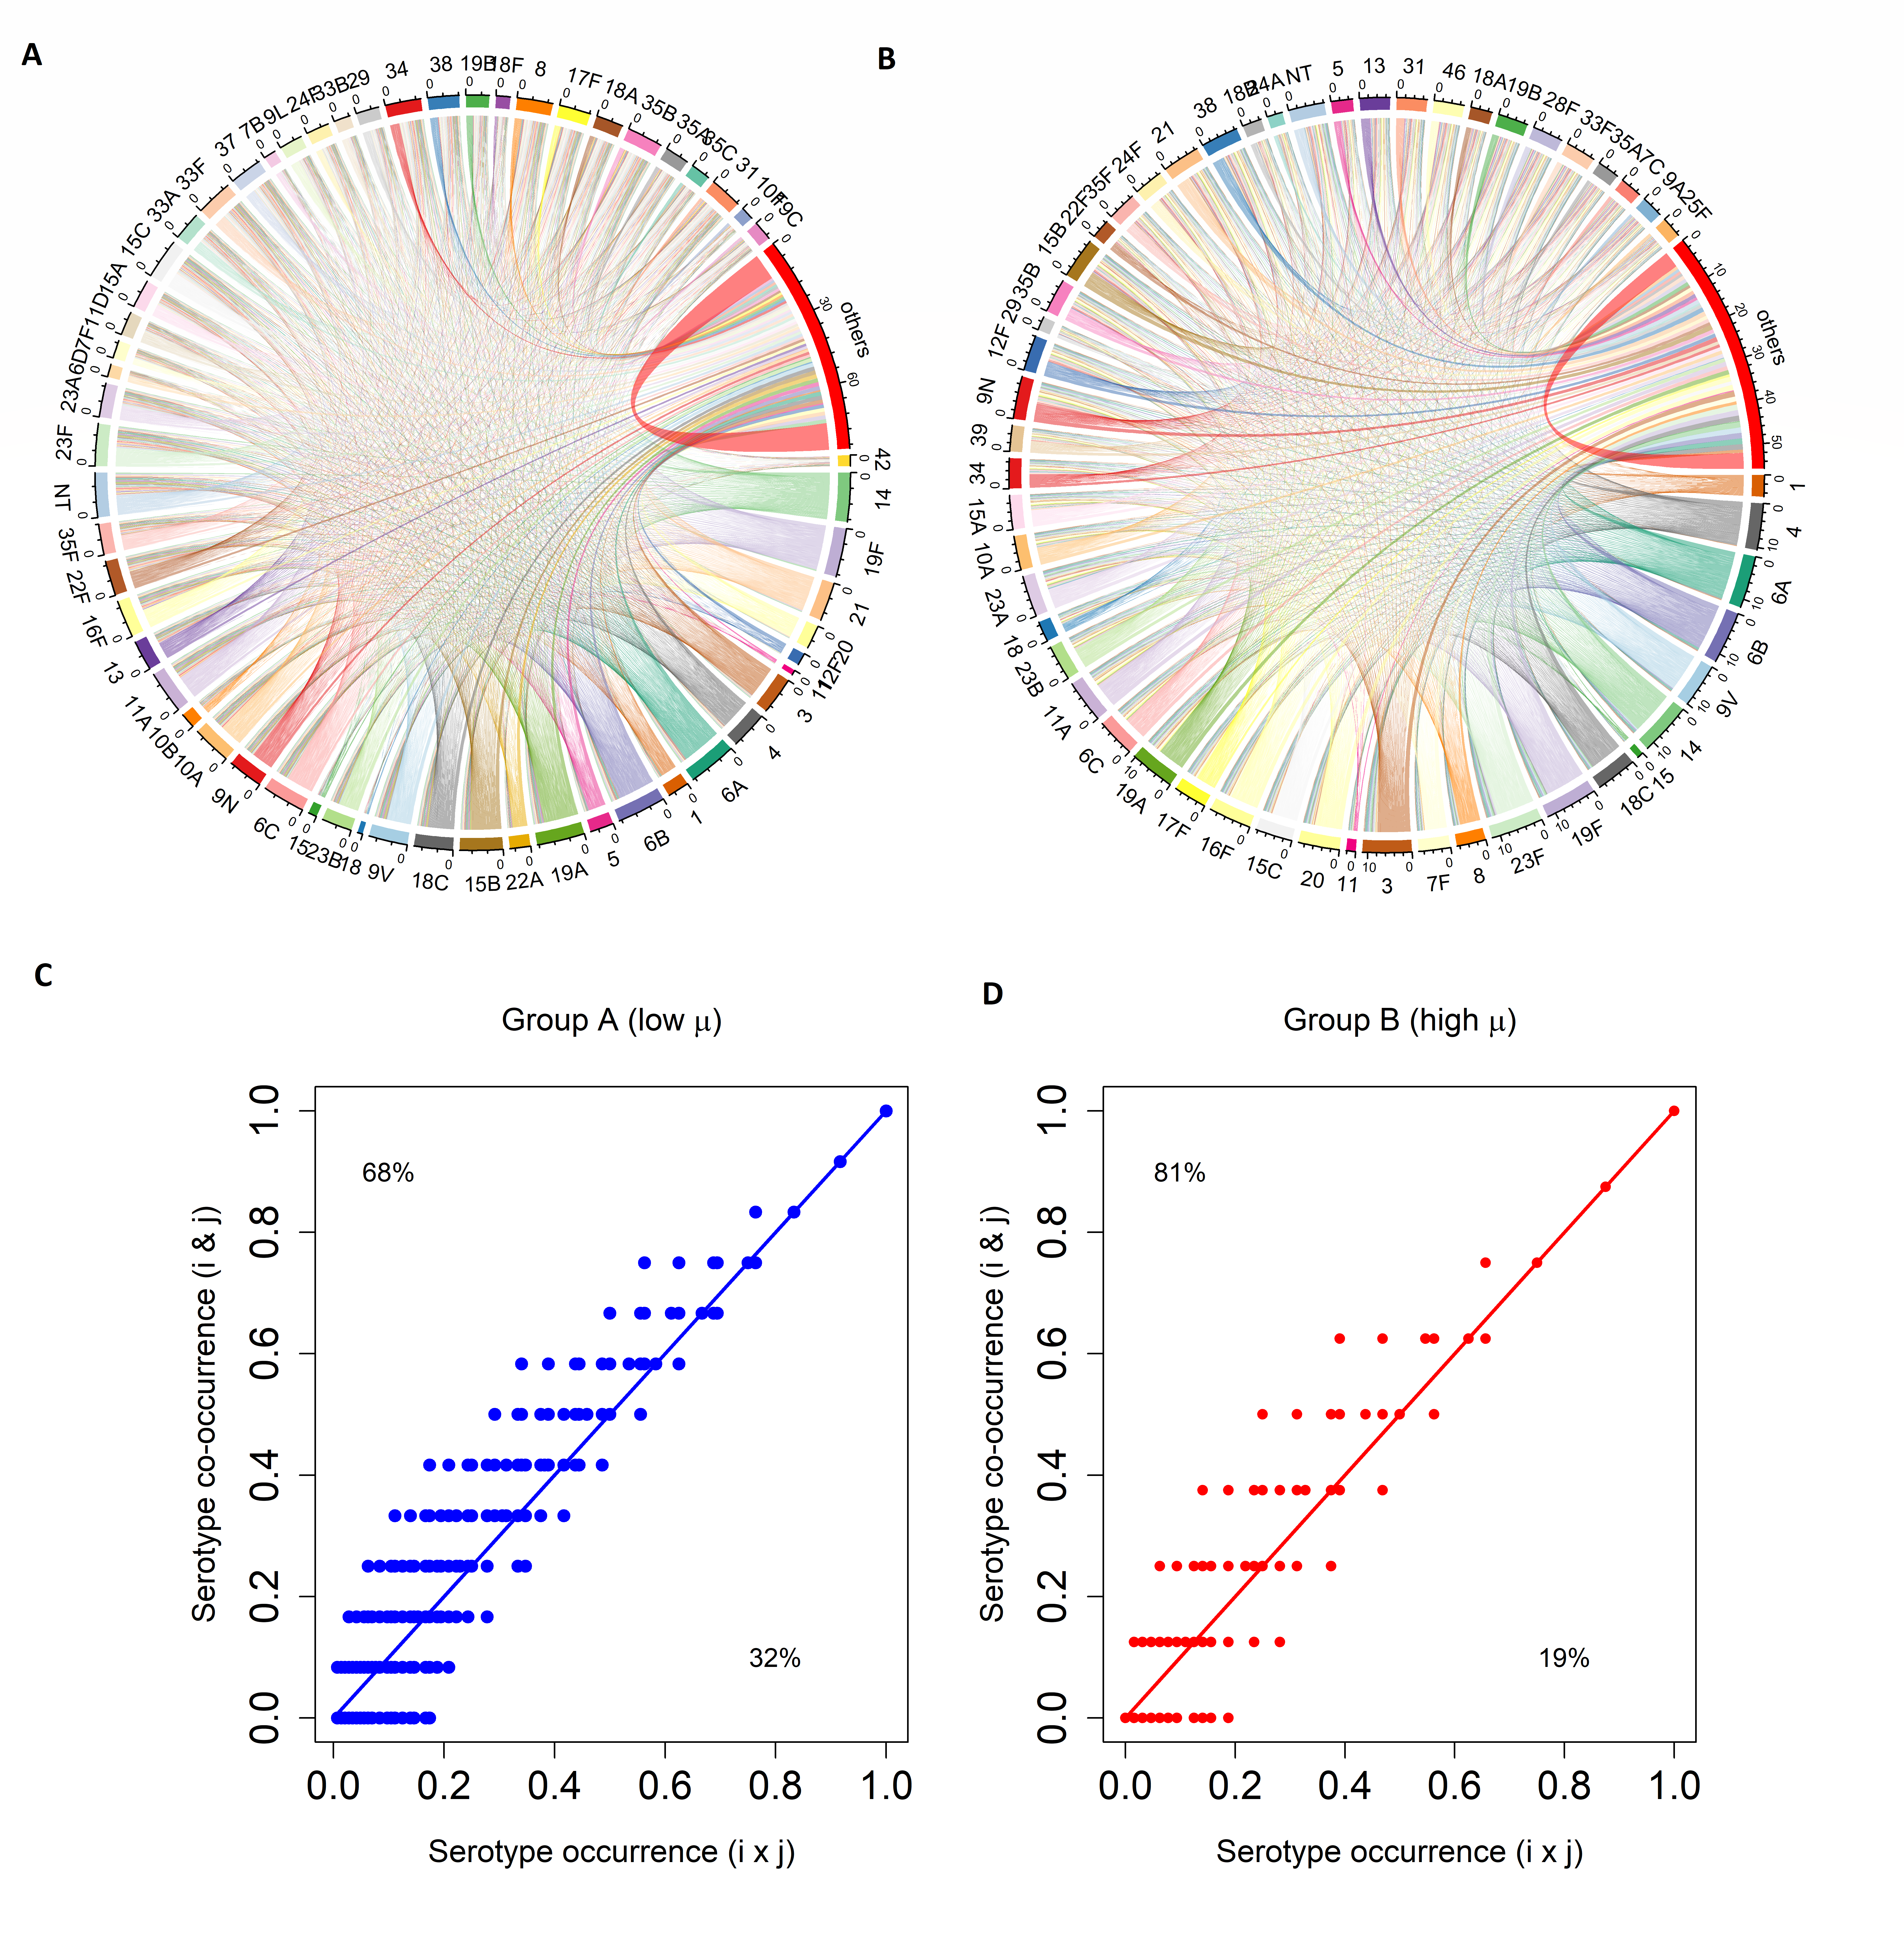
When considering patterns of particular serotype occurrence and co-occurrence, we did not find major differences between groups A and B (Fig.7 A-B). In the first group, a total of 92 serotypes are reported, with serotypes shared by all studies being: ”14” ”19F” ”6A” ”6B”. In the second group, a cumulative number of 80 serotypes are reported, where common serotypes shared by all studies without exception are: ”6A” ”6B” ”14” ”19F” ”23F”. In particular, rare serotypes found only in one study comprise about 30% of serotypes in each group (see Supplementary Table S1-S2 for more details and figures S14-S15).
When focusing on those serotypes common to both groups of studies, of low and high ratio of single to co-colonization, 70 serotypes in total, including NT (non-typeable), and individually separating those that occur more and less frequently in group A and group B, although we identified some trends for association (Fig.S18), these did not reach statistical significance. The odds ratios of being reported in either group of studies were not significantly different from 1, for none of the 70 serotypes. However, our procedure could identify for example that serotypes 3, 11, 18,20, 39, 12F, 28F are found in high- settings with probability at least higher than 20%, compared to low settings. In contrast, in the low- settings, serotypes 37, 10B, 22A, 22F, 33F, 9L, NT are found to occur with probability at least higher than 20% compared to high settings (see Supplementary Figures S19-S20).
When comparing the global probability of co-occurrence in the same site for two serotypes (Fig.S21), we consistently find more serotype pairs co-occurring in the same study above chance than below chance, suggesting the existence of some positive mutual feedbacks in serotype coexistence across settings. Furthermore, in this pattern, we do also find a significant difference at the level of groupings (Fig.7C-D): epidemiological sites with low ratio of single to co-colonization (group A: low ) had relatively less serotype pairs above chance (the product of their occurrences), than sites with higher ratio (group B: high ). Statistically the odds ratio for serotype pairs co-occurrence above chance vs. below chance, was 2 when comparing group B vs. A (, , Fisher’s Exact Test, p-value 2.2e-16).
This indicates that sites with high favour more coexistence, and may entail more intrinsic dependencies between serotypes than sites with lower , where serotypes appear to co-occur more freely and independently from each other, indicating stronger niche effects. These patterns link with expectations from the mathematical model of Madec and Gjini [20] with randomly generated interaction coefficients, where is revealed as a gradient for dynamic complexity in coexistence of multiple strains [21]. Mathematically, Gjini and Madec [21] show that as a direct consequence of the replicator dynamics at the core, sites with lower (e.g. high for fixed ) should be characterized by multi-stability, where fewer serotypes typically coexist, whereas sites with higher (e.g. low for fixed ), for the same rescaled interaction coefficients, are characterized by oscillatory inter-dependent dynamics between typically a larger set of serotypes.
: transmission intensity as a structuring gradient
Finally, we considered the basic reproduction number as a potential key factor in structuring serotype composition, but at a coarser level of resolution than Fig.6D. First, we notice that the epidemiological settings displaying extreme values of transmission intensity, in the limits of low and high have more unique serotypes, that are not shared by other studies in the global dataset. For example, Iran and Ghana with together harbor 9 unique serotypes: ”19” ”6” ”23” ”10” ”23C” ”9” ”4B” (Iran), and ”15F” ”44” (Ghana) meanwhile Kenya with the highest value of () has 4 unique serotypes: ”47F” ”33D” ”25A” ”5B”. In general, other studies in the dataset share only about 24% of their serotypes with Iran, but about 40% of serotypes with Kenya. This pattern of higher serotype sharing with high-transmission scenarios and lower serotype sharing with low-transmission scenarios is persistent and significant even when considered in pairwise comparisons across the entire dataset, if studies are subdivided into low and high transmission sites, e.g. below and above the mean: (14 studies) and (6 studies), as illustrated in Figure 8.
Hence there are two phenomena to note in this final finding and relate with theory: i) sites with low are intrinsically prone to more stochasticity, because of lower overall prevalence of carriage, and hence larger demographic fluctuations should create variability in surviving serotypes, ii) sites with low are intrinsically increasingly characterized by multi-stability and hence could manifest sets of non-overlapping coexisting strains [21]. When low settings also have a low ratio of single to co-colonization (e.g. Iran), these two processes may act in synergy, amplifying the uniqueness and variability of coexisting serotypes. Similarly, high - high settings (e.g. Kenya) should show the opposite pattern: on one hand, high prevalence reduces demographic stochasticity, hence extinction probabilities, and thus allows more serotypes to survive, and high promotes also a larger number of serotypes coexisting because of the nature of their intrinsic coupling via mutual interactions in co-colonization [21].
Measuring pneumococcal co-colonization in natural host populations is challenging, and various methods exist with more research ongoing to optimize detection and quantification of multiple serotypes and strains [62, 63]. Existing estimates from different studies suggest large variation across geographic and demographic settings, but it is important to keep in mind that any isolated reports of co-colonization prevalence are not informative by themselves without the complete backdrop of single and total colonization prevalence. Beyond statistical approaches, a general mechanistic and simple enough epidemiological model is needed to interpret such numbers and make sense of their joint variation, providing them with biological and theoretical nuance. While full mechanistic characterization of all diversity found in pneumococcus may be an out-of-reach task, we propose that many features of the system and dynamics can be modelled and understood using the quasi-neutral SIS model with co-colonization and multiple interacting strains [20], and eventually, its more recent extensions and generalizations [64, 65, 66]. One attempt to apply such model to pneumococcus global epidemiological data has been made here, giving validation to the hypothesis that environmental adaptation drives pneumococcus co-colonization prevalence. Using this explicit modeling framework, many more qualitative and quantitative spectra of the dynamics of pneumococcus serotypes, including in response to antibiotics or vaccine pressure, could be modelled and investigated in the future.
IV. Discussion
Our work is intended first, as an initiative to develop an integrated understanding of pneumococcal co-colonization variation and its significance around the world, currently regarded as elusive, and secondly as a fresh exploration of the stress-gradient-hypothesis in a new mathematical and ecological context. There has been substantial research on pneumococcus competitive abilities in multiple colonization in recent years, and on quantifying the major, although not exclusive, role of capsular serotype for their determination as a bacterial phenotype [37, 67, 68, 69]. Yet, an ecological understanding and integration of all the findings is far from complete. To our knowledge, epidemiological surveys on the prevalence of co-colonization by multiple serotypes of pneumococcus have not been comparatively assessed and modelled, the focus having been mainly on describing trends in global invasive disease [27, 70] or patterns of antibiotic resistance variation [71, 72]. A few epidemiological modeling studies perform comparative analyses between a few countries to distinguish epidemiological parameters responsible for carriage differences or serotype replacement post-vaccination (e.g. [73, 11], although the need for making sense of differences in pneumococcal epidemiology across geographical settings is widely recognized [74, 75].
In this paper we address this challenge, comparing colonization and co-colonization rates in multiple epidemiological settings from different geographical locations, within the framework of a simple, yet general enough mathematical model [20], and linking these data to the ecological question of the stress-gradient-hypothesis [1]: Do pneumococcus competitive abilities, when viewed as a whole, vary with transmission intensity?
The SGH predicts that higher intensity of stress, in our case, lower overall carriage prevalence, should favour increased facilitation between ecological members of the communty, in our case higher susceptibility to co-colonization among serotypes, and viceversa, higher carriage prevalence should promote more competition and hence a lower susceptibility to co-colonization among serotypes. The -strain epidemiological model proposed by [20] makes this link entirely explicit, because it allows us to quantify these two parameters independently of each other, and interpret the SGH as a critical trade-off that preserves (mathematically and biologically) a given stability-diversity-complexity configuration in multi-strain coexistence [21].
By quantifying co-variation patterns between and across epidemiological settings, we found a signature of the stress gradient hypothesis in the global epidemiology of pneumococcus. Although there is variation in and across locations, these two epidemiological parameters inversely co-vary, giving rise to a conserved single to co-colonization ratio as predicted by the model [21], which for our data emerged to be 6.03 (95%CI: 3.56,10.21) close to the geometric mean of empirical single-to-cocolonization ratios reported globally. Furthermore, we demonstrated that even when stratifying the data further by , at higher resolution (e.g. two clusters of epidemiological settings, low and high ratio of single to co-colonization ( vs. ), or even three clusters as in Fig.S12) the same pattern of co-variation between and is preserved.
From our mathematical model’s simulations (Fig. 5 in [21] for ), in sites within the range of single to co-colonization ratios observed in this dataset (e.g. ), the probability of ‘no stable steady state’ coexistence exceeds 60% and is increasing with , while the probability of ‘a single stable steady state’ is only above 30% and decreasing, with only a very small chance of multi-stable coexistence among strains, hence suggesting that a likely natural mode of coexistence of pneumococcus serotypes worldwide may be oscillatory dynamics. That is perhaps, why we don’t find a clear signature of on the compositional variation across sites. Although compositional variation across local sites in terms of pneumococcus serotype sharing could be related to theoretical expectations on higher beta diversity in more productive environments [76], to disentangle the effect of (‘productivity’) from (under fixed ), one would need more representation of sites in the spectrum, where multi-stability is more likely. In that case, ‘moving’ horizontally from low to high (Fig. 5D), and crossing lines of decreasing (), we should expect to find higher compositional diversity across settings.
We found that our studies falling along the same line, i.e. satisfying the SGH, did not significantly differ in serotype composition, as measured by the Jaccard index, pointing to adaptation of the same set of serotypes by upregulation or downregulation of competitive abilities in different environments. The mechanisms of such adaptability could implicate other loci responsible for intra-host competition. Pneumococcus strains are known to express several quorum-sensing regulated factors that can kill other pneumococci not expressing cognate immunity factors. The blp locus encodes a family of bacteriocins (pneumocins), which have been shown to promote competitive interactions between different strains [77]. In addition, a separate quorum-sensing system causes lineage-independent killing of pneumococci (known as fratricide) that have not achieved the required population size for immune activation also regulated by this system [78].
Epidemiological studies by nature are observational, and involve strains that differ in many loci apart from the capsule. Thus, although we focus on serotype as the basic unit of diversity in multiple colonization, with the advantage of being able to capture and quantify the relevance of serotype differences in humans, we must keep in mind that a natural feature of the analyzed studies is further diversity underlying each serotype (different genetic backgrounds, strains differing in other loci, for example, antibiotic resistance determinants, blp locus, quorum-sensing, competence, horizontal transfer). Such hidden underlying diversity most likely plays a key role in the adaptability required for the ecological trade-off we uncover. A typical feature of the pneumococcal genome, evidenced by many studies [79, 80], is its plasticity, which facilitates this bacterium’s adaptation to changes in the environment, evolution by lateral gene transfer and recombination [81, 82], and has led to a large pangenome [83, 80].
While stress to the bacteria can come in many forms (antibiotics [84], availability of susceptible hosts, quality of susceptible hosts, transmission constraints, temperature and other climatic conditions [85]), its ultimate manifestation at the epidemiological level is in reducing the basic reproduction number , hence endemic prevalence of the pathogen in a given setting. Here, we have shown that despite the heterogeneity of the cross-sectional datasets, there is a consistent pattern of the bacteria increasing their co-colonization efficiency , hence tending towards more mutual facilitation and less competition, in response to stress. This upregulation of co-colonization susceptibility can be a survival-promoting mechanism in harsh environmental conditions, which allows the pneumococci to benefit from the co-presence of other pneumococci, e.g. by taking advantage of the high transformation efficiency during co-colonization by multiple strains [86]. Remarkably this trade-off pattern, mirroring also the stress-gradient hypothesis [1, 2], and preserving key qualitative features of multi-strain coexistence [21], holds across different human populations and continents and is not confined to a particular region.
On average our cocolonization studies display a similar serotype composition, with about 35% of reported serotypes shared between any two studies, which increases to 50% when measured at the serogroup level, and does not vary significantly in low vs. high ratio of single to co-colonization settings ( clusters). Even though we found some structure in terms of higher or lower mean Jaccard index within the big set of pairwise study comparisons (Figure S22), starting from Jaccard-index similarity, we did not find significant differences between epidemiological parameters among such clusters (Figure S23), supporting that serotype composition is not a primary driving factor in the country-wise differences. However, when starting from transmission intensity similarity, and considering the studies in terms of low and high , we found that sites with low share less serotypes than sites with high , suggesting that high transmission intensities, and hence levels of overall carriage prevalence, likely support more similar serotype coexistence.
Despite geography being a natural factor in the data set, since our studies reflect different populations, and environmental and climatic conditions, when searching for associations between geographic distances and epidemiology, the geographic distance analyses do not support a significant association with differences in epidemiology, e.g. at the level of countries in Europe vs. rest of the world ( comparisons in Fig.S24), and in general no significant association between () distances and geographical distance. However, we did find a significant, albeit weak, trend of lower serotype composition similarity (Jaccard index) with increasing physical distance between any two study locations (Fig.S25). This is similar to what has been found before in a study of sub-saharan Africa where close geographic proximity (km) between shared pneumococcus strains was associated with a significantly lower pairwise SNP distance compared to strains shared over longer distances [87]. Associations with geographic proximity would need to be explored model extensions that account explicitly for host movement and serotype transmission in space, and remains an interesting avenue for the future.
Our modelled dataset excluded certain studies which belonged to a longitudinal design (Finland [28], Peru [57], South Africa [29], Gambia [30]), and some cross-sectional studies that were deemed as outliers in our preliminary tests in Greece [23] and Venezuela-2 [22]. More recently, we became aware of some other very early studies, such as a study of co-colonization in Australian children [25] and in Papua New Guinea [26, 27], and another study that only recently came out on pneumococcus carriage patterns in Poland [24]. Reassuringly, when superimposing such studies, on our model-fitted data set, in terms of their and estimates (see Table S3 and Figure S26), we observe that the new cross-sectional studies do seem to fall within the same linear trend predicted by our model, consistent with the SGH, while the longitudinal studies seem to deviate more. Such deviation could be related to a higher frequency of repeated measurements in the same children in longitudinal studies, which could bias estimates.
An exciting avenue for the future would be to continue to gather new cross-sectional studies and examine their reports for single and co-colonization prevalence of pneumococcus serotypes under the same integrated modeling lens. Exploring differential adjustment in co-colonization efficiency in response to transmission intensity variation over time and space, possibly over smaller scales, (e.g. same country over different seasons) could also bring new information to the picture of pneumoccocus adaptation, similar to what has been observed for malaria parasites [92], where it was found that parasites increase their investment in transmission in the wet season, reflected by higher gametocyte densities, even though in the wet season, fewer infections harbored detectable gametocytes.
Other promising directions would be to dig deeper into patterns of serotype frequencies, dominance and variation in particular epidemiological and geographical settings, and link those to the features of equilibrium and non-equilibrium coexistence expected from the quasi-neutral SIS model with replicator dynamics at its core [20, 21]. While not all studies analyzed here report serotype frequencies, a few of them do, including Denmark [15], Iran [1], Brazil [6] and Mozambique [17], encompassing the spectrum from lower to higher ratios of single to co-colonization. Alternatively, one could try to revisit such data in light of more general macroecological laws that have been proposed to describe variation and diversity in microbial communities, based on the stochastic logistic model and environmental fluctuations [93]. Developing more standardized model-data links for inference and prediction, from a global standpoint or on a case-by-case basis, remains a challenge for a deeper understanding of pneumococcus diversity, coexistence dynamics and control.
V. Acknowledgement
This study was supported by the Portuguese Foundation for Science and Technology (FCT) in Lisbon, Portugal (grant number LISBOA-01-0145-FEDER-029161) and Instituto Superior Tecnico, via fellowship BL183/2021/IST-ID to ED. The Center for Stochastic and Computational Mathematics is supported by FCT via UIDB/04621/2020 and UIDP/04621/2020.
VI. Supplementary material (online)
S1: Data and notes on data collection, analysis and preparation.
S2: The full SIS mathematical model for co-colonization.
S3: Supplementary figures and tables.
References
- Bertness and Callaway [1994] Mark D Bertness and Ragan Callaway. Positive interactions in communities. Trends in ecology & evolution, 9(5):191–193, 1994.
- Callaway and Walker [1997] Ragan M Callaway and Lawrence R Walker. Competition and facilitation: a synthetic approach to interactions in plant communities. Ecology, 78(7):1958–1965, 1997.
- Chamberlain et al. [2014] Scott A Chamberlain, Judith L Bronstein, and Jennifer A Rudgers. How context dependent are species interactions? Ecology letters, 17(7):881–890, 2014.
- Pugnaire and Luque [2001] Francisco I Pugnaire and Maria T Luque. Changes in plant interactions along a gradient of environmental stress. Oikos, 93(1):42–49, 2001.
- Callaway et al. [2002] Ragan M Callaway, RW Brooker, Philippe Choler, Zaal Kikvidze, Christopher J Lortie, Richard Michalet, Leonardo Paolini, Francisco I Pugnaire, Beth Newingham, Erik T Aschehoug, et al. Positive interactions among alpine plants increase with stress. Nature, 417(6891):844–848, 2002.
- Eränen and Kozlov [2008] Janne K Eränen and Mikhail V Kozlov. Increasing intraspecific facilitation in exposed environments: consistent results from mountain birch populations in two subarctic stress gradients. Oikos, 117(10):1569–1577, 2008.
- Maestre et al. [2009] Fernando T Maestre, Ragan M Callaway, Fernando Valladares, and Christopher J Lortie. Refining the stress-gradient hypothesis for competition and facilitation in plant communities. Journal of Ecology, 97(2):199–205, 2009.
- He et al. [2013] Qiang He, Mark D Bertness, and Andrew H Altieri. Global shifts towards positive species interactions with increasing environmental stress. Ecology letters, 16(5):695–706, 2013.
- McCluney et al. [2012] Kevin E McCluney, Jayne Belnap, Scott L Collins, Angélica L González, Elizabeth M Hagen, J Nathaniel Holland, Burt P Kotler, Fernando T Maestre, Stanley D Smith, and Blair O Wolf. Shifting species interactions in terrestrial dryland ecosystems under altered water availability and climate change. Biological Reviews, 87(3):563–582, 2012.
- Fetzer et al. [2015] Ingo Fetzer, Karin Johst, Robert Schäwe, Thomas Banitz, Hauke Harms, and Antonis Chatzinotas. The extent of functional redundancy changes as species? roles shift in different environments. Proceedings of the National Academy of Sciences, 112(48):14888–14893, 2015.
- Hoek et al. [2016] Tim A Hoek, Kevin Axelrod, Tommaso Biancalani, Eugene A Yurtsev, Jinghui Liu, and Jeff Gore. Resource availability modulates the cooperative and competitive nature of a microbial cross-feeding mutualism. PLoS biology, 14(8), 2016.
- Lawrence and Barraclough [2016] Diane Lawrence and Timothy G Barraclough. Evolution of resource use along a gradient of stress leads to increased facilitation. Oikos, 125(9):1284–1295, 2016.
- Piccardi et al. [2019] Philippe Piccardi, Björn Vessman, and Sara Mitri. Toxicity drives facilitation between 4 bacterial species. Proceedings of the National Academy of Sciences, 116(32):15979–15984, 2019.
- Connell [1978] Joseph H Connell. Diversity in tropical rain forests and coral reefs: high diversity of trees and corals is maintained only in a nonequilibrium state. Science, 199(4335):1302–1310, 1978.
- Grime [1973] John Philip Grime. Competitive exclusion in herbaceous vegetation. Nature, 242(5396):344–347, 1973.
- Chesson [1994] Peter Chesson. Multispecies competition in variable environments. Theoretical population biology, 45(3):227–276, 1994.
- Mougi and Kondoh [2012] Akihiko Mougi and Michio Kondoh. Diversity of interaction types and ecological community stability. Science, 337(6092):349–351, 2012.
- Butler and O ’Dwyer [2020] Stacey Butler and James P ODwyer. Cooperation and stability for complex systems in resource-limited environments. Theoretical Ecology, 13(2):239–250, 2020.
- Balmer and Tanner [2011] Oliver Balmer and Marcel Tanner. Prevalence and implications of multiple-strain infections. The Lancet infectious diseases, 11(11):868–878, 2011.
- Griffiths et al. [2011] Emily C Griffiths, Amy B Pedersen, Andy Fenton, and Owen L Petchey. The nature and consequences of coinfection in humans. Journal of Infection, 63(3):200–206, 2011.
- May and Nowak [1995] Robert M May and Martin A Nowak. Coinfection and the evolution of parasite virulence. Proceedings of the Royal Society of London. Series B: Biological Sciences, 261(1361):209–215, 1995.
- Mosquera and Adler [1998] Javier Mosquera and Frederick R Adler. Evolution of virulence: a unified framework for coinfection and superinfection. Journal of Theoretical Biology, 195(3):293–313, 1998.
- Alizon et al. [2013] Samuel Alizon, Jacobus C de Roode, and Yannis Michalakis. Multiple infections and the evolution of virulence. Ecology letters, 16(4):556–567, 2013.
- Madec and Gjini [2020] Sten Madec and Erida Gjini. Predicting n-strain coexistence from co-colonization interactions: epidemiology meets ecology and the replicator equation. Bulletin of Mathematical Biology, 82(142), 2020. doi: https://doi.org/10.1007/s11538-020-00816-w.
- Gjini and Madec [2021] Erida Gjini and Sten Madec. The ratio of single to co-colonization is key to complexity in interacting systems with multiple strains. Ecology and Evolution, 11(13):8456–8474, 2021. doi: https://doi.org/10.1002/ece3.7259.
- Bogaert et al. [2004] Debby Bogaert, Ronald de Groot, and PWM Hermans. Streptococcus pneumoniae colonisation: the key to pneumococcal disease. The Lancet infectious diseases, 4(3):144–154, 2004.
- O’brien et al. [2009] Katherine L O’brien, Lara J Wolfson, James P Watt, Emily Henkle, Maria Deloria-Knoll, Natalie McCall, Ellen Lee, Kim Mulholland, Orin S Levine, Thomas Cherian, et al. Burden of disease caused by streptococcus pneumoniae in children younger than 5 years: global estimates. The Lancet, 374(9693):893–902, 2009.
- Brugger et al. [2009] Silvio D Brugger, Lucy J Hathaway, and Kathrin Mulhlemann. Detection of streptococcus pneumoniae strain cocolonization in the nasopharynx. Journal of clinical microbiology, 47(6):1750–1756, 2009.
- Geno et al. [2015] K Aaron Geno, Gwendolyn L Gilbert, Joon Young Song, Ian C Skovsted, Keith P Klugman, Christopher Jones, Helle B Konradsen, and Moon H Nahm. Pneumococcal capsules and their types: past, present, and future. Clinical microbiology reviews, 28(3):871–899, 2015.
- Libwea et al. [2020] John Njuma Libwea, Kirsi Gröndahl-Yli-Hannuksela, Marie Kobela, Maija Toropainen, Outi Nyholm, Paul Koki Ndombo, Sinata Koulla-Shiro, Hanna Nohynek, J Pekka Nuorti, Jaana Vuopio, et al. Prevalence of pneumococcal nasopharyngeal colonization and serotypes circulating in cameroonian children after the 13-valent pneumococcal conjugate vaccine introduction. International Journal of Infectious Diseases, 98:113–120, 2020.
- Rivera-Olivero et al. [2009] Ismar A Rivera-Olivero, Martijn Blommaart, Debby Bogaert, Peter WM Hermans, and Jacobus H de Waard. Multiplex pcr reveals a high rate of nasopharyngeal pneumococcal 7-valent conjugate vaccine serotypes co-colonizing indigenous warao children in venezuela. Journal of medical microbiology, 58(5):584–587, 2009.
- Ercibengoa et al. [2012] María Ercibengoa, Nerea Arostegi, José M Marimón, Marta Alonso, and Emilio Pérez-Trallero. Dynamics of pneumococcal nasopharyngeal carriage in healthy children attending a day care center in northern spain. influence of detection techniques on the results. BMC infectious diseases, 12(1):1–8, 2012.
- Yoshino et al. [2008] Yoshimi Yoshino, Tobias Galla, and Kei Tokita. Rank abundance relations in evolutionary dynamics of random replicators. Phys. Rev. E, 78:031924, Sep 2008. doi: 10.1103/PhysRevE.78.031924. URL https://link.aps.org/doi/10.1103/PhysRevE.78.031924.
- Allesina and Levine [2011] Stefano Allesina and Jonathan M. Levine. A competitive network theory of species diversity. Proceedings of the National Academy of Sciences, 108(14):5638–5642, 2011. ISSN 0027-8424. doi: 10.1073/pnas.1014428108. URL https://www.pnas.org/content/108/14/5638.
- Auranen et al. [2010] Kari Auranen, Juha Mehtälä, Antti Tanskanen, and Margit S. Kaltoft. Between-strain competition in acquisition and clearance of pneumococcal carriage?epidemiologic evidence from a longitudinal study of day-care children. American journal of epidemiology, 171(2):169–176, 2010.
- Numminen et al. [2013] Elina Numminen, Lu Cheng, Mats Gyllenberg, and Jukka Corander. Estimating the transmission dynamics of streptococcus pneumoniae from strain prevalence data. Biometrics, 69(3):748–757, 2013.
- Lipsitch et al. [2012] Marc Lipsitch, Osman Abdullahi, Alexander D’Amour, Wen Xie, Daniel M Weinberger, Eric Tchetgen Tchetgen, and J Anthony G Scott. Estimating rates of carriage acquisition and clearance and competitive ability for pneumococcal serotypes in kenya with a markov transition model. Epidemiology (Cambridge, Mass.), 23(4):510, 2012.
- Gjini et al. [2016] Erida Gjini, Carina Valente, Raquel Sa-Leao, and M Gabriela M Gomes. How direct competition shapes coexistence and vaccine effects in multi-strain pathogen systems. Journal of Theoretical Biology, 388:50–60, 2016.
- Syrogiannopoulos et al. [2002] George A Syrogiannopoulos, George D Katopodis, Ioanna N Grivea, and Nicholas G Beratis. Antimicrobial use and serotype distribution of nasopharyngeal streptococcus pneumoniae isolates recovered from greek children younger than 2 years old. Clinical infectious diseases, 35(10):1174–1182, 2002.
- Rivera-Olivero et al. [2011] Ismar A Rivera-Olivero, Berenice del Nogal, María Carolina Sisco, Debby Bogaert, Peter WM Hermans, and Jacobus H de Waard. Carriage and invasive isolates of streptococcus pneumoniae in caracas, venezuela: the relative invasiveness of serotypes and vaccine coverage. European journal of clinical microbiology & infectious diseases, 30(12):1489–1495, 2011.
- Tabatabaei et al. [2014] S Rafiei Tabatabaei, F Fallah, F Shiva, AR Shamshiri, M Hajia, M Navidinia, A Karimi, and M Rahbar. Multiplex pcr assay for detection of pneumococcal serotypes in nasopharyngeal samples of healthy children; tehran, 2009-2010. Annual Research & Review in Biology, pages 3780–3790, 2014.
- Hjálmarsdóttir et al. [2016] Martha Á Hjálmarsdóttir, Pálína Fanney Gumundsdóttir, Helga Erlendsdóttir, Karl G Kristinsson, and Gunnsteinn Haraldsson. Cocolonization of pneumococcal serotypes in healthy children attending day care centers: molecular versus conventional methods. The Pediatric infectious disease journal, 35(5):477–480, 2016.
- Wyllie et al. [2016] Anne L Wyllie, Alienke J Wijmenga-Monsuur, Marlies A van Houten, Astrid ATM Bosch, James A Groot, Jody van Engelsdorp Gastelaars, Jacob P Bruin, Debby Bogaert, Nynke Y Rots, Elisabeth AM Sanders, et al. Molecular surveillance of nasopharyngeal carriage of streptococcus pneumoniae in children vaccinated with conjugated polysaccharide pneumococcal vaccines. Scientific reports, 6(1):1–9, 2016.
- Saha et al. [2015] Sudipta Saha, Joyanta K Modak, Hakka Naziat, Hassan M Al-Emran, Mrittika Chowdury, Maksuda Islam, Belal Hossain, Gary L Darmstadt, Cynthia G Whitney, and Samir K Saha. Detection of co-colonization with streptococcus pneumoniae by algorithmic use of conventional and molecular methods. Vaccine, 33(5):713–718, 2015.
- Kandasamy et al. [2015] Rama Kandasamy, Meeru Gurung, Anushil Thapa, Susan Ndimah, Neelam Adhikari, David R Murdoch, Dominic F Kelly, Denise E Waldron, Katherine A Gould, Stephen Thorson, et al. Multi-serotype pneumococcal nasopharyngeal carriage prevalence in vaccine naive nepalese children, assessed using molecular serotyping. PloS one, 10(2):e0114286, 2015.
- Valente et al. [2012] Carina Valente, Jason Hinds, Francisco Pinto, Silvio D Brugger, Katherine Gould, Kathrin Mühlemann, Hermínia de Lencastre, and Raquel Sá-Leão. Decrease in pneumococcal co-colonization following vaccination with the seven-valent pneumococcal conjugate vaccine. PloS one, 7(1):e30235, 2012.
- Sá-Leão et al. [2009] R Sá-Leão, S Nunes, A Brito-Avô, N Frazao, AS Simoes, MI Crisostomo, ACS Paulo, J Saldanha, I Santos-Sanches, and H De Lencastre. Changes in pneumococcal serotypes and antibiotypes carried by vaccinated and unvaccinated day-care centre attendees in portugal, a country with widespread use of the seven-valent pneumococcal conjugate vaccine. Clinical microbiology and infection, 15(11):1002–1007, 2009.
- Vestrheim et al. [2010] Didrik F Vestrheim, E Arne Høiby, Ingeborg S Aaberge, and Dominique A Caugant. Impact of a pneumococcal conjugate vaccination program on carriage among children in norway. Clinical and Vaccine Immunology, 17(3):325–334, 2010.
- Sutcliffe et al. [2019] Catherine G Sutcliffe, Anita Shet, Rosemol Varghese, Balaji Veeraraghavan, Anand Manoharan, Brian Wahl, Sara Chandy, Jack Sternal, Raziuddin Khan, Rakesh Kumar Singh, et al. Nasopharyngeal carriage of streptococcus pneumoniae serotypes among children in india prior to the introduction of pneumococcal conjugate vaccines: a cross-sectional study. BMC infectious diseases, 19(1):1–12, 2019.
- Rodrigues et al. [2017] HG Rodrigues, TCA Pinto, RR Barros, LM Teixeira, and FPG Neves. Pneumococcal nasopharyngeal carriage among children in brazil prior to the introduction of the 10-valent conjugate vaccine: a culture-and pcr-based survey. Epidemiology & Infection, 145(8):1720–1726, 2017.
- Harboe et al. [2012] Zitta B Harboe, Hans-Christian Slotved, Helle B Konradsen, and Margit S Kaltoft. A pneumococcal carriage study in danish pre-school children before the introduction of pneumococcal conjugate vaccination. The open microbiology journal, 6:40, 2012.
- Dhoubhadel et al. [2014] Bhim Gopal Dhoubhadel, Michio Yasunami, Hien Anh Thi Nguyen, Motoi Suzuki, Thu Huong Vu, Ai Thi Thuy Nguyen, Duc Anh Dang, Lay-Myint Yoshida, and Koya Ariyoshi. Bacterial load of pneumococcal serotypes correlates with their prevalence and multiple serotypes is associated with acute respiratory infections among children less than 5 years of age. PloS one, 9(10):e110777, 2014.
- Adebanjo et al. [2018] Tolulope Adebanjo, Fernanda C Lessa, Helio Mucavele, Benild Moiane, Alberto Chauque, Fabiana Pimenta, Sergio Massora, Maria da Gloria Carvalho, Cynthia G Whitney, and Betuel Sigauque. Pneumococcal carriage and serotype distribution among children with and without pneumonia in mozambique, 2014-2016. PloS one, 13(6):e0199363, 2018.
- Dayie et al. [2013] Nicholas TKD Dayie, Reuben E Arhin, Mercy J Newman, Anders Dalsgaard, Magne Bisgaard, Niels Frimodt-Møller, and Hans-Christian Slotved. Penicillin resistance and serotype distribution of streptococcus pneumoniae in ghanaian children less than six years of age. BMC infectious diseases, 13(1):1–7, 2013.
- Kobayashi et al. [2017] Miwako Kobayashi, Laura M Conklin, Godfrey Bigogo, Geofrey Jagero, Lee Hampton, Katherine E Fleming-Dutra, Muthoni Junghae, Maria da Gloria Carvalho, Fabiana Pimenta, Bernard Beall, et al. Pneumococcal carriage and antibiotic susceptibility patterns from two cross-sectional colonization surveys among children aged 5 years prior to the introduction of 10-valent pneumococcal conjugate vaccine—kenya, 2009–2010. BMC infectious diseases, 17(1):1–12, 2017.
- Syrjänen et al. [2001] Ritva K Syrjänen, Terhi M Kilpi, Tarja H Kaijalainen, Elja E Herva, and Aino K Takala. Nasopharyngeal carriage of streptococcus pneumoniae in finnish children younger than 2 years old. The Journal of infectious diseases, 184(4):451–459, 2001.
- Nelson et al. [2018] Kristin N Nelson, Carlos G Grijalva, Sopio Chochua, Paulina A Hawkins, Ana I Gil, Claudio F Lanata, Marie R Griffin, Kathryn M Edwards, Keith P Klugman, and Jorge E Vidal. Dynamics of colonization of streptococcus pneumoniae strains in healthy peruvian children. In Open forum infectious diseases, volume 5 (3), page ofy039. Oxford University Press US, 2018.
- Manenzhe et al. [2020] Rendani I Manenzhe, Felix S Dube, Meredith Wright, Katie Lennard, Stephanie Mounaud, Stephanie W Lo, Heather J Zar, William C Nierman, Mark P Nicol, and Clinton Moodley. Characterization of pneumococcal colonization dynamics and antimicrobial resistance using shotgun metagenomic sequencing in intensively sampled south african infants. Frontiers in public health, page 543, 2020.
- Chaguza et al. [2021] Chrispin Chaguza, Madikay Senghore, Ebrima Bojang, Stephanie W Lo, Chinelo Ebruke, Rebecca A Gladstone, Peggy-Estelle Tientcheu, Rowan E Bancroft, Archibald Worwui, Ebenezer Foster-Nyarko, et al. Carriage dynamics of pneumococcal serotypes in naturally colonized infants in a rural african setting during the first year of life. Frontiers in pediatrics, 8:898, 2021.
- Gu et al. [2014] Zuguang Gu, Lei Gu, Roland Eils, Matthias Schlesner, and Benedikt Brors. circlize implements and enhances circular visualization in r. Bioinformatics, 30:2811–2812, 2014.
- Gjini [2017] Erida Gjini. Geographic variation in pneumococcal vaccine efficacy estimated from dynamic modeling of epidemiological data post-pcv7. Scientific Reports, 7(1):1–16, 2017.
- Shak et al. [2013] Joshua R Shak, Jorge E Vidal, and Keith P Klugman. Influence of bacterial interactions on pneumococcal colonization of the nasopharynx. Trends in microbiology, 21(3):129–135, 2013.
- Leung et al. [2012] Marcus H Leung, Kevin Bryson, Kathrin Freystatter, Bruno Pichon, Giles Edwards, Bambos M Charalambous, and Stephen H Gillespie. Sequetyping: serotyping streptococcus pneumoniae by a single pcr sequencing strategy. Journal of clinical microbiology, 50(7):2419–2427, 2012.
- Le et al. [2021] Thi Minh Thao Le, Erida Gjini, and Sten Madec. Quasi-neutral dynamics in a coinfection system with n strains and asymmetries along multiple traits. arXiv preprint arXiv:2104.07289, 2021.
- Le et al. [2022] Thi Minh Thao Le, Sten Madec, and Erida Gjini. Disentangling how multiple traits drive 2 strain frequencies in sis dynamics with coinfection. Journal of Theoretical Biology, 538:111041, 2022.
- Le and Madec [2021] Thi Minh Thao Le and Sten Madec. A reaction-advection-diffusion model for quasi-neutral dynamics of coinfecting strains. HAL preprint hal-03467201, 2021. URL https://hal.archives-ouvertes.fr/hal-03467201.
- Trzciński et al. [2015] Krzysztof Trzciński, Yuan Li, Daniel M Weinberger, Claudette M Thompson, Derrick Cordy, Andrew Bessolo, Richard Malley, and Marc Lipsitch. Effect of serotype on pneumococcal competition in a mouse colonization model. MBio, 6(5):e00902–15, 2015.
- Weiser et al. [2018] Jeffrey N Weiser, Daniela M Ferreira, and James C Paton. Streptococcus pneumoniae: transmission, colonization and invasion. Nature Reviews Microbiology, 16(6):355–367, 2018.
- Abruzzo et al. [2022] Annie R Abruzzo, Surya D Aggarwal, Molly E Sharp, Gavyn Chern Wei Bee, and Jeffrey N Weiser. Serotype-dependent effects on the dynamics of pneumococcal colonization and implications for transmission. Mbio, pages e00158–22, 2022.
- Song et al. [2013] Joon Young Song, Moon H Nahm, and M Allen Moseley. Clinical implications of pneumococcal serotypes: invasive disease potential, clinical presentations, and antibiotic resistance. Journal of Korean medical science, 28(1):4–15, 2013.
- Reinert et al. [2005] Ralf René Reinert, Susanne Reinert, Mark van der Linden, Murat Y Cil, Adnan Al-Lahham, and Peter Appelbaum. Antimicrobial susceptibility of streptococcus pneumoniae in eight european countries from 2001 to 2003. Antimicrobial agents and chemotherapy, 49(7):2903–2913, 2005.
- Davies et al. [2019] Nicholas G Davies, Stefan Flasche, Mark Jit, and Katherine E Atkins. Within-host dynamics shape antibiotic resistance in commensal bacteria. Nature ecology & evolution, 3(3):440–449, 2019.
- Pessoa et al. [2013] Delphine Pessoa, Fabian Hoti, Ritva Syrjänen, Raquel Sá-Leão, Tarja Kaijalainen, M Gabriela M Gomes, and Kari Auranen. Comparative analysis of streptococcus pneumoniaetransmission in portuguese and finnish day-care centres. BMC Infectious Diseases, 13(1):1–13, 2013.
- Chan et al. [2019] Jocelyn Chan, Cattram D Nguyen, Eileen M Dunne, E Kim Mulholland, Tuya Mungun, William S Pomat, Eric Rafai, Catherine Satzke, Daniel M Weinberger, and Fiona M Russell. Using pneumococcal carriage studies to monitor vaccine impact in low-and middle-income countries. Vaccine, 37(43):6299–6309, 2019.
- Lewnard and Hanage [2019] Joseph A Lewnard and William P Hanage. Making sense of differences in pneumococcal serotype replacement. The Lancet Infectious Diseases, 19(6):e213–e220, 2019.
- Chase [2010] Jonathan M Chase. Stochastic community assembly causes higher biodiversity in more productive environments. Science, 328(5984):1388–1391, 2010.
- Wholey et al. [2019] Wei-Yun Wholey, Maha Abu-Khdeir, Emily A Yu, Saher Siddiqui, Ogenna Esimai, and Suzanne Dawid. Characterization of the competitive pneumocin peptides of streptococcus pneumoniae. Frontiers in cellular and infection microbiology, 9:55, 2019.
- Claverys et al. [2007] Jean-Pierre Claverys, Bernard Martin, and Leiv Sigve Håvarstein. Competence-induced fratricide in streptococci. Molecular microbiology, 64(6):1423–1433, 2007.
- Claverys et al. [2000] Jean-Pierre Claverys, Marc Prudhomme, Isabelle Mortier-Barrière, and Bernard Martin. Adaptation to the environment: Streptococcus pneumoniae, a paradigm for recombination-mediated genetic plasticity? Molecular microbiology, 35(2):251–259, 2000.
- Straume et al. [2015] Daniel Straume, Gro Anita Stamsås, and Leiv Sigve Håvarstein. Natural transformation and genome evolution in streptococcus pneumoniae. Infection, Genetics and Evolution, 33:371–380, 2015.
- Mortier-Barrière et al. [2007] Isabelle Mortier-Barrière, Marion Velten, Pauline Dupaigne, Nicolas Mirouze, Olivier Piétrement, Stephen McGovern, Gwennaele Fichant, Bernard Martin, Philippe Noirot, Eric Le Cam, et al. A key presynaptic role in transformation for a widespread bacterial protein: Dpra conveys incoming ssdna to reca. Cell, 130(5):824–836, 2007.
- Brückner et al. [2004] Reinhold Brückner, Michael Nuhn, Peter Reichmann, Beate Weber, and Regine Hakenbeck. Mosaic genes and mosaic chromosomes–genomic variation in streptococcus pneumoniae. International journal of medical microbiology, 294(2-3):157–168, 2004.
- Hiller et al. [2007] N Luisa Hiller, Benjamin Janto, Justin S Hogg, Robert Boissy, Susan Yu, Evan Powell, Randy Keefe, Nathan E Ehrlich, Kai Shen, Jay Hayes, et al. Comparative genomic analyses of seventeen streptococcus pneumoniae strains: insights into the pneumococcal supragenome, 2007.
- Mitchell et al. [2015] Patrick K Mitchell, Marc Lipsitch, and William P Hanage. Carriage burden, multiple colonization and antibiotic pressure promote emergence of resistant vaccine escape pneumococci. Philosophical Transactions of the Royal Society B: Biological Sciences, 370(1670):20140342, 2015.
- de Cellès et al. [2019] Matthieu Domenech de Cellès, Hélène Arduin, Daniel Lévy-Bruhl, Scarlett Georges, Cécile Souty, Didier Guillemot, Laurence Watier, and Lulla Opatowski. Unraveling the seasonal epidemiology of pneumococcus. Proceedings of the National Academy of Sciences, 116(5):1802–1807, 2019.
- Marks et al. [2012] Laura R Marks, Ryan M Reddinger, and Anders P Hakansson. High levels of genetic recombination during nasopharyngeal carriage and biofilm formation in streptococcus pneumoniae. MBio, 3(5):e00200–12, 2012.
- Senghore et al. [2022] Madikay Senghore, Chrispin Chaguza, Ebrima Bojang, Peggy-Estelle Tientcheu, Rowan E Bancroft, Stephanie W Lo, Rebecca A Gladstone, Lesley McGee, Archibald Worwui, Ebenezer Foster-Nyarko, et al. Widespread sharing of pneumococcal strains in a rural african setting: proximate villages are more likely to share similar strains that are carried at multiple timepoints. Microbial genomics, 8(2), 2022.
- Hansman et al. [1985] D Hansman, S Morris, M Gregory, and B McDonald. Pneumococcal carriage amongst australian aborigines in alice springs, northern territory. Epidemiology & Infection, 95(3):677–684, 1985.
- Gratten et al. [1989] M Gratten, J Montgomery, G Gerega, H Gratten, H Siwi, A Poli, and G Koki. Multiple colonization of the upper respiratory tract of papua new guinea children with haemophilus influenzae and streptococcus pneumoniae. The Southeast Asian journal of tropical medicine and public health, 20(4):501–509, 1989.
- Montgomery et al. [1990] Janet M Montgomery, Deborah Lehmann, Tom Smith, Audrey Michael, Benetty Joseph, Tony Lupin, Christine Coakley, Veronica Spooner, Bronwyn Best, Ian D Riley, et al. Bacterial colonization of tbe upper respiratory tract and its association witb acute lower respiratory tract infections in higbland cbildren of papua new guinea. Reviews of Infectious Diseases, 12(Supplement_8):S1006–S1016, 1990.
- Wróbel-Pawelczyk et al. [2022] Izabela Wróbel-Pawelczyk, Patrycja Ronkiewicz, Monika Wanke-Rytt, Dominika Rykowska, Aneta Górska-Kot, Katarzyna Włodkowska, Agnieszka Topczewska-Cabanek, Teresa Jackowska, Joanna Chruszcz, Walentyna Marchut, et al. Pneumococcal carriage in unvaccinated children at the time of vaccine implementation into the national immunization program in poland. Scientific Reports, 12(1):1–11, 2022.
- Oduma et al. [2021] Colins O Oduma, Sidney Ogolla, Harrysone Atieli, Bartholomew N Ondigo, Ming-Chieh Lee, Andrew K Githeko, Arlene E Dent, James W Kazura, Guiyun Yan, and Cristian Koepfli. Increased investment in gametocytes in asymptomatic plasmodium falciparum infections in the wet season. BMC infectious diseases, 21(1):1–10, 2021.
- Grilli [2020] Jacopo Grilli. Macroecological laws describe variation and diversity in microbial communities. Nature communications, 11(1):1–11, 2020.
Supplementary material
Pneumococcus and the stress-gradient hypothesis: a trade-off links and susceptibility to co-colonization across countries
Ermanda Dekaj 1,†, Erida Gjini 1,∗
Center for Computational and Stochastic Mathematics, Instituto Superior Tecnico, University of Lisbon, Lisbon, Portugal
†ermanda.dekaj@tecnico.ulisboa.pt,∗ Corresponding: erida.gjini@tecnico.ulisboa.pt
S1. Notes on data analysis and code availability
Data Collection Characteristics of table 1
The summary of the reported values for epidemiological quantities of pneumococcal colonization and co-colonization can be found in the Table 1. More extensive details are found in the Supplementary Data file: .
The Iran study [1] reports rates for T, D and sample size , from where we calculate I. They report the total number of serotypes they detected (30). We get the information from table 3 of the article [1].
In the Spain study [2], 25 children were sampled three times, 53 children twice and 27 children once, over 12 months. We use the rate they report for colonized children from the total of 105. They report 21 serotypes, as many as they detected. We get the information from table 2 of the article [2].
In the Venezuela-1 study [3], they reported 50 primary cultures from the nasopharyngeal swabs of healthy Warao-Amerindian children. They report serotypes detected on multiple carriers in Table 1 of the article [3]. These are the serotypes we include in our serotype composition data for this setting. Venezuela-1 and Venezuela-2 report the rates from children in Warao and Caracas city respectively.
In the Iceland study [4] they compare two methods for detecting multiple carriage: 1) conventional and 2) molecular, whose results we keep in our meta-analysis as Iceland-1 and Iceland-2 respectively. We split this study in two, because they do not report a final single value for overall co-colonization percentage. In contrast, other studies, e.g. Netherlands [5] and Brazil [6], also compare two and three methods respectively, but they do report the overall percentage, which we then include as a single value in our metadata.
In the Netherlands study [5], the number of carriers of multiple serotypes of Streptococcus pneumoniae os reported via both methods molecular and conventional. We get the overall rate as reported in the study by consideration of both methods. They report serotypes as 6A/6B, and we consider them as two serotypes 6A and 6B for our analysis. They report pneumococcal serotypes detected only by the conventional method in all 803 carriers of pneumococci and we retrieve the overall number of serotype strains detected by conventional culture and serotype-specific signals detected by molecular method (qPCR), among all infants identified as carriers of S. pneumoniae by either method used in the study.
In the Bangladesh study [7], they report multiple serotypes carried from some of the nasal swabs of the children carrying pneumococcus. We calculate the expected proportions of single and double co-colonization while maintaining the rates of I and D reported for those samples analyzed carrying pneumococcus. In the Bangladesh study, the samples were collected in a government housing area.
In the Nepal study [8], they report the colonization and co-colonization rates for typable pneumococci.
In the Portugal study [9] [10] the prevalence of pneumococcus carriage is reported for 2001 (before the vaccine introduction) and in 2006 (after vaccine introduction where most of hosts are vaccinated). Since Valente et al. [9] chose only a subset of the samples carrying pneumococci for analysis of multiple carriage, we extrapolate the calculations for all children in their overall sample, by preserving the same percentages of single and double colonization. We have coded Portugal-1 as the epidemiological setting before PCV7 vaccine introduction, and Portugal-2 as the data in the post-vaccine era, where most of the children are vaccinated. These data were also used in previous modeling studies [11]. Serotypes of Portugal-1 and Portugal-2 were retrieved from [9].
In the Norway study [12], the authors report the rate for single and double colonization. Norway-1 corresponds to non-vaccinated children in 2006 and Norway-2 to vaccinated children in 2008. Serotypes were retrieved from the table reported in article for both periods respectively. These data have also been used in a previous modeling study [11].
Similarly the India study [13] reports single and double colonization with S. pneumoniae serotypes, before vaccine introduction, with the samples collected in December 2016 to July 2017, from healthy community children. Children in the community were enrolled from one of the primary care clinics, the immunization clinic at the district hospital, and several (daycare) centers. Serotypes are taken from figure 1 of the article.
In the Switzerland study [14], they report colonization rates and co-colonization rates according to some of positive samples carrying pneumococci. Data belong to a wider nationwide surveillance program. We perform the calculations for expectations regarding the epidemiological status of all children in the big sample size, while maintaining the same colonization and co-colonization rates detected in the subset of samples analyzed, by the PCR method. Children attending and not attending day-care were part of the sample, with co-colonization not being associated with more often attending day care.
In studies from Brazil [6], Denmark [15], Vietnam [16], we obtained the rates they reported for colonization and co-colonization, and serotypes from the text. 57% of samples in Brazil study were collected in one hospital and the others from one childcare centre.
In the Mozambique study [17] they reported the rates of colonization and co-colonization, for children with and without pneumonia. We included in our metadata just the rates reported for children without pneumonia. They report the dataset for all serotypes detected.
In the Ghana study [18] they reported the overall rates for colonization and co-colonization collecting data from two cities Accra and Tamale. In the Ghana study, children were attending nurseries and kindergartens.
In the Kenya study [19] the serotypes were retrieved from the text and from the additional supplementary material accompanying the paper.
Data file 2
Serotypes reported in each study and statistics of occurrence/co-occurrence, and rankings in the global dataset. This file presented with a matrix is used to analyse the occurrence/co-occurrence of serotypes among different countries. Each row corresponds to a specific serotype and their co-occurrences with other serotypes. In the diagonal we report the number of studies each serotype was reported. We use these data for ChordDiagram visualizations and all analyses regarding serotype composition similarity across studies. File:
S2. The full SIS mathematical model for co-colonization dynamics and strains
We apply a model for epidemiological transmission of strains, following Susceptible-Infected-Susceptible dynamics, with coinfection, described in detail in [20]. The variables are: , and , referring respectively to the proportion of uncolonized hosts, those singly-colonized by strain and those co-colonized by strains and . How these variables change over time is given by the following system of ordinary differential equations:
| (5) | |||||
| (6) | |||||
| (7) |
where gives the force of infection of strain in the system, summing the contribution of all hosts transmitting that strain, at transmission rate . Using , the dimension of the system is effectively . Co-colonized hosts with strains and , transmit either with equal probability 1/2. In the system, the parameter , depicts infected host turnover rate, summing the effects of both the clearance rate of colonization episodes and the recruitment rate of susceptibles . Susceptible birth rate is assumed equal to natural mortality rate.
Upon co-colonization, strains can interact with each-other, and such pairwise coefficients are represented by the matrix , where values above 1 indicate pairwise facilitation, while values of below 1 reflect competition in co-colonization between and , namely a prior colonization by strain reduces the susceptibility of the host to co-colonization by strain . In [20], a slow-fast timescale decomposition of the dynamics has been derived, assuming strain similarity in co-colonization interaction coefficients. Mathematically we have:
where is small (), and is a convenient reference, e.g. the mean of : . This yields a normalized interaction matrix
with the same distribution as , but with mean 0 and variance 1 (if is taken to be the standard deviation of ), at the start of dynamics.
With this formulation, the -strain frequency dynamics are neutral over the fast timescale but over the slow timescale are captured by the replicator system:
where denote pairwise invasion fitnesses between any two strains, and gives the speed of the dynamics. The fast variables instead, are the total prevalence of susceptible hosts , singly-colonized hosts , and co-colonized hosts , which reach their equilibrium on the fast timescale and stay constant over the slow-timescale (see [20, 21]). It is the analytic expression for this endemic equilibrium that forms the basis of the parameter estimation () in this paper.
S3. Supplementary figures
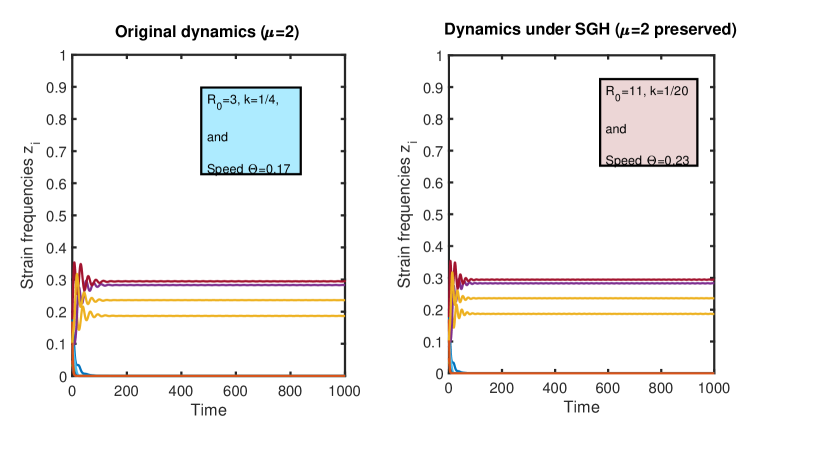
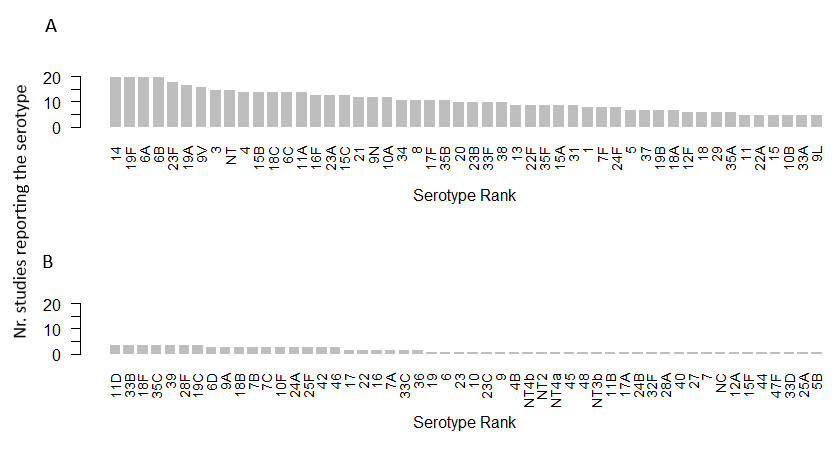
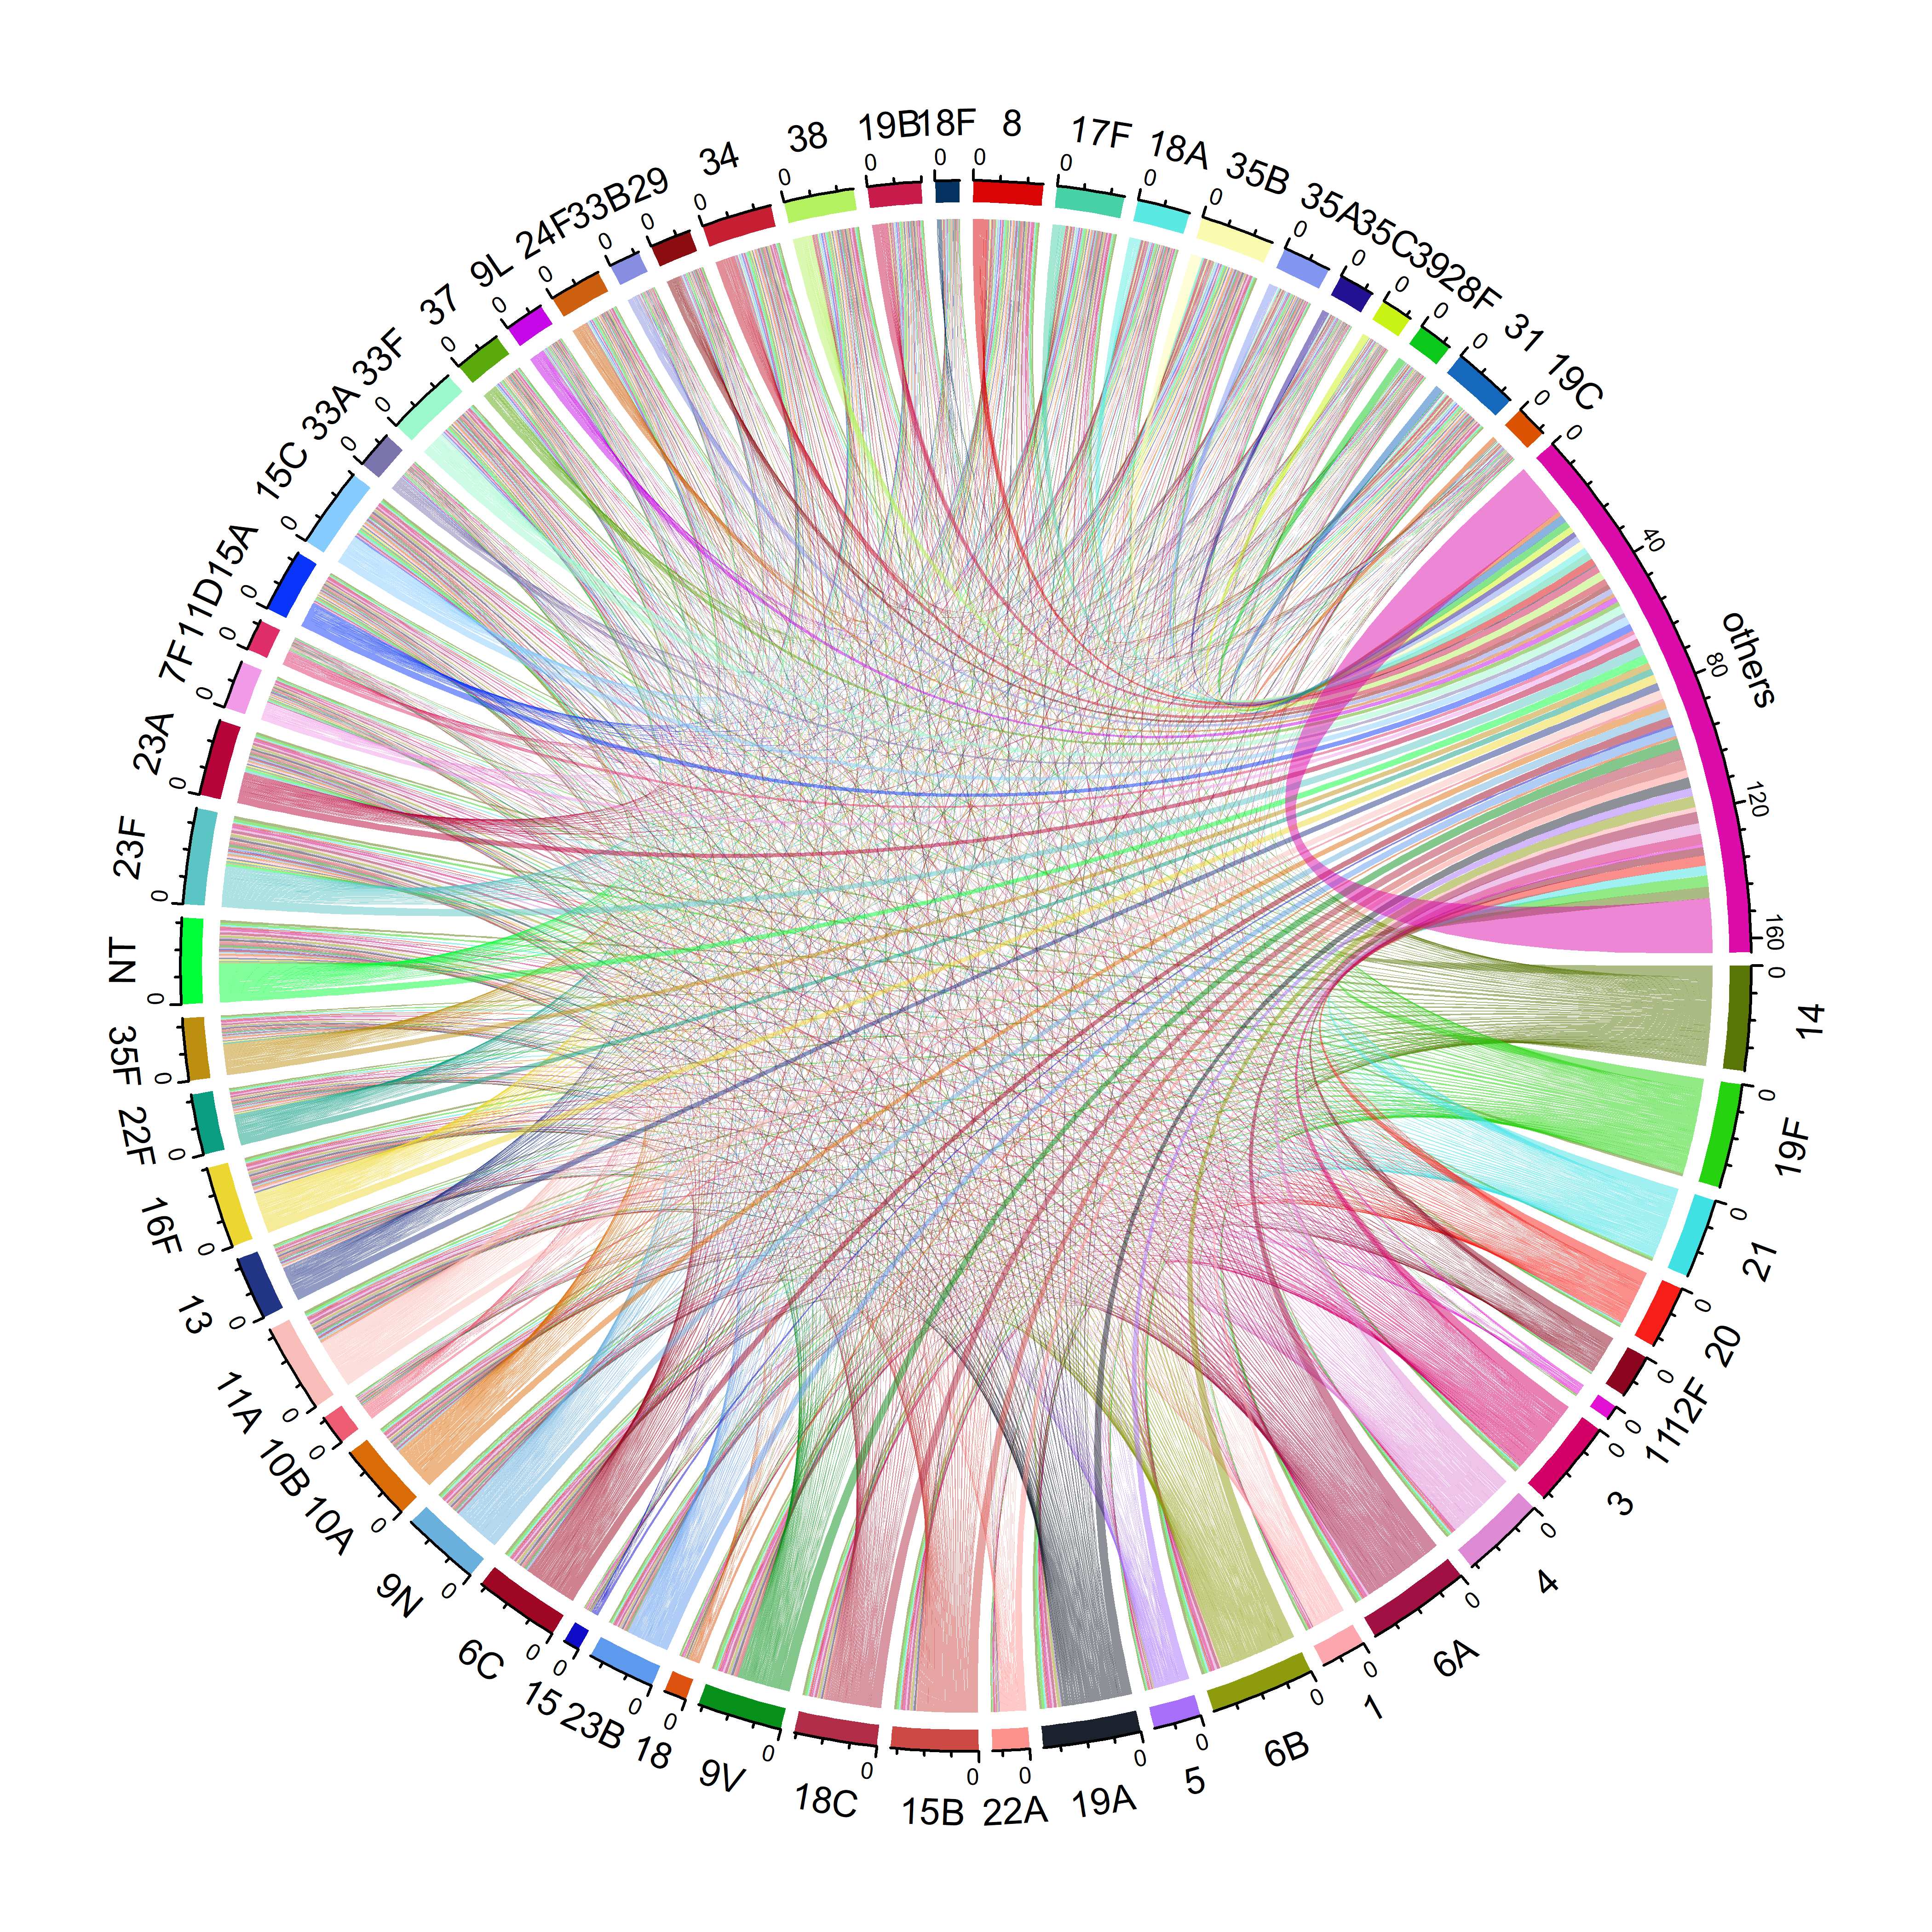
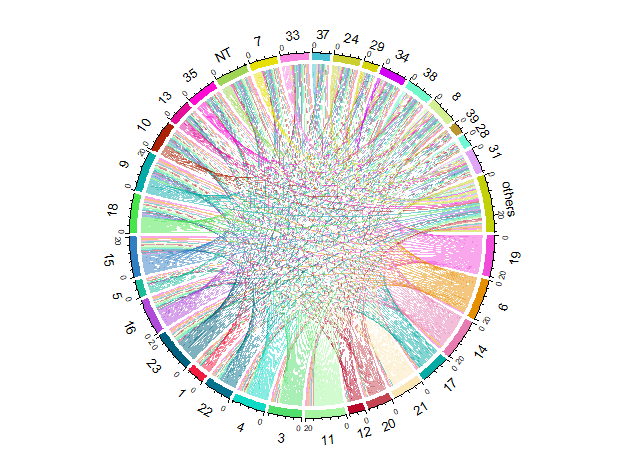
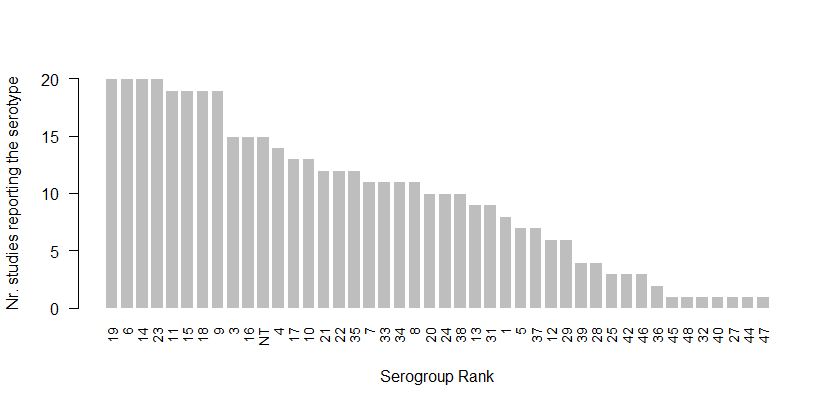
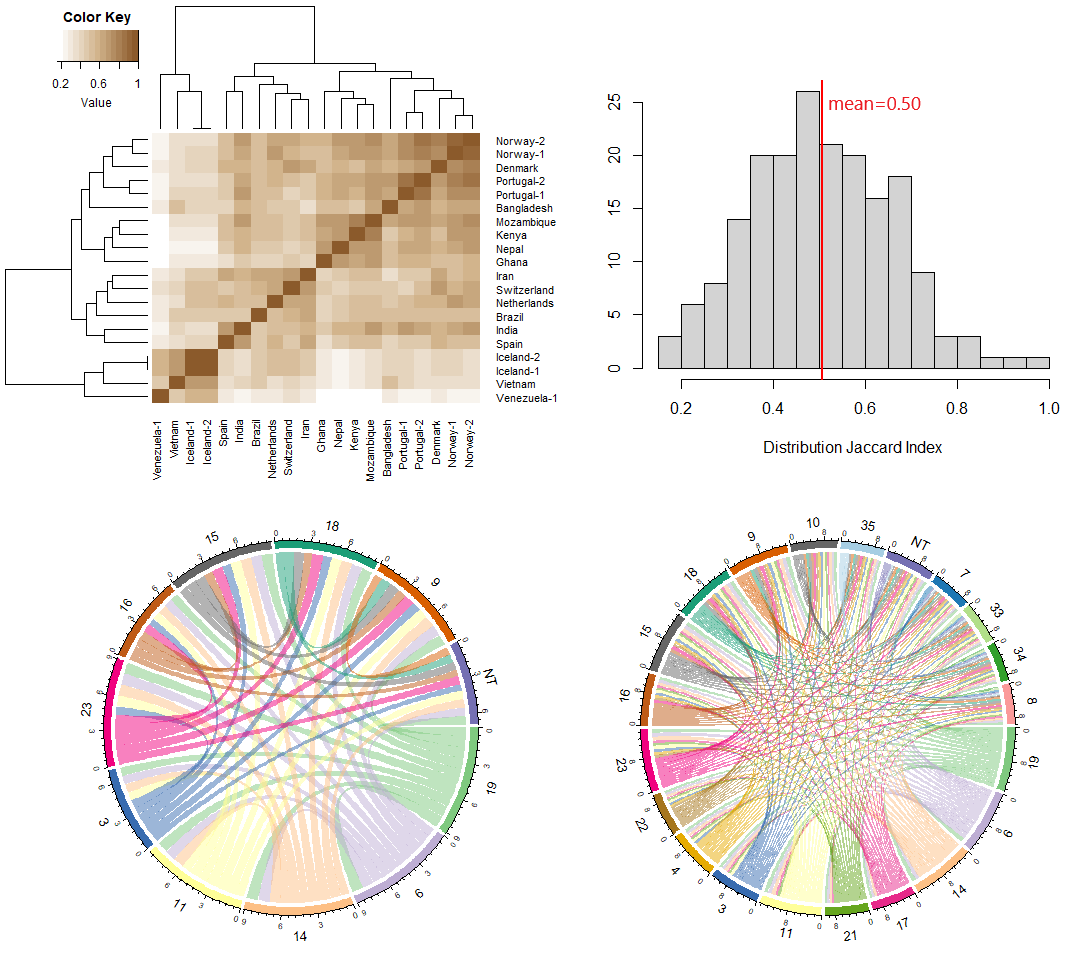
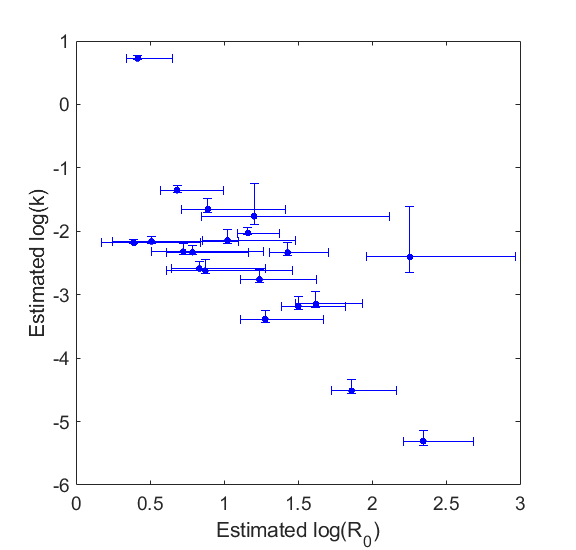
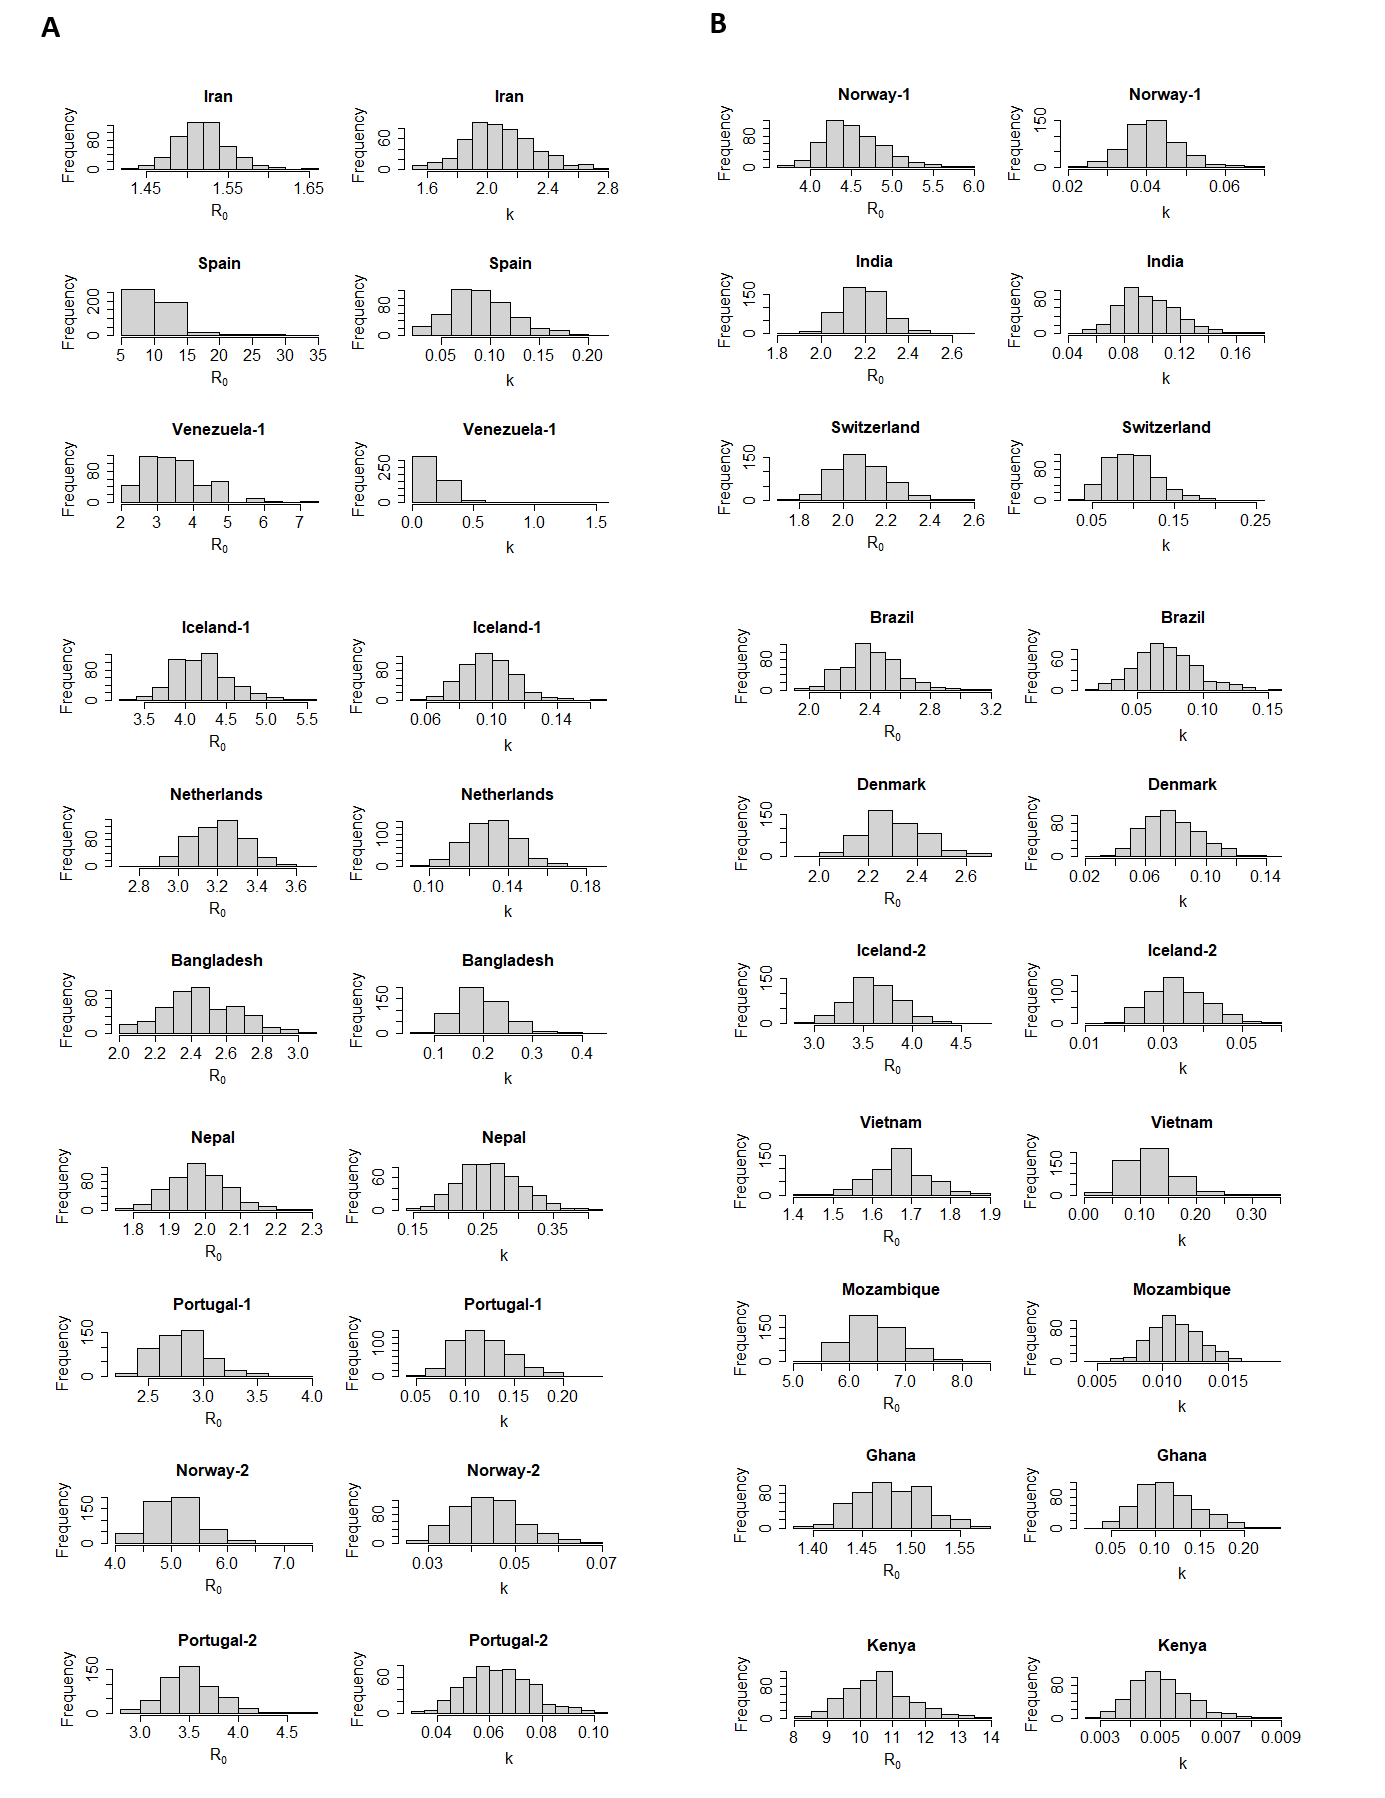
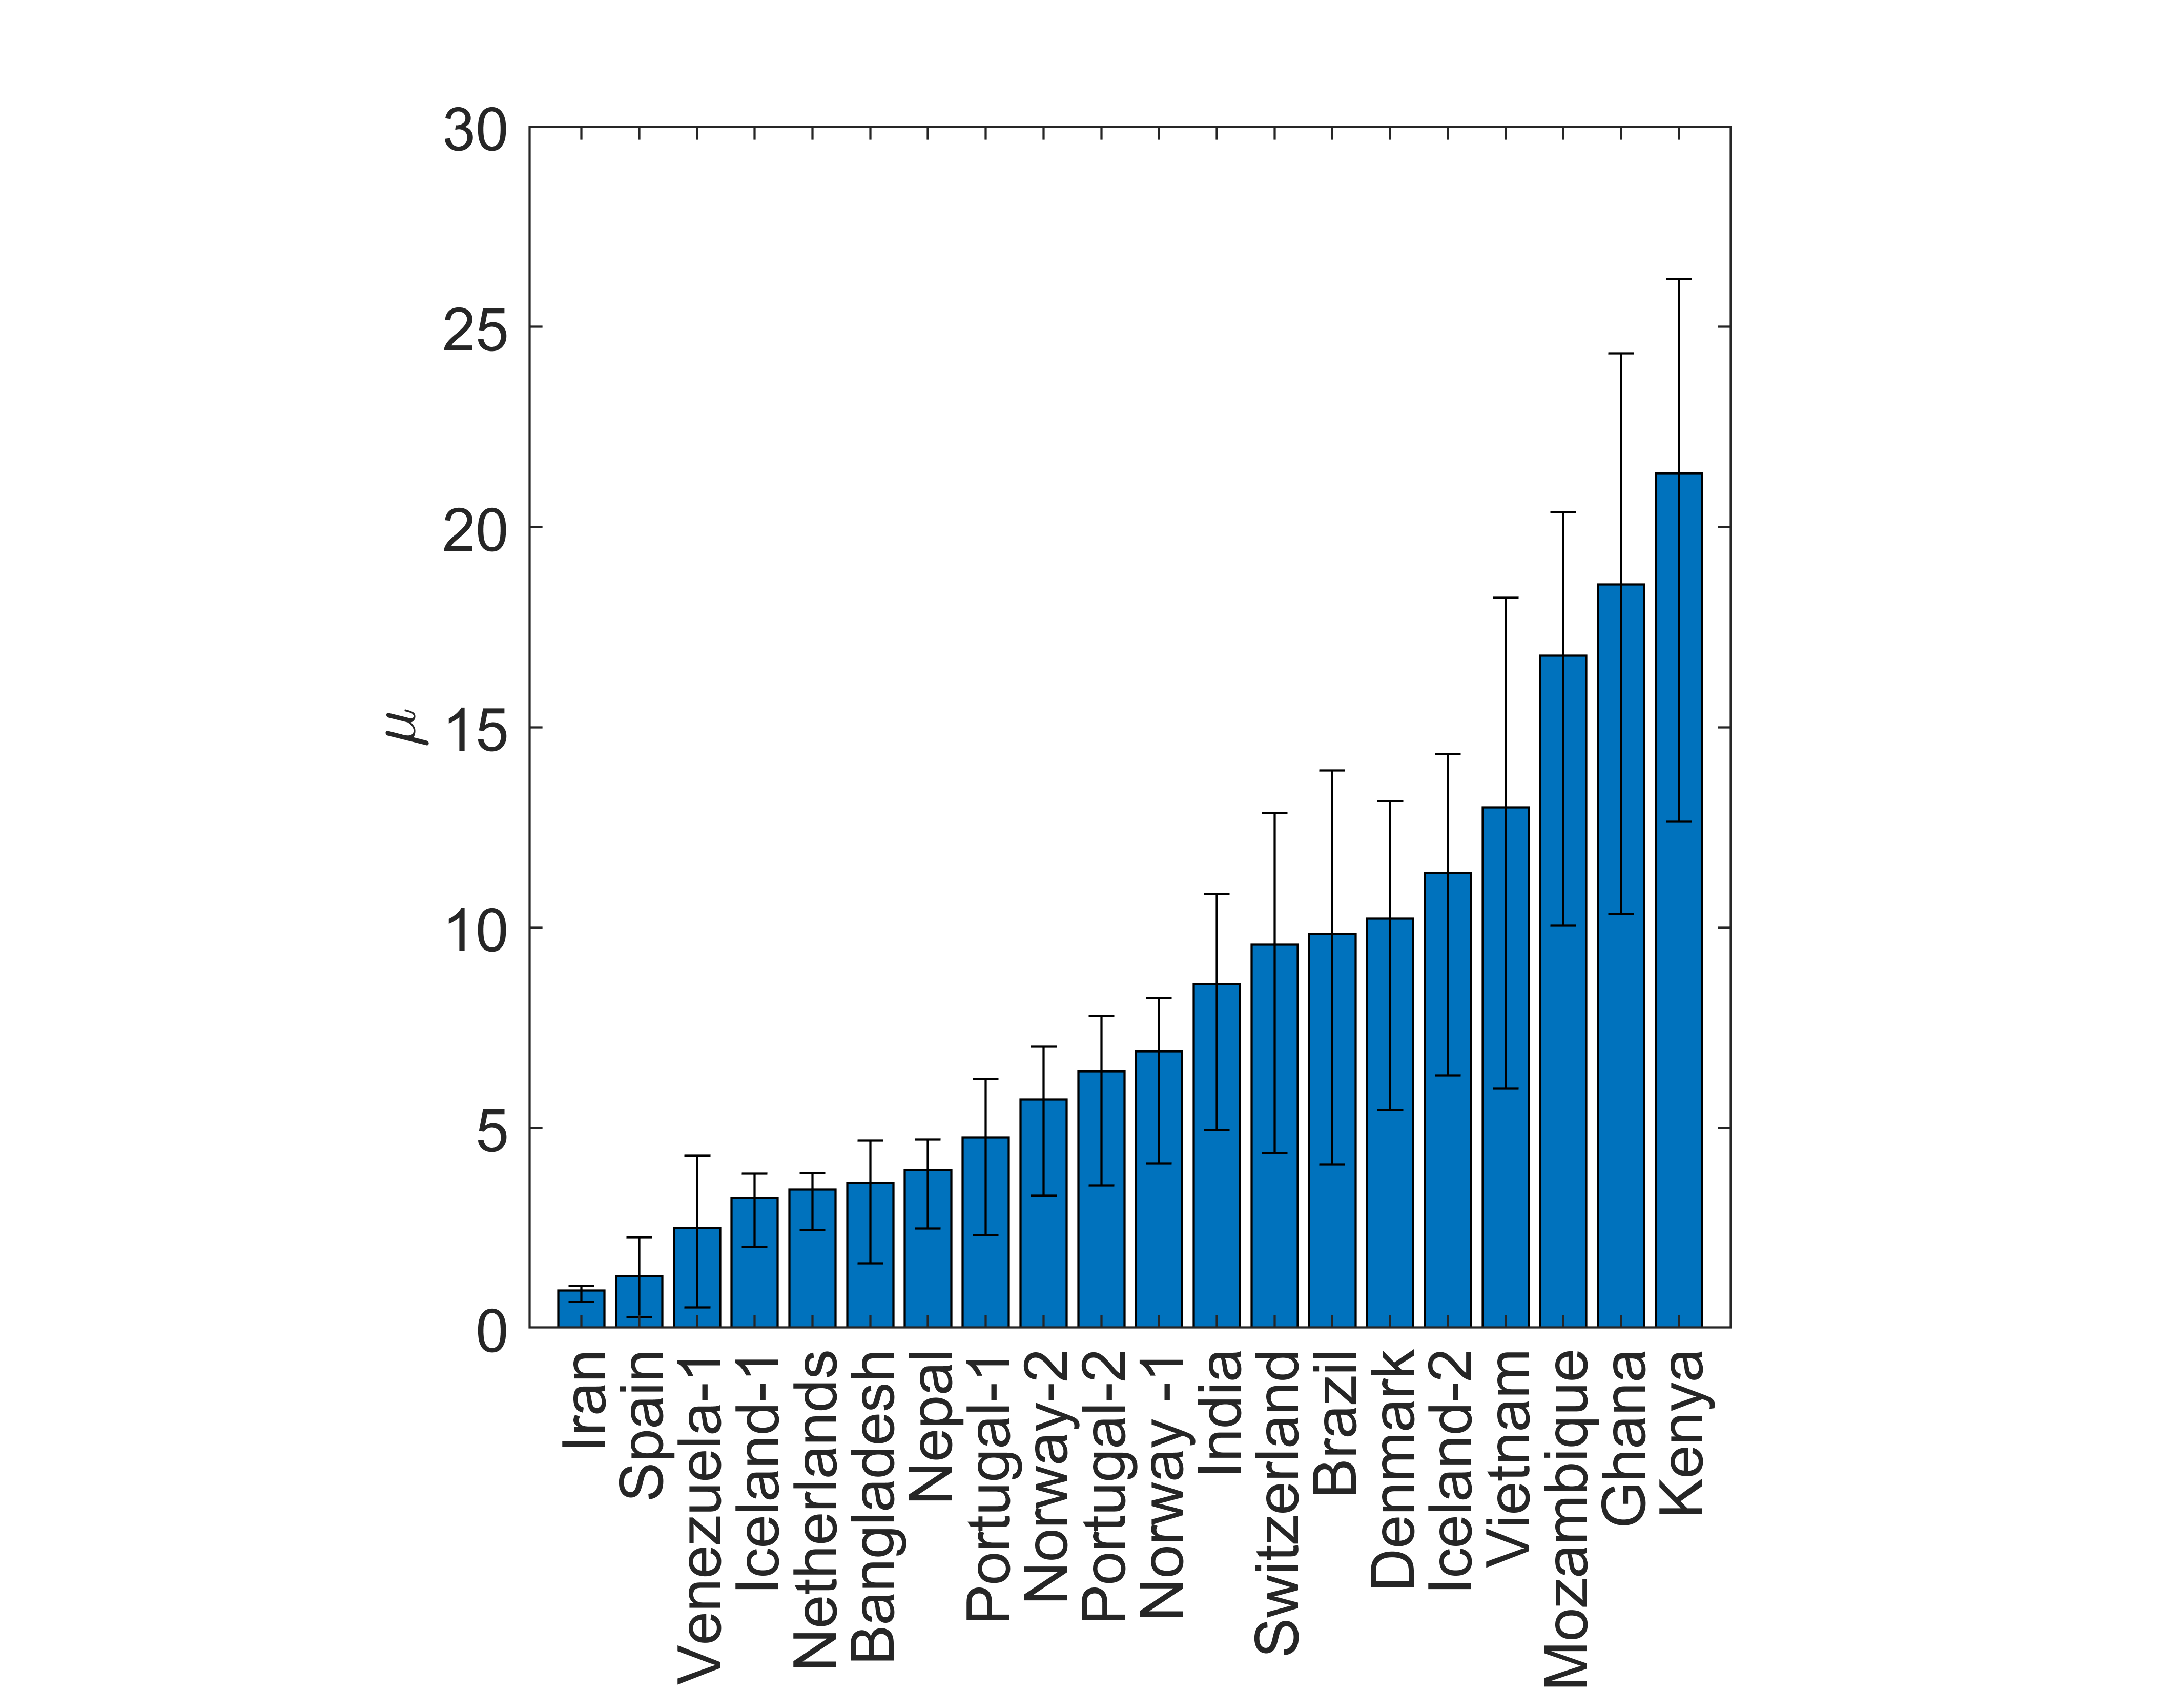
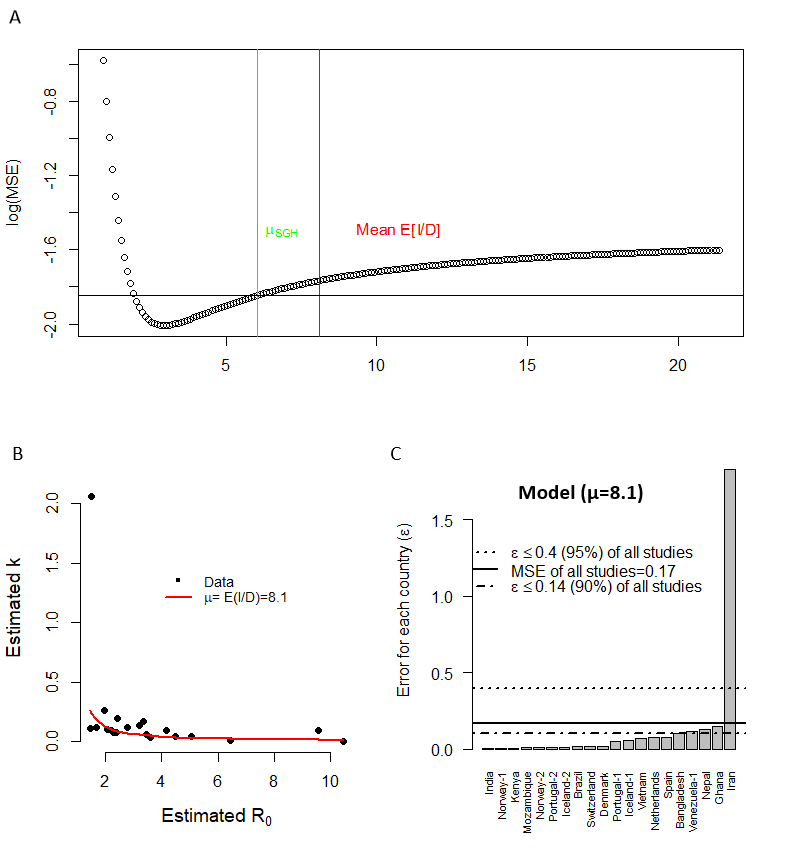
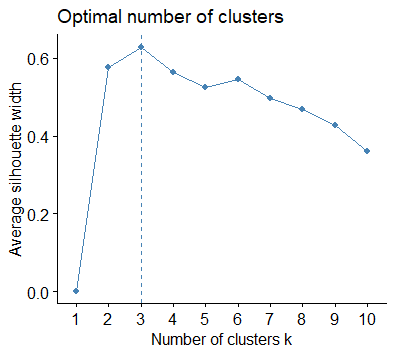
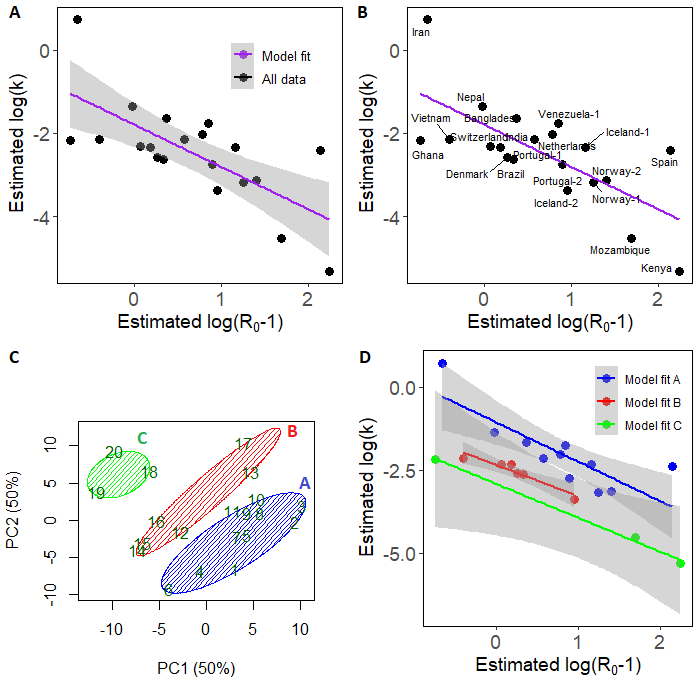
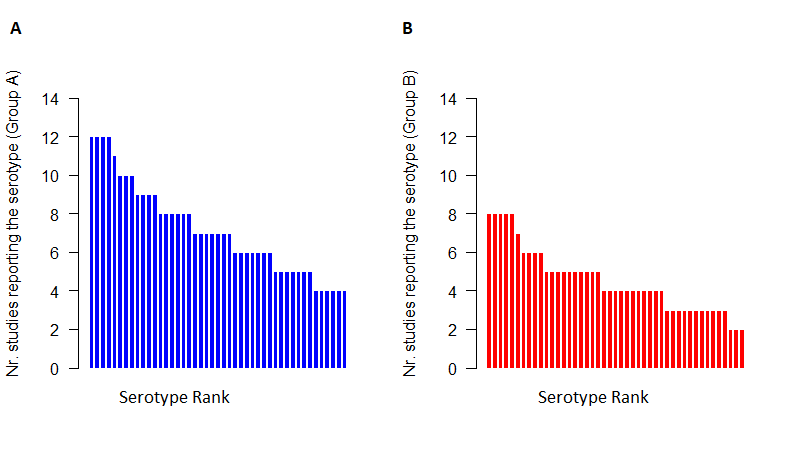
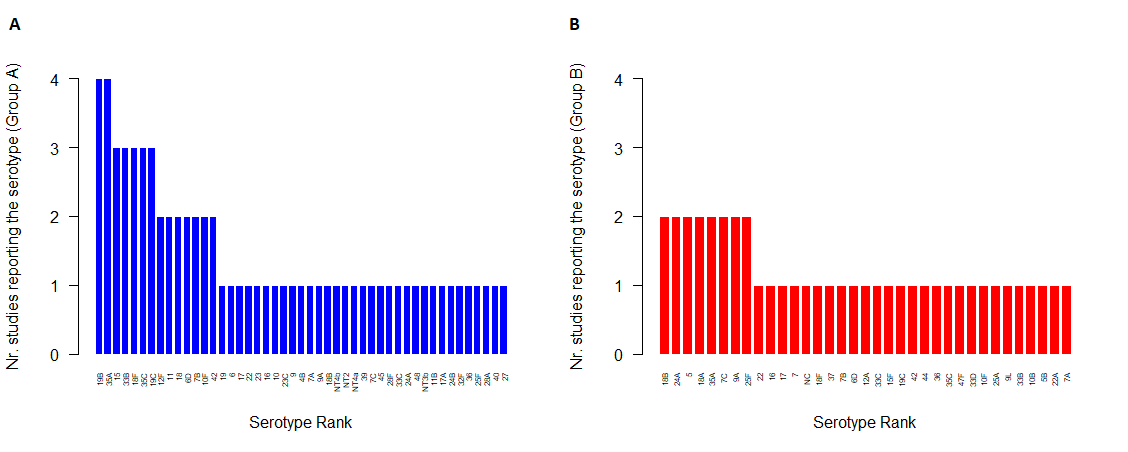
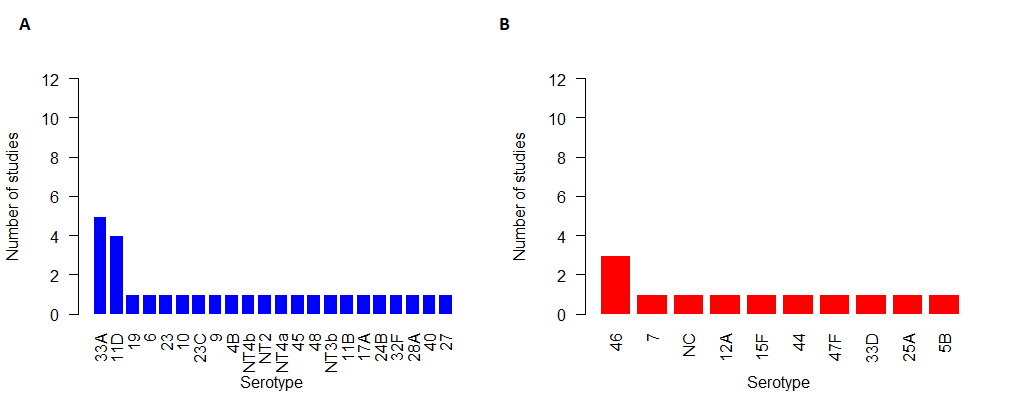
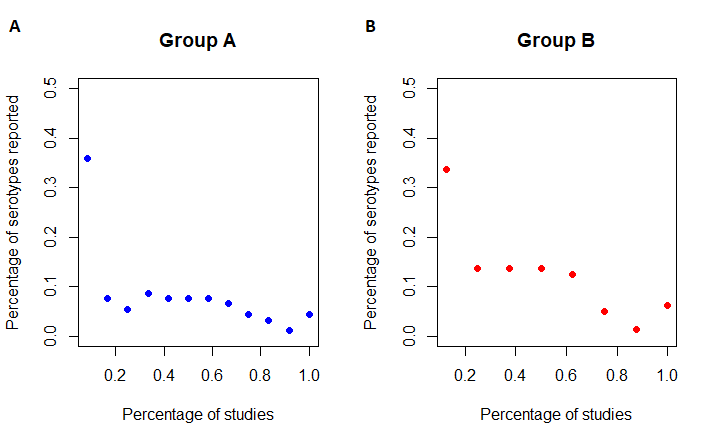
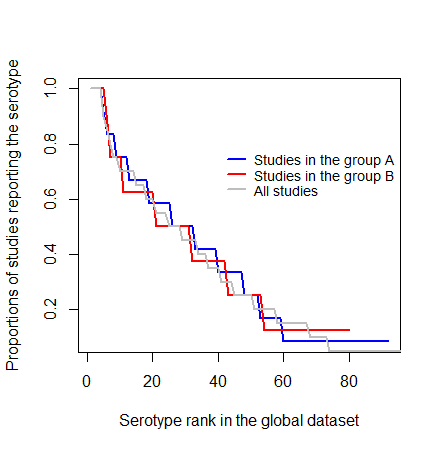
| Nr. of times | Group A (low ) -12 sites | Group B (high ) - 8 sites |
|---|---|---|
| Iran, Spain, Venezuela-1, Iceland-1, Netherlands, Bangladesh, Nepal, Portugal-1, Norway-2, Portugal-2, Norway-1, India | Switzerland, Brazil, Denmark, Iceland-2, Vietnam, Mozambique, Ghana, Kenya | |
| 1 | 10, 11B, 16, 17, 17A, 18B, 19, 22, 23, 23C, 24A, 24B, 25F, 27, 28A, 28F, 32F, 33C, 36, 39, 40, 45, 48, 4B, 6, 7A, 7C, 9, 9A, NT2, NT3b, NT4a, NT4b | 10B, 10F, 12A, 15F, 16, 17, 18F, 19C, 22, 22A, 25A, 33B, 33C, 33D, 35C, 36, 37, 42, 44, 47F, 5B, 6D, 7, 7A, 7B, 9L, NC |
| 2 | 10F, 11, 12F, 18, 42, 6D, 7B | 15, 18A, 18B, 22F, 24A, 25F, 29, 35A, 5, 7C, 9A |
| 3 | 15, 18F, 19C, 33B, 35C | 1, 11, 13, 19B, 24F, 28F, 31, 33F, 35F, 39, 46 |
| 4 | 10B, 11D, 19B, 22A, 29, 35A, 7F, 9L | 10A, 12F, 15A, 18, 21, 23B, 34, 35B, 38, 7F, 8 |
| 5 | 1, 15A, 18A, 20, 24F, 33A, 5 | 11A, 15B, 15C, 16F, 17F, 18C, 20, 6C, 9N, NT |
| 6 | 13, 17F, 23B, 31, 35F, 37, 38 | 19A, 23A, 9V |
| 7 | 22F, 23A, 33F, 34, 35B, 8, 9N | 3 |
| 8 | 10A, 15C, 16F, 21, 3, 4 | 14, 19F, 23F, 6A, 6B |
| 9 | 11A, 15B, 18C, 6C | |
| 10 | 23F, 9V, NT | |
| 11 | 19A | |
| 12 | 14, 19F, 6A, 6B |
| Nr. of times | Group A (low ) | Group B (high ) |
|---|---|---|
| Iran, Spain, Venezuela-1, Iceland-1, Netherlands, Bangladesh, Nepal, Portugal-1, Norway-2, Portugal-2, Norway-1, India | Switzerland, Brazil, Denmark, Iceland-2, Vietnam, Mozambique, Ghana, Kenya | |
| 1 | 25, 27, 28, 32, 36, 39, 40, 45, 48 | 36, 37, 42, 44, 47 |
| 2 | 12, 42 | 25, 29, 5 |
| 3 | 1, 13, 22, 28, 31, 33, 39, 46 | |
| 4 | 29 | 10, 12, 21, 24, 34, 35, 38, 8 |
| 5 | 1, 20, 5 | 20, 7, NT |
| 6 | 13, 24, 31, 37, 38, 7 | 16, 17, 4 |
| 7 | 17, 34, 8 | 3, 9 |
| 8 | 21, 3, 33, 35, 4 | 11, 14, 15, 18, 19, 23, 6 |
| 9 | 10, 16, 22 | |
| 10 | NT | |
| 11 | 11, 15, 18 | |
| 12 | 14, 19, 23, 6, 9 |
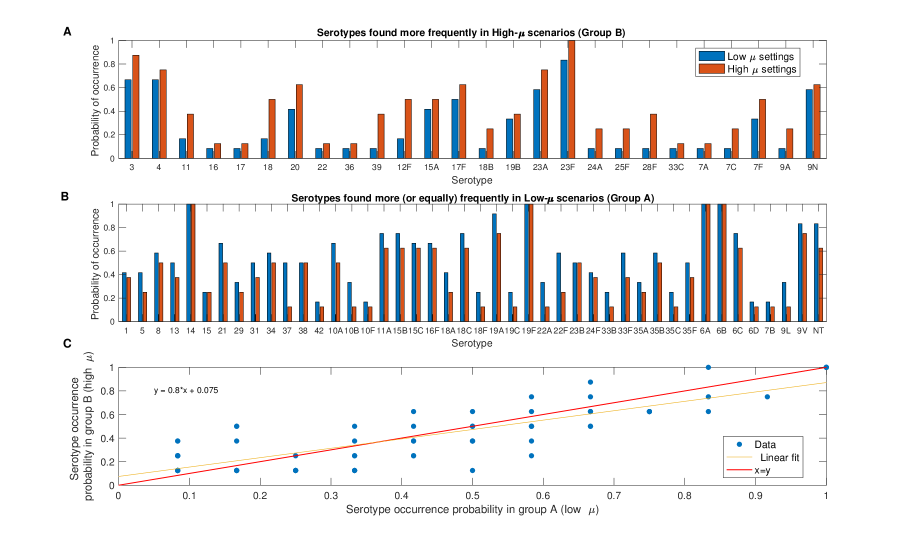
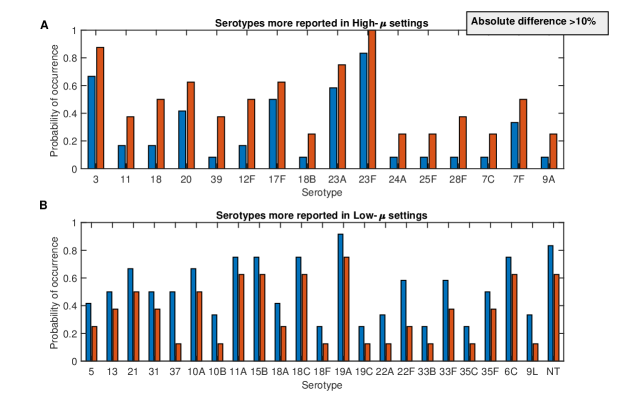
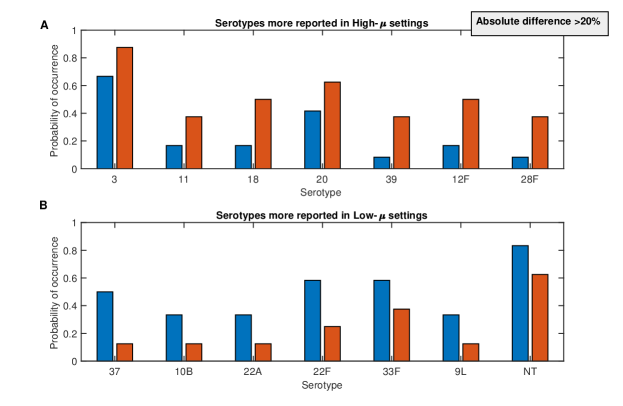
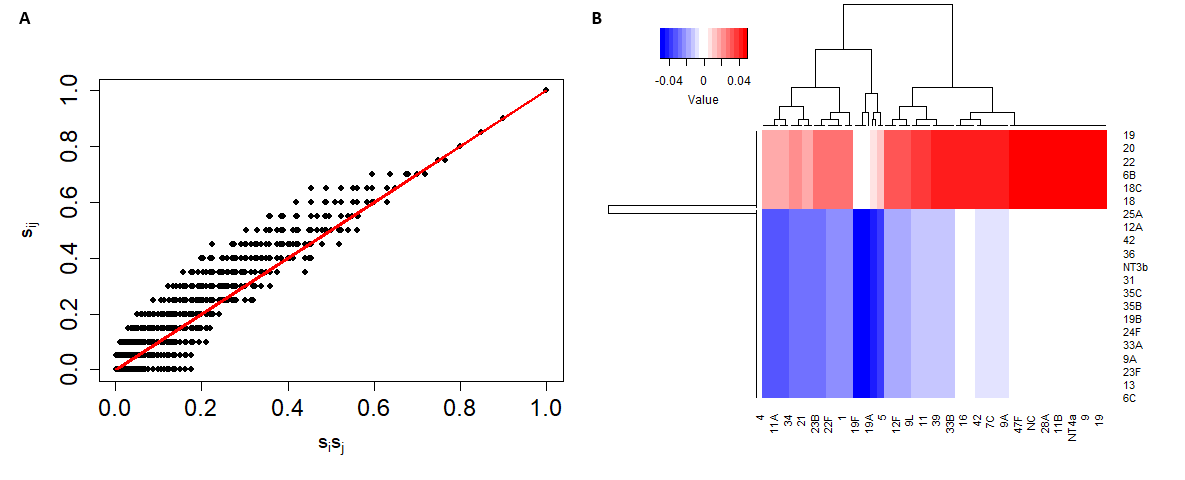
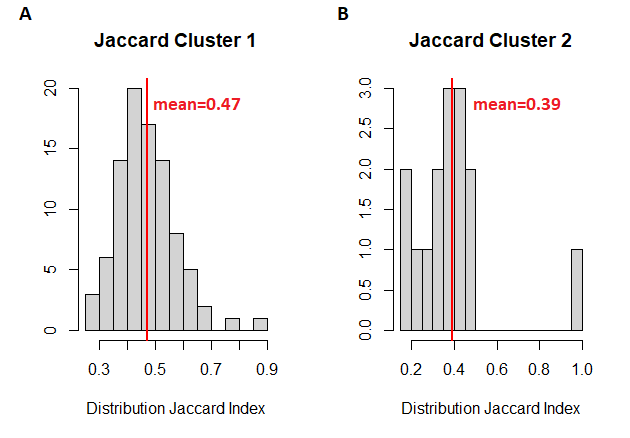
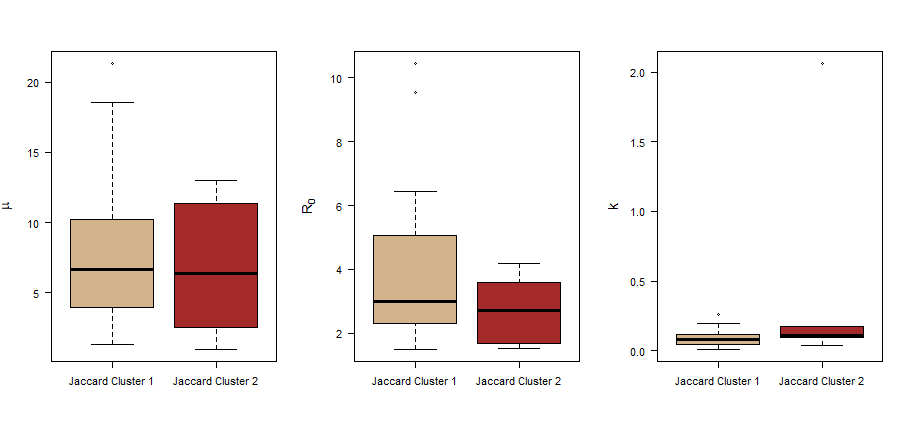
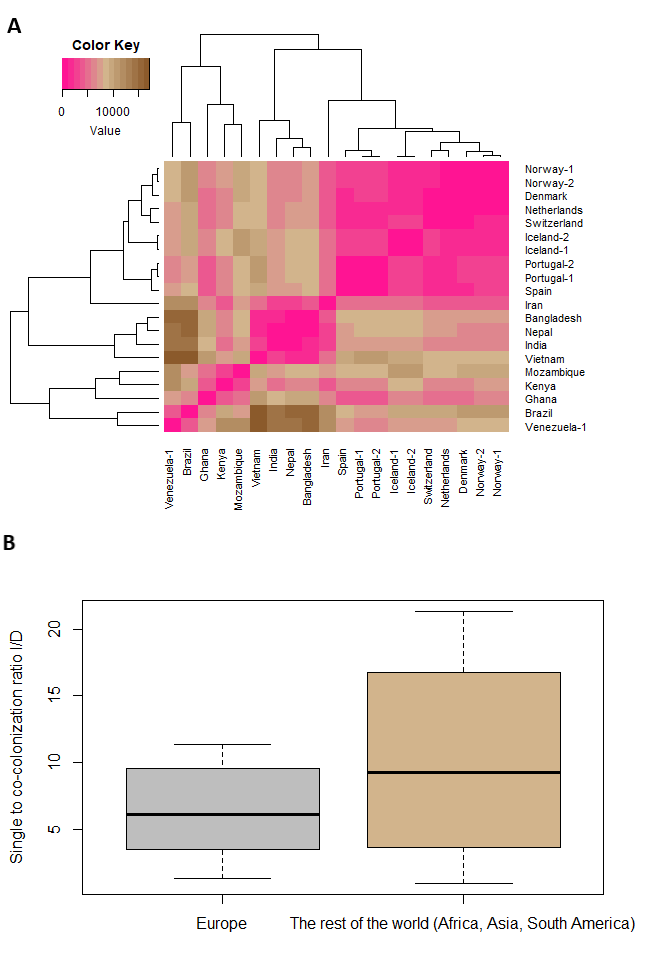
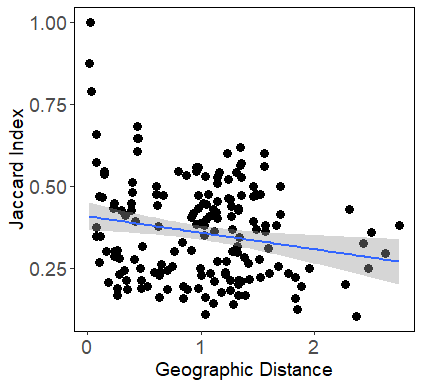
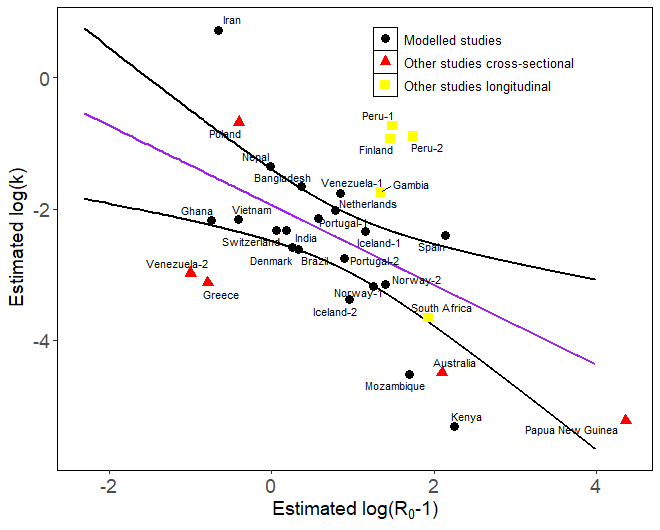
| Location | Sample Size | Susceptible | Single-col. | Co-col. | Ratio I/D | k | Type | Year | Ref. | |
|---|---|---|---|---|---|---|---|---|---|---|
| n | ||||||||||
| Venezuela-2 | 1004 | 733 (73%) | 266 (26.5%) | 5 (0.5%) | 53.2 | 1.37 | 0.051 | C. | 2006-2008 | [22] |
| Greece | 2448 | 1682 (68.7%) | 751 (30.7%) | 15 (0.6%) | 50.07 | 1.45 | 0.044 | C. | 1997-1999 | [23] |
| Poland | 394 | 236 (59.9%) | 118 (29.9%) | 40 (10.2%) | 2.95 | 1.67 | 0.506 | C. | 2016-2020 | [24] |
| Australia | 174 | 19 (10.9%) | 142 (81.6%) | 13 (7.5%) | 10.9 | 9.1 | 0.011 | C. | 1981 | [25] |
| P.N Guinea | 158 | 2 (1.3%) | 110 (69.6%) | 46 (29.1%) | 2.39 | 79 | 0.005 | C. | 1985-1987 | [26, 27] |
| Finland | 329 | 62 (18.8%) | 99 (30.1%) | 168 (51.1%) | 0.59 | 5.30 | 0.394 | L. | 1994-1995 | [28] |
| S. Africa | 174 | 22 (12.6%) | 129 (74.1%) | 23 (13.2%) | 5.61 | 7.91 | 0.026 | L. | 2012-2013 | [29] |
| Gambia | 1553 | 321 (20.7%) | 739 (47.6%) | 493 (31.7%) | 1.50 | 4.84 | 0.174 | L. | 2008-2009 | [30] |
| Peru-1 | 509 | 94 (18.5%) | 133 (26.1%) | 282 (55.4%) | 0.47 | 5.41 | 0.48 | L. | 2011 | [7] |
| Peru-2 | 506 | 75 (14.8%) | 129 (25.5%) | 302 (59.7%) | 0.43 | 6.75 | 0.407 | L. | 2009 | [7] |
References
- Tabatabaei et al. [2014] S Rafiei Tabatabaei, F Fallah, F Shiva, AR Shamshiri, M Hajia, M Navidinia, A Karimi, and M Rahbar. Multiplex pcr assay for detection of pneumococcal serotypes in nasopharyngeal samples of healthy children; tehran, 2009-2010. Annual Research & Review in Biology, pages 3780–3790, 2014.
- Ercibengoa et al. [2012] María Ercibengoa, Nerea Arostegi, José M Marimón, Marta Alonso, and Emilio Pérez-Trallero. Dynamics of pneumococcal nasopharyngeal carriage in healthy children attending a day care center in northern spain. influence of detection techniques on the results. BMC infectious diseases, 12(1):1–8, 2012.
- Rivera-Olivero et al. [2009] Ismar A Rivera-Olivero, Martijn Blommaart, Debby Bogaert, Peter WM Hermans, and Jacobus H de Waard. Multiplex pcr reveals a high rate of nasopharyngeal pneumococcal 7-valent conjugate vaccine serotypes co-colonizing indigenous warao children in venezuela. Journal of medical microbiology, 58(5):584–587, 2009.
- Hjálmarsdóttir et al. [2016] Martha Á Hjálmarsdóttir, Pálína Fanney Gumundsdóttir, Helga Erlendsdóttir, Karl G Kristinsson, and Gunnsteinn Haraldsson. Cocolonization of pneumococcal serotypes in healthy children attending day care centers: molecular versus conventional methods. The Pediatric infectious disease journal, 35(5):477–480, 2016.
- Wyllie et al. [2016] Anne L Wyllie, Alienke J Wijmenga-Monsuur, Marlies A van Houten, Astrid ATM Bosch, James A Groot, Jody van Engelsdorp Gastelaars, Jacob P Bruin, Debby Bogaert, Nynke Y Rots, Elisabeth AM Sanders, et al. Molecular surveillance of nasopharyngeal carriage of streptococcus pneumoniae in children vaccinated with conjugated polysaccharide pneumococcal vaccines. Scientific reports, 6(1):1–9, 2016.
- Rodrigues et al. [2017] HG Rodrigues, TCA Pinto, RR Barros, LM Teixeira, and FPG Neves. Pneumococcal nasopharyngeal carriage among children in brazil prior to the introduction of the 10-valent conjugate vaccine: a culture-and pcr-based survey. Epidemiology & Infection, 145(8):1720–1726, 2017.
- Saha et al. [2015] Sudipta Saha, Joyanta K Modak, Hakka Naziat, Hassan M Al-Emran, Mrittika Chowdury, Maksuda Islam, Belal Hossain, Gary L Darmstadt, Cynthia G Whitney, and Samir K Saha. Detection of co-colonization with streptococcus pneumoniae by algorithmic use of conventional and molecular methods. Vaccine, 33(5):713–718, 2015.
- Kandasamy et al. [2015] Rama Kandasamy, Meeru Gurung, Anushil Thapa, Susan Ndimah, Neelam Adhikari, David R Murdoch, Dominic F Kelly, Denise E Waldron, Katherine A Gould, Stephen Thorson, et al. Multi-serotype pneumococcal nasopharyngeal carriage prevalence in vaccine naive nepalese children, assessed using molecular serotyping. PloS one, 10(2):e0114286, 2015.
- Valente et al. [2012] Carina Valente, Jason Hinds, Francisco Pinto, Silvio D Brugger, Katherine Gould, Kathrin Muhlemann, Hermínia de Lencastre, and Raquel Sá-Leão. Decrease in pneumococcal co-colonization following vaccination with the seven-valent pneumococcal conjugate vaccine. PloS one, 7(1):e30235, 2012.
- Sá-Leão et al. [2009] R Sá-Leão, S Nunes, A Brito-Avô, N Frazao, AS Simoes, MI Crisostomo, ACS Paulo, J Saldanha, I Santos-Sanches, and H De Lencastre. Changes in pneumococcal serotypes and antibiotypes carried by vaccinated and unvaccinated day-care centre attendees in portugal, a country with widespread use of the seven-valent pneumococcal conjugate vaccine. Clinical microbiology and infection, 15(11):1002–1007, 2009.
- Gjini [2017] Erida Gjini. Geographic variation in pneumococcal vaccine efficacy estimated from dynamic modeling of epidemiological data post-pcv7. Scientific Reports, 7(1):1–16, 2017.
- Vestrheim et al. [2010] Didrik F Vestrheim, E Arne Høiby, Ingeborg S Aaberge, and Dominique A Caugant. Impact of a pneumococcal conjugate vaccination program on carriage among children in norway. Clinical and Vaccine Immunology, 17(3):325–334, 2010.
- Sutcliffe et al. [2019] Catherine G Sutcliffe, Anita Shet, Rosemol Varghese, Balaji Veeraraghavan, Anand Manoharan, Brian Wahl, Sara Chandy, Jack Sternal, Raziuddin Khan, Rakesh Kumar Singh, et al. Nasopharyngeal carriage of streptococcus pneumoniae serotypes among children in india prior to the introduction of pneumococcal conjugate vaccines: a cross-sectional study. BMC infectious diseases, 19(1):1–12, 2019.
- Brugger et al. [2009] Silvio D Brugger, Lucy J Hathaway, and Kathrin Muhlemann. Detection of streptococcus pneumoniae strain cocolonization in the nasopharynx. Journal of clinical microbiology, 47(6):1750–1756, 2009.
- Harboe et al. [2012] Zitta B Harboe, Hans-Christian Slotved, Helle B Konradsen, and Margit S Kaltoft. A pneumococcal carriage study in danish pre-school children before the introduction of pneumococcal conjugate vaccination. The open microbiology journal, 6:40, 2012.
- Dhoubhadel et al. [2014] Bhim Gopal Dhoubhadel, Michio Yasunami, Hien Anh Thi Nguyen, Motoi Suzuki, Thu Huong Vu, Ai Thi Thuy Nguyen, Duc Anh Dang, Lay-Myint Yoshida, and Koya Ariyoshi. Bacterial load of pneumococcal serotypes correlates with their prevalence and multiple serotypes is associated with acute respiratory infections among children less than 5 years of age. PloS one, 9(10):e110777, 2014.
- Adebanjo et al. [2018] Tolulope Adebanjo, Fernanda C Lessa, Helio Mucavele, Benild Moiane, Alberto Chauque, Fabiana Pimenta, Sergio Massora, Maria da Gloria Carvalho, Cynthia G Whitney, and Betuel Sigauque. Pneumococcal carriage and serotype distribution among children with and without pneumonia in mozambique, 2014-2016. PloS one, 13(6):e0199363, 2018.
- Dayie et al. [2013] Nicholas TKD Dayie, Reuben E Arhin, Mercy J Newman, Anders Dalsgaard, Magne Bisgaard, Niels Frimodt-Møller, and Hans-Christian Slotved. Penicillin resistance and serotype distribution of streptococcus pneumoniae in ghanaian children less than six years of age. BMC infectious diseases, 13(1):1–7, 2013.
- Kobayashi et al. [2017] Miwako Kobayashi, Laura M Conklin, Godfrey Bigogo, Geofrey Jagero, Lee Hampton, Katherine E Fleming-Dutra, Muthoni Junghae, Maria da Gloria Carvalho, Fabiana Pimenta, Bernard Beall, et al. Pneumococcal carriage and antibiotic susceptibility patterns from two cross-sectional colonization surveys among children aged¡ 5 years prior to the introduction of 10-valent pneumococcal conjugate vaccine in kenya, 2009–2010. BMC infectious diseases, 17(1):1–12, 2017.
- Madec and Gjini [2020] Sten Madec and Erida Gjini. Predicting n-strain coexistence from co-colonization interactions: epidemiology meets ecology and the replicator equation. Bulletin of Mathematical Biology, 82(142), 2020. doi: https://doi.org/10.1007/s11538-020-00816-w.
- Gjini and Madec [2021] Erida Gjini and Sten Madec. The ratio of single to co-colonization is key to complexity in interacting systems with multiple strains. Ecology and Evolution, 11(13):8456–8474, 2021. doi: https://doi.org/10.1002/ece3.7259.
- Rivera-Olivero et al. [2011] Ismar A Rivera-Olivero, Berenice del Nogal, María Carolina Sisco, Debby Bogaert, Peter WM Hermans, and Jacobus H de Waard. Carriage and invasive isolates of streptococcus pneumoniae in caracas, venezuela: the relative invasiveness of serotypes and vaccine coverage. European journal of clinical microbiology & infectious diseases, 30(12):1489–1495, 2011.
- Syrogiannopoulos et al. [2002] George A Syrogiannopoulos, George D Katopodis, Ioanna N Grivea, and Nicholas G Beratis. Antimicrobial use and serotype distribution of nasopharyngeal streptococcus pneumoniae isolates recovered from greek children younger than 2 years old. Clinical infectious diseases, 35(10):1174–1182, 2002.
- Wróbel-Pawelczyk et al. [2022] Izabela Wróbel-Pawelczyk, Patrycja Ronkiewicz, Monika Wanke-Rytt, Dominika Rykowska, Aneta Górska-Kot, Katarzyna Włodkowska, Agnieszka Topczewska-Cabanek, Teresa Jackowska, Joanna Chruszcz, Walentyna Marchut, et al. Pneumococcal carriage in unvaccinated children at the time of vaccine implementation into the national immunization program in poland. Scientific Reports, 12(1):1–11, 2022.
- Hansman et al. [1985] D Hansman, S Morris, M Gregory, and B McDonald. Pneumococcal carriage amongst australian aborigines in alice springs, northern territory. Epidemiology & Infection, 95(3):677–684, 1985.
- Gratten et al. [1989] M Gratten, J Montgomery, G Gerega, H Gratten, H Siwi, A Poli, and G Koki. Multiple colonization of the upper respiratory tract of papua new guinea children with haemophilus influenzae and streptococcus pneumoniae. The Southeast Asian journal of tropical medicine and public health, 20(4):501–509, 1989.
- Montgomery et al. [1990] Janet M Montgomery, Deborah Lehmann, Tom Smith, Audrey Michael, Benetty Joseph, Tony Lupin, Christine Coakley, Veronica Spooner, Bronwyn Best, Ian D Riley, et al. Bacterial colonization of tbe upper respiratory tract and its association witb acute lower respiratory tract infections in higbland cbildren of papua new guinea. Reviews of Infectious Diseases, 12(Supplement_8):S1006–S1016, 1990.
- Syrjänen et al. [2001] Ritva K Syrjänen, Terhi M Kilpi, Tarja H Kaijalainen, Elja E Herva, and Aino K Takala. Nasopharyngeal carriage of streptococcus pneumoniae in finnish children younger than 2 years old. The Journal of infectious diseases, 184(4):451–459, 2001.
- Manenzhe et al. [2020] Rendani I Manenzhe, Felix S Dube, Meredith Wright, Katie Lennard, Stephanie Mounaud, Stephanie W Lo, Heather J Zar, William C Nierman, Mark P Nicol, and Clinton Moodley. Characterization of pneumococcal colonization dynamics and antimicrobial resistance using shotgun metagenomic sequencing in intensively sampled south african infants. Frontiers in public health, page 543, 2020.
- Chaguza et al. [2021] Chrispin Chaguza, Madikay Senghore, Ebrima Bojang, Stephanie W Lo, Chinelo Ebruke, Rebecca A Gladstone, Peggy-Estelle Tientcheu, Rowan E Bancroft, Archibald Worwui, Ebenezer Foster-Nyarko, et al. Carriage dynamics of pneumococcal serotypes in naturally colonized infants in a rural african setting during the first year of life. Frontiers in pediatrics, 8:898, 2021.