11email: mayingxiu@xao.ac.cn; zhoujj@xao.ac.cn 22institutetext: University of Chinese Academy of Sciences, Beijing 100049, PR China 33institutetext: Key Laboratory of Radio Astronomy, Chinese Academy of Sciences, Urumqi 830011, PR China 44institutetext: Xinjiang Key Laboratory of Radio Astrophysics, Urumqi 830011, PR China 55institutetext: Netherlands Institute for Radio Astronomy, ASTRON, 7991 PD Dwingeloo, The Netherlands 66institutetext: Max-Planck-Institut für Radioastronomie, Auf dem Hügel 69, D-53121 Bonn, Germany 77institutetext: Purple Mountain Observatory, Chinese Academy of Sciences, Nanjing 210008, PR China
Cloud-cloud collision and star formation in G323.18+0.15
We studied the cloud-cloud collision candidate G323.18+0.15 based on signatures of induced filaments, clumps, and star formation. We used archival molecular spectrum line data from the SEDIGISM 13CO ( = 2–1) survey, from the Mopra southern Galactic plane CO survey, and infrared to radio data from the GLIMPSE, MIPS, Hi-GAL, and SGPS surveys. Our new result shows that the G323.18+0.15 complex is 3.55 kpc away from us and consists of three cloud components, G323.18a, G323.18b, and G323.18c. G323.18b shows a perfect U-shape structure, which can be fully complemented by G323.18a, suggesting a collision between G323.18a and the combined G323.18bc filamentary structure. One dense compressed layer (filament) is formed at the bottom of G323.18b, where we detect a greatly increased velocity dispersion. The bridge with an intermediate velocity in a position-velocity diagram appears between G323.18a and G323.18b, which corresponds to the compressed layer. G323.18a plus G323.18b as a whole are probably not gravitationally bound. This indicates that high-mass star formation in the compressed layer may have been caused by an accidental event. The column density in the compressed layer of about cm-2 and most of the dense clumps and high-mass stars are located there. The average surface density of class I and class II young stellar objects (YSOs) inside the G323.18+0.15 complex is much higher than the density in the surroundings. The timescale of the collision between G323.18a and G323.18b is Myr. This is longer than the typical lifetime of class I YSOs and is comparable to the lifetime of class II YSOs.
Key Words.:
ISM: clouds - ISM: kinematics and dynamics - ISM:individual objects (G323.18+0.15) - radio lines: ISM - stars: formation1 Introduction
While high-mass star formation is currently poorly understood, two main mechanisms for high-mass star formation have been proposed: the competitive accretion in a massive self-gravitating system (Bonnell et al., 2001), and the monolithic collapse of a dense cloud (McKee & Tan, 2002; Krumholz et al., 2009). Both mechanisms have their problems (Fukui et al., 2020). For example, the first cannot explain the formation of single isolated O-stars with a lower system mass (Ascenso, 2018). The second requires that the compact cloud or clump produces a column density 1 g cm-2 (Krumholz et al., 2009, 2012), but it is not clear how such a high-density molecular cloud is formed. If the timescale of forming a high-density cloud is comparable to the free-fall timescale, low-mass stars will form first when the cloud density is high enough, and they may prevent the formation of high-mass stars (Fukui et al., 2020). Therefore, high-density clouds have to be formed in a time much shorter than the free-fall time. Rapid external compression provides an alternative scenario for creating such high-density clouds in a very short time (Zinnecker & Yorke, 2007).
Cloud-cloud collisions (CCCs) can result in the rapid accumulation of cloud mass into a small volume and form massive star-forming clumps within the shock interface (Inoue & Fukui, 2013; Takahira et al., 2014, 2018; Fukui et al., 2020). This provides a promising mechanism that can explain isolated or asymmetric O-star formation and the production of dense and massive clumps forming high-mass stars (Fukui et al., 2020). Previous observations have identified more than 50 high-mass star formation regions with collisional features, but more studies are needed to fully understand the detailed properties of colliding clouds and the high-mass star formation triggered by the CCCs.
The G323.18+0.15 complex (see Fig.1) has been studied as component F in the G323 region using data from the Mopra 22m single-dish telescope survey of the southern Galactic plane (Burton et al., 2013). The results suggest that the G323.18+0.15 complex has a system velocity of -65 km s-1 and a distance of 4.8 kpc. Its gas mass and column density are about 1.9 104 M⊙ and 9.4 1021 cm-2. However, the kinematics of the region has not been studied in detail.
In this paper, we study the kinematics of the G323.18+0.15 complex. We suggest that it may be a good candidate of a CCC complex. We describe the data we used in Sect. 2 and present the physical parameters of the cloud region in Sect. 3. Sect. 4 discusses the evidence of CCCs and the possible effects from an associated HII region. Finally, Sect. 5 gives the conclusion of our work.
2 Archive data
2.1 12CO and 13CO data
For a kinematic analysis, data of the Structure, Excitation and Dynamics of the Inner Galactic Interstellar Medium (SEDIGISM***This publication is mainly based on data acquired with the Atacama Pathfinder EXperiment (APEX) under programs 092.F-9315(A) and 193.C-0584(A). APEX is a collaboration between the Max-Planck-Institut für Radioastronomie, the European Southern Observatory, and the Onsala Space Observatory. The processed data products are available from the SEDIGISM survey database located at https://sedigism.mpifr-bonn.mpg.de/index.html, which was constructed by James Urquhart and is hosted by the Max-Planck-Institut für Radioastronomy.) survey have been used (Schuller et al., 2021). This survey mapped 84 deg2 of the Galactic plane (, ) with the Atacama Pathfinder Experiment (APEX) telescope in several molecular transitions, including 13CO ( = 2–1) and C18O ( = 2–1). The angular resolution of SEDIGISM is , and the 1 sensitivity is about 0.8–1.0 K for a 0.25 km s-1 channel width. The 12CO ( = 1–0) data from the Mopra 22m single-dish telescope survey of the southern Galactic plane (Burton et al., 2013) has also been used, which has a spatial resolution of and the 1 sensitivity of 1.5 K per 0.1 km s-1 velocity channel.
2.2 IR and radio data
We used the image data from the Galactic Legacy Infrared Mid-Plane Survey Extraordinaire (GLIMPSE) (Churchwell et al., 2009) to derive the mid-infrared emission at 3.6, 4.5, 5.8, and 8 m. The 5 sensitivities at the four bands are 0.2, 0.2, 0.4, and 0.4 mJy, respectively. The corresponding angular resolutions are between and (Fazio et al., 2004). We also used the image data from the Multiband Infrared Photometer for Spitzer MIPS Galactic Plane Survey (MIPSGAL) (Carey et al., 2009) at 24 and 70 m with a 5 sensitivity of 1.7 mJy and with corresponding resolutions of and , respectively (Rieke et al., 2004).
We used Herschel Infrared Galactic Plane Survey (Hi-GAL , Molinari et al. (2010)) data to derive the dust temperature and column density distributions. Hi-GAL is a key project of the 3.5 m orbiting Herschel telescope as it mapped the entire Galactic plane within at five bands. The angular resolutions of these Herschel maps are approximately , , , , and at 70, 160, 250, 350, and 500 m, respectively.
The 1.4 GHz radio continuum emission data from the Southern Galactic Plane Survey (SGPS, Haverkorn et al. (2006)) were used to trace HII regions, which was observed with the Australia Telescope Compact Array and the Parkes 64 m single-dish telescope. The survey spans a Galactic longitude of 253 and a latitude of at a resolution of and a sensitivity below 1 mJy beam-1.
2.3 Catalogs
The APEX Telescope Large Area Survey of the Galaxy (ATLASGAL) dense clump catalog (Urquhart et al., 2018) and the Herschel Hi-GAL clump catalog (Elia et al., 2017) were used to trace dense clumps. The GLIMPSE Point-Source catalog (GPSC) is used to trace the young stellar objects (YSOs).
3 Results
3.1 G323.18+0.15 complex
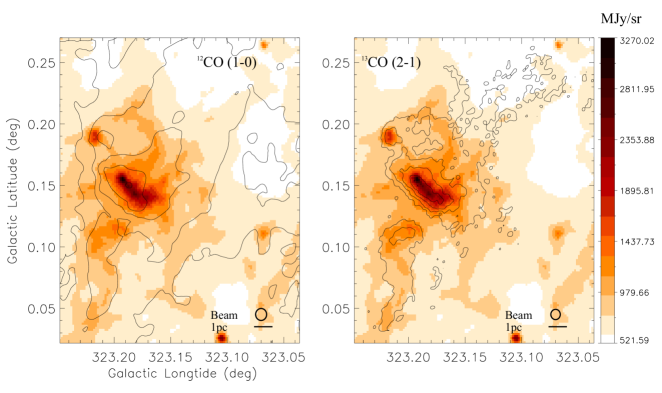
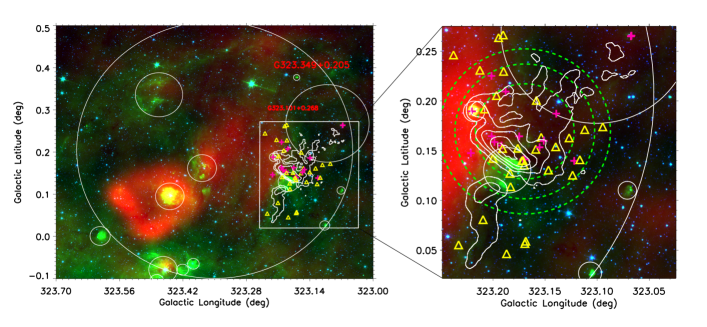
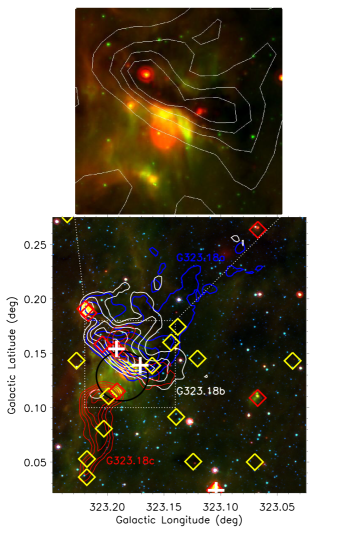
The distributions of the integrated 12CO (1–0) and 13CO(2–1) emission of the G323.18+0.15 complex are shown on a background of the 250 m dust emission in Fig. 1. The distributions of 12CO ( = 1–0) and 13CO ( = 2–1) agree well with that of the 250 m dust emission. The 13CO ( = 2–1) map of the G323.18+0.15 complex shows separate northwestern and southeastern components, while the 12CO ( = 1–0) map shows that these components are connected to each other. Fig. 2 presents more observation results of the G323.18+0.15 complex (right panel) and nearby HII regions (left panel) at different wavelengths. White circles denote the HII regions identified by Anderson et al. (2014), and red background traces the 21cm continuum emission. The HII region G323.187+00.129 is right in between the northwestern and southeastern components of the G323.18+0.15 complex. The 8 m emission appears in all HII regions. In the region we studied, class I (pink crosses) and class II (yellow triangles) YSOs mainly lie on the G323.18+0.15 complex or nearby it.
Considering the high resolution and good data quality of 13CO ( = 2–1), we mainly used 13CO ( = 2–1) in the following analysis. Using the system velocity -65.75 km s-1 derived from the averaged 13CO ( = 2–1) spectrum of the G323.18+0.15 complex and the new kinematic distance estimator†††http://bessel.vlbi-astrometry.org/node/378 developed by Reid et al. (2019), we obtain a distance of about kpc. This is smaller than the earlier distance of 4.8 kpc obtained by Burton et al. (2013). Because the latest distance estimator is based on the much improved rotation curve of the Galaxy, we use the newer distance of G323.18+0.15 complex in this work.
3.2 Column density and dust temperature
First, we removed the background emission from the image data at different bands separately. Then we used the kernels provided by Aniano et al. (2011) to convolve all images at 70, 160, 250, and 350 m to the angular resolution at 500 m. Finally, we regridded all images at five bands to the same pixel size (), and performed a spectral energy distribution fit pixel by pixel with the PYTHON package HIGAL-sed-fitter‡‡‡http://hi-gal-sed-fitter.readthedocs.org. The code is based on a modified blackbody model,
| (1) |
where the Planck function is modified by the optical depth (Kauffmann et al., 2008),
| (2) |
where = 2.8 is the mean molecular weight, is the mass of a hydrogen atom, the gas to-dust ratio is = 100, and is the H2 column density. The dust opacity (Ossenkopf & Henning, 1994) is
| (3) |
and the dust emissivity index was fixed to 1.75 in the fitting (Wang et al., 2015).
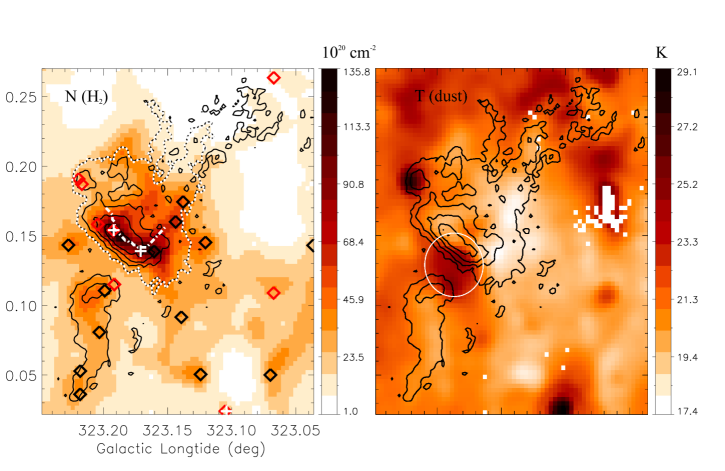
The derived column density () and dust temperature are shown in Fig. 3. varies from to cm-2 with a mean value of cm-2. The densest structure was identified as filament G323.179+0.149 by Li et al. (2016). We plot its skeleton as the dot-dashed white line in Fig 3. Twenty-one highly reliable clumps from the Herschel Hi-GAL clump catalog (Elia et al., 2017) and three clumps from the ATLASGAL dense clump catalog (Urquhart et al., 2018) are located in the region we studied (their evolutionary stages and parameters are listed in table. 1). Because HIGALBM323.1050+0.0241 and AGAL323.104+0.024, HIGALBM323.1923+0.1539 and AGAL323.192+0.154 are the identical sources, there are a total of 22 clumps in the region we studied.
The dust temperature of the G323.18+0.15 complex is relatively low (right panel of Fig. 3). This is especially true for the northwestern part. The HII region G323.187+00.129, located between the northwestern and southeastern part, which was identified by Anderson et al. (2014), has a higher temperature.
3.3 Structure and kinematics
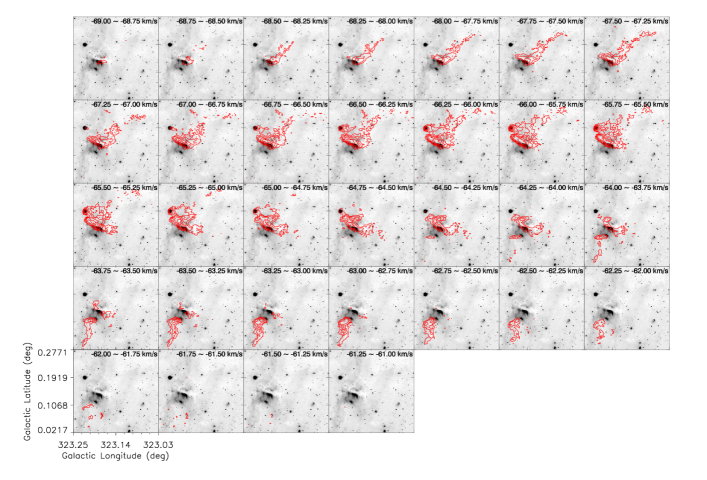
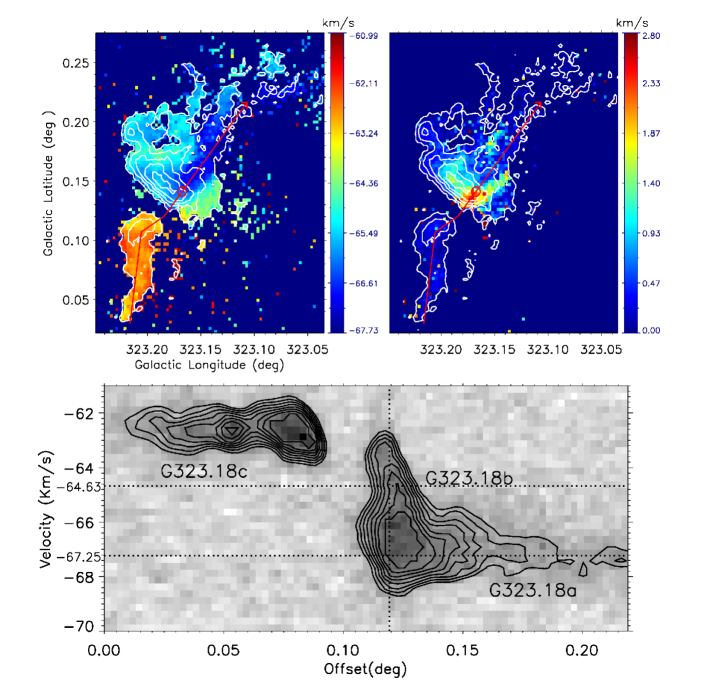
The 13CO ( = 2–1) velocity channel maps in Fig. 4 suggest the presence of three cloud components in the G323.18+0.15 complex with different velocities: G323.18a with a velocity range from to km s-1, the U-shaped structure G323.18b with a velocity range from to km s-1, and G323.18c with a velocity range from to km s-1. The system velocities of G323.18a, G323.18b, and G323.18c are estimated to be -67.25, -64.63, and -63 km s-1, respectively. The intensity-weighted velocity field of the 13CO ( = 2–1) emission (top left panel of Fig. 5) also shows the same three components.
Figure 6 shows the velocity-integrated intensity map of 13CO ( = 2–1) for G323.18a, G323.18b, and G323.18c. It clearly shows the locations and structures of these three molecular cloud components. G323.18b appears to be a perfect U-shape structure with a compressed layer (the filament G323.179+0.149; Li et al. (2016)) with high-mass clumps in which high-mass stars are expected to form. The highest velocity dispersion also appears in the compressed layer, implying that there is strong turbulent activity (see the top right panel of Fig. 5). G323.18a is complementary to G323.18b. Some 13CO ( = 2–1) emission of G323.18c appears at the location of G323.18b, and the HII region G323.187+00.129 interacts with both G323.18b and G323.18c. This indicates that G323.18b and G323.18c are connected to each other. 12CO ( = 1–0) in Fig. 1 also shows that they are in the same molecular cloud. As seen in the partially enlarged plot at the top of Fig. 6, the green 8 m emission seems to be blowing out at the southeastern side of the dark filament, and the red 24 m emission appears close to the southeastern side of the dark filament. High-mass stars appear to be forming in the compressed layer and contribute to exciting the HII region G323.187+00.129 (Anderson et al., 2014). Most of the strong 8 and 24 m emission seems to be wrapped inside G323.18b, which also supports this idea.
We show the 13CO ( = 2–1) position-velocity (PV) diagram in the bottom panel of Fig. 5. The PV slice is extracted along the red line labeled in the top panels of Fig. 5 and shows that G323.18c is separated from G323.18a and G323.18b, which may be because HII region G323.187+00.129 (Anderson et al., 2014) blows off diffuse gas between them. The vertical dotted line along the offset axis corresponds to the position of the red circle on the red line in the top panels of Fig. 5, which identifies the compressed layer, that is, the interface between G323.18a and G323.18b. Strong CO emission appears between the system velocities of G323.18a and G323.18b, indicating that most of the CO from these two clouds is sufficiently mixed in the compressed layer.
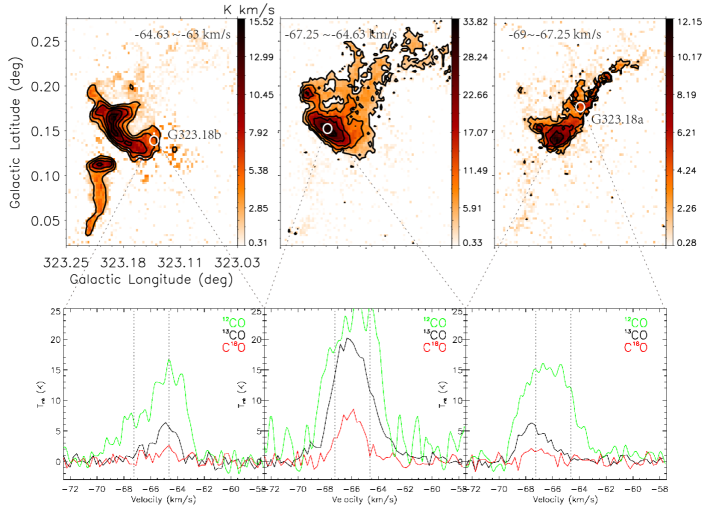
The upper panels of Fig. 7 show the integral intensity maps of 13CO ( = 2–1) corresponding to the velocity ranges from -64.63 to -63 km s-1 (left panel), -67.25 to -64.63 km s-1 (middle panel), and -69 to -67.25 km s-1 (right panel). Their morphology indicates that the two clouds in the left and right panels may be interacting with each other, while the cloud in the middle panel is the result of this interaction. The lower panels show a 3 12CO ( = 1–0), 1.5 13CO ( = 2–1), and 1.5 O ( = 2–1) spectrum extracted at the positions indicated by the white circles in the corresponding upper panels. The 13CO and C18O spectra in the right and left panels peak at the estimated system velocities of -67.25 (G323.18a) and -64.63 km s-1 (G323.18b), while the 13CO and C18O spectra in the middle panel peak at an intermediate velocity between these two system velocities. This is consistent with the above result, that is, the cloud in the middle panel is formed through an interaction between the two clouds in the left and right panels, which causes the two initial clouds to appear as a single-peaked continuous cloud.
Two additional components lie at -52 and -30 km s-1, which are partly overlaid on G323.18b in projection. Because they are very weak and their velocities are very different from that of the G323.18+0.15 complex, we assume that these two components just happened to be superimposed on the G323.18+0.15 complex along the line of sight, and we do not show them here.
3.4 YSOs
The multiphase source classification scheme, a slightly modified version of the Gutermuth et al. (2009), has been used to identify YSOs (Zhou et al., 2020; Liu et al., 2015) (see Appendix A for details). A total of 16 class I and 30 class II YSOs have been found in the region we studied (see Fig.2). Almost all class I YSOs are located in the U-shape structure G323.18b, while the class II YSOs around the U-shape structure also display an arc-like distribution. However, some class II YSOs may be associated with the HII regions near the G323.18+0.15 complex (see Fig. 2 and the discussion in sect. 4.4).
4 Discussion
4.1 Signatures of CCCs
First, we examined whether G323.18a and G323.18b are gravitationally bound as one structure. The virial mass was determined using the expression (Pillai et al., 2011; Issac et al., 2020)
| (4) |
where is the effective radius of the cloud and is the velocity dispersion. Both and were obtained using the 13CO ( = 2–1) line. is thought of as (, where = 26.46 5 pc2 is the area used to derive the cloud mass using the area marked with the dotted white line in left panel of Fig. 3. This results in a value of = pc. From a Gaussian fit of the averaged 13CO spectrum of the cloud, we obtained the line width V ~3.6 km s-1. This results in a value for the velocity dispersion of 1.5 km s-1. Using these values, we computed the virial mass as M⊙. The total gas mass of G323.18a and G323.18b was calculated using the expression
| (5) |
where the mean molecular weight is 2.8, the mass of hydrogen atom is g, = (3.7 0.9) cm2 is one pixel area, and is obtained from the spectral energy distribution fit. We obtain a gas mass of 2.84 ( 0.5) M⊙, which is lower than the virial mass. This means that G323.18a and G323.18b as a whole cloud are not gravitational bound, which suggests that an accident has triggered the ongoing star formation, for instance, a cloud-cloud collision. We discuss the potential characteristic features of the CCC in the G323.18+0.15 complex in the following subsections, including the complementary distribution with displacement, the U-shape, the bridge and the fist moment distribution (Fukui et al., 2018, 2020).
4.1.1 Complementary distribution and U-shape
As shown in Fig. 6, G323.18b displays a perfect U-shape structure, and the cloud G323.18a complements the U-shape structure well. These two characteristic features suggest that G323.18a indeed collides with G323.18b. Based on the channel map shown in Fig. 4, we estimate the systemic velocities of G323.18a and G323.18b to be and km s-1. The actual collision velocity might be higher because of projection effects. As propounded by Issac et al. (2020), Inoue & Fukui (2013), and Fukui et al. (2015), independent of the angle of two colliding clouds, the isotropic turbulence is enhanced at the collision-shocked layer. This is consistent with the fact that the velocity dispersion increases greatly along the U-shape structure (see the top right panel of Fig. 5).
4.1.2 Bridge
Simulations of Haworth et al. (2015a, b) suggested that a broad intermediate-velocity feature that bridges between two colliding clouds will appear in a PV diagram. The bridge feature probes the turbulent motion of the gas enhanced by the collision and often appears at the spots of collisions (Issac et al., 2020; Gong et al., 2017). The increased velocity dispersion along the U-shape, especially at the bottom where the compressed layer formed (see the top right panel of Fig. 5), suggests that the compressed layer is the interface of the collision between G323.18a and G323.18b. The bridge feature with an intermediate velocity between and km s-1 is clearly visible in the PV diagram of G323.18+0.15 in the bottom panel of Fig. 5. The significant bridge feature indicates that G323.18a has interacted with G323.18b and that most of the gas of these two clouds has been compressed into the dense layer at the bottom of U-shape. This idea is also supported by the fact that both 13CO and C18O spectrum from the compressed layer exhibit a single-peak profile between the velocity and km s-1 (see Fig.7). G323.18b and G323.18a may be in a later stage of CCC. They are very close to each other, and the bridge appears as the efficiently mixed gas of G323.18a and G323.18b.
4.1.3 Distribution of the first moment
Fukui et al. (2018) showed simulation results of one small spherical cloud colliding with another large spherical cloud. If the viewing angle between the line of sight and the direction of the collision is or , the small cloud will appear in the center of the large cloud in the first-moment map. If the viewing angle is , a compressed layer forms (see their Figures 4, 5, 6 and 7). However, this may be not true when the colliding clouds are not spherical. Both G323.18a and G323.18b appear in the first-moment map of 13CO ( = 2–1) (see the top left panel of Fig. 5), and G323.18a displays an extended filamentary structure that connects it to G323.18b. This suggests that our viewing angle is not and that G323.18a is a filamentary cloud before it collides. Considering that the velocity variation at the interface is relatively small (the bottom panel of Fig. 5) and because the compressed layer at the interface between the two clouds appears as a filament, our viewing angle may be close to ,
4.2 Induced filament, fragmentation of clumps, and star formation
Hydrodynamic simulations (Habe & Ohta, 1992; Anathpindika, 2010) suggest that the site of a CCC can be characterized by a shock-compressed layer resulting from a bow shock that is driven by the smaller cloud into the larger cloud. In the case of the G323.18+0.15 complex, the shock-compressed layer manifests itself as an open U-shape structure. This U-shape structure has a higher H2 column density than the ambient medium, as shown in Fig. 3. The compressed layer at the bottom of the U-shape structure is perpendicular to the direction of the collision.
The region we studied contains 22 clumps (see sect. 3.2). Thirteen of these 22 clumps are located in the G323.18+0.15 complex (Figs. 3 and 6), that is, the area covered by 13CO ( = 2–1) emission with a signal-to-noise ratio S/N¿3. Their diameters and masses were recalculated using a distance of 3.55 kpc. The masses of these clumps range from 12.65 to 1.7 and the diameters range from 0.2 to 0.5 pc. Twenty-one clumps have surface densities above the threshold of 0.05 g cm-2 (Urquhart et al., 2014) (see table. 1), and they are likely able to form high-mass stars.
A total of 46 YSOs may been found in the whole region we studied using the GPSC (Fig. 2). Eleven of the 16 class I YSOs and 15 of the 30 class II YSOs are located in G323.18+0.15 and in the area covered by 13CO ( = 2–1) emission with S/N¿3. Three dashed green circles are plotted in Fig. 2, where the areas of the circle and two annuli are the same as the area that is covered by the molecular clouds G323.18a and G323.18b. The average surface densities of class I and II YSOs in the innermost circle are 0.39 arcmin-2 and 0.58 arcmin-2, respectively, but they are 0.16 and 0.19 arcmin-2 in the first annulus, and 0 and 0.08 arcmin-2 in the second annulus. It is evident that the surface density of YSOs in the interaction region is much higher.
Following Issac et al. (2020), we used the full width at half maximum (FWHM) (3.56 km s-1) of the 13CO ( = 2–1) line extracted from the compressed layer to estimate the relative collision velocity, and calculated the collision timescale of cloud G323.18a and G323.18b. With a cloud size 5.8 pc, a collision timescale of Myr is derived as an order-of-magnitude estimate. This value may vary by a factor of 2 owing to projection effects in space and velocity and to the unknown configuration of the clouds before the collision (Fukui et al., 2014). For comparison, the ages of class I and II YSOs are 0.4 – 0.7 Myr and Myr, respectively (Evans et al., 2009; Dunham et al., 2015; Issac et al., 2020). Our collision timescale of 1.59 Myr exceeds the age of a class I YSO, but would be comparable to that of a class II YSO. This suggests that most YSOs in the G323.18+0.15 complex could have formed as a result of the collision between G323.18a and G323.18b, especially for class I YSOs. To some extent, this is consistent with the hypothesis that a collision triggered the YSOs formation.
4.3 CCC scenario for the G323.18+0.15 complex
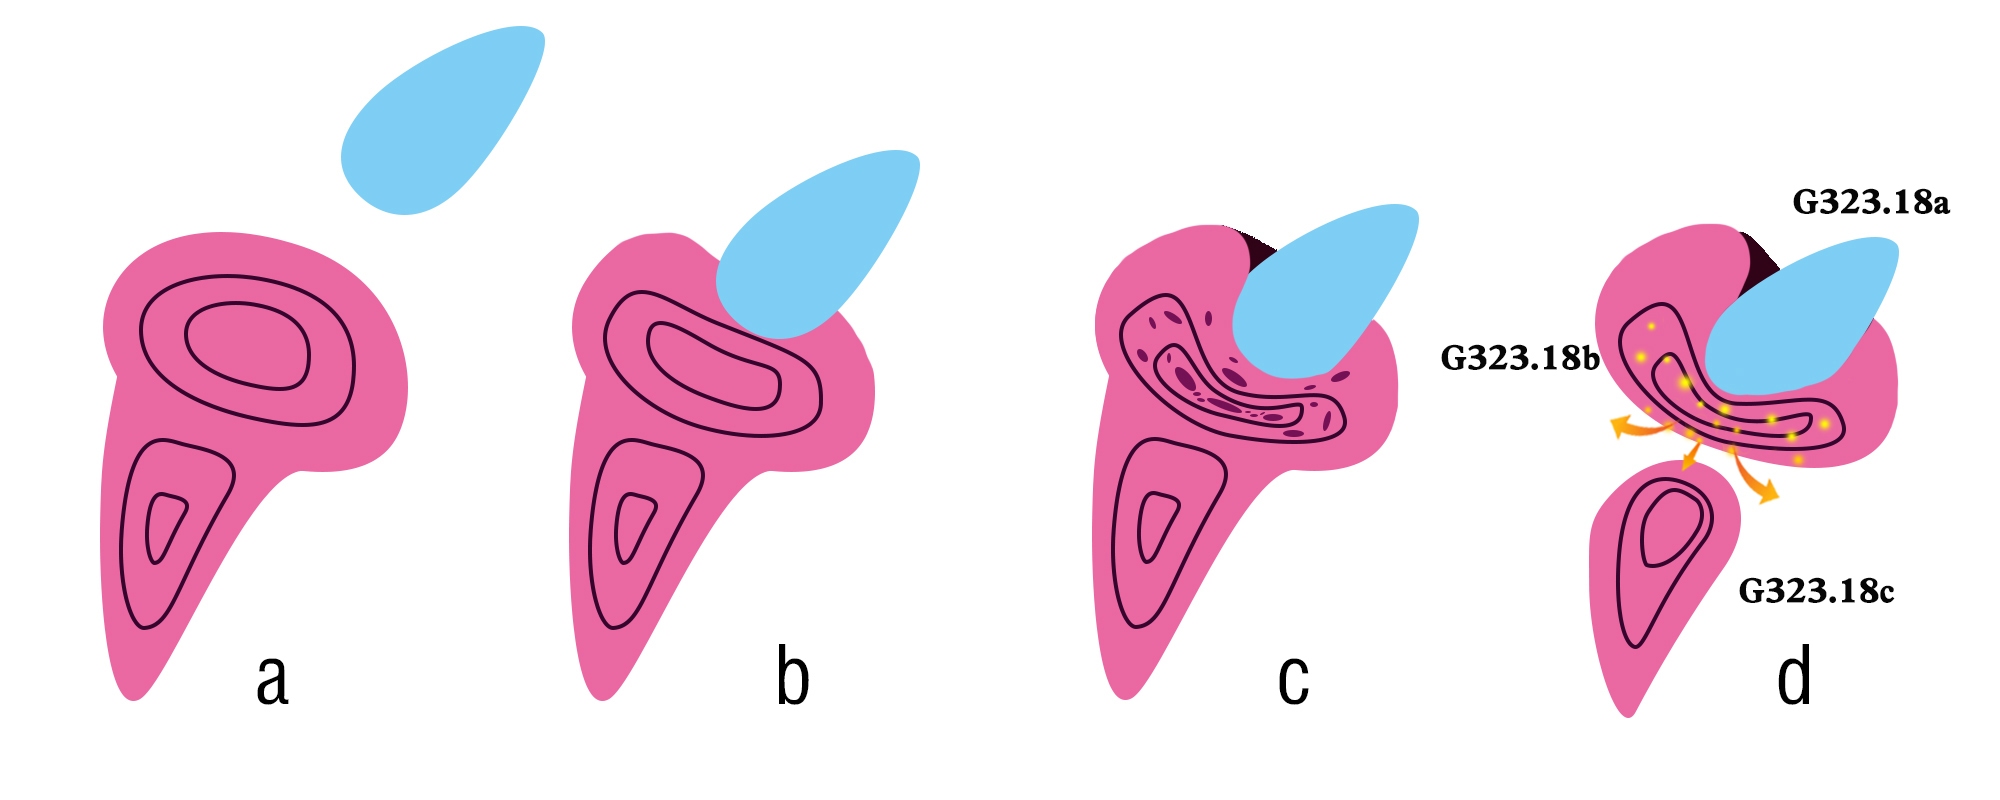
The images in Fig. 8 presents a schema for the evolutionary development of the three cloud components G323.18a, G323.18b, and G323.18c in the G323.18+0.15 complex. Our results suggest that G323.18b and G323.18c belong to the same filamentary cloud and that G323.18a collides with G323.18b. In Fig. 8a, G323.18a comes from the northwestern direction and approaches the filamentary cloud structure, which consists of G323.18b and G323.18c. In Fig. 8b and Fig. 8c, G323.18a collides with G323.18bc and forms a U-shape structure and a compressed dense layer at the bottom of G323.18b. The colliding direction seems to be nearly perpendicular to our line of sight. High-mass stars are forming within the dense layer, and together, they form an HII region that provides strong feedback that first breaks through the parent cloud from the southeastern side of the filament and heats and blows off diffuse gas between G323.18b and G323.18c (Fig. 8d).
4.4 Possible effect from HII regions
Although we find characteristic features of a CCC in G323.18+0.15, it is difficult to fully rule out other possibilities. There are five HII regions in the region we studied, as identified by Anderson et al. (2014) (see Fig. 2). In projection, the G323.18+0.15 complex lies to the west of the largest HII region G323.349+0.205 (traced by the largest white circle), and is close to the HII region G323.101+0.268 (traced by the second largest white circle). The G323.18+0.15 complex seems to be on the rim of the 21 cm continuum emission. However, the velocity distribution in the top right panel of Fig. 5 does not show an increasing velocity gradient along the expanding direction of the HII region (from east to west). Fig. 2 shows that almost all class I YSOs lie along the U-shape structure G323.18b. Most class II YSOs are located in or nearby the region covered by G323.18ab. They do not lie along the left side of complex G323.18+0.15, where interaction may have taken place. This indicates that the largest HII region may not strongly interact with complex G323.18+0.15, but we cannot rule out the possibility that some class II YSOs may be formed due to triggered star formation induced by the largest HII region. The G323.18+0.15 complex as a whole shows a filamentary structure that is nearly parallel to the expanding direction of the second largest HII region (Fig. 2). G323.18a is closest to the HII region and shows no evidence of being compressed by it, while G323.18b and G323.18c are far away from it. Therefore complex G323.18+0.15 is probably not affected by the second largest HII region.
Due to the presence of the HII region in between filaments G323.18c and G323.18ab, we have to consider that the compression could be caused by the expansion of this HII region into the gas. The HII region G323.187+00.129 has a size of about 2.84 pc. Our study of small bubbles with similar size, N22 (Ji et al., 2012) and N10 (Ma et al., 2013), suggests that the region may have a kinematic age younger than 1 Myr. The collect-and-collapse model of triggered star formation may not work for the HII region G323.187+00.129, that is, it has not had enough time to collect the surrounding materials and form compressed layers, and then to collapse to form clumps or cores and stars. As Fig. 6 shows, G323.18ab covers nearly half of the HII region in projection, but no compressed CO or dust shells appear along the edge of the HII region. However, the northwestern part of G323.18c shows some evidence of being compressed by the HII region. This is consistent with the idea we described in sect. 4.3.
5 Conclusions
The structure and kinematics of the G323.18+0.15 complex has been studied, and strong evidence is found that supports the hypothesis that a CCC occurred between the cloud components G323.18a and G323.18bc. Our results are listed below.
-
1.
The G323.18a - G323.18b structure as a whole is probably not gravitationally bound, suggesting that any star formation in these clouds has been triggered by an accident. A reasonable explanation is that the smaller cloud G323.18a collides with the larger cloud G323.18bc, which forms a U-shape structure and a dense compressed layer in G323.18b. The column density of the compressed layer is estimated at cm-2, which satisfies the threshold condition for forming high-mass stars.
-
2.
G323.18b appears as a perfect U-shape structure showing an enhanced velocity dispersion. The shape of the G323.18a structure complements the U-shape structure found in G323.18b. Except for these two typical features of a CCC, the bridge feature with an intermediate velocity between G323.18a and G323.18b also supports the hypothesis that they collide.
-
3.
A total of 46 YSOs were found to be distributed in the region we studied. The average surface density of class I and class II YSOs in the region covered by G323.18a and G323.18b is about 0.39 and 0.58 arcmin-2, respectively, which is much higher than for the surrounding regions. The timescale of the collision of G323.18a and G323.18b is estimated to be 1.59 Myr, which is longer than the typical lifetime of class I YSOs and is comparable to the lifetime of class II YSOs. Almost all class I YSOs are associated with the U-shape structure and suggest a CCC-related origin.
| Name | Diam | Mass | Evol | in/out | Diam(new) | Mass(new) | surface density |
|---|---|---|---|---|---|---|---|
| pc | M⊙ | pc | M⊙ | g cm-2 | |||
| HIGALBM323.0365+0.1431 | 1.158 | 425.61 | prestellar | out | |||
| HIGALBM323.0672+0.2635 | 0.471 | 409.01 | protostellar | out | |||
| HIGALBM323.0673+0.1090 | 1.270 | 1079.55 | protostellar | out | |||
| HIGALBM323.0698+0.0501 | 1.463 | 2190.30 | prestellar | out | |||
| HIGALBM323.1050+0.0241 | 0.816 | 510.81 | prestellar | out | |||
| (AGAL323.104+0.024) | |||||||
| HIGALBM323.1205+0.1452 | 1.151 | 1436.53 | prestellar | out | |||
| HIGALBM323.1243+0.0505 | 1.885 | 5153.03 | prestellar | out | |||
| HIGALBM323.1379+0.1743 | 0.481 | 307.05 | prestellar | in | 0.393 | 204.97 | 0.35 |
| HIGALBM323.1393+0.0916 | 1.079 | 1063.05 | prestellar | out | |||
| HIGALBM323.1437+0.1600 | 0.921 | 1771.21 | prestellar | in | 0.350 | 256.37 | 0.56 |
| HIGALBM323.1605+0.1387 | 1.392 | 11753.03 | prestellar | in | 0.530 | 1701.18 | 1.62 |
| HIGALBM323.1915+0.1151 | 1.157 | 508.43 | protostellar | in | 0.439 | 73.28 | 0.10 |
| HIGALBM323.1923+0.1539 | 0.614 | 535.31 | protostellar | in | 0.233 | 77.15 | 0.38 |
| (AGAL323.192+0.154) | |||||||
| HIGALBM323.1990+0.1106 | 0.916 | 1483.38 | protostellar | in | 0.348 | 213.79 | 0.47 |
| HIGALBM323.2032+0.0808 | 1.538 | 1350.40 | prestellar | in | 0.464 | 122.81 | 0.15 |
| HIGALBM323.2044+0.1582 | 0.530 | 314.52 | protostellar | in | 0.201 | 45.33 | 0.30 |
| HIGALBM323.2168+0.1870 | 1.567 | 134.32 | protostellar | in | 0.481 | 12.65 | 0.01 |
| HIGALBM323.2181+0.0529 | 1.697 | 1102.78 | prestellar | in | 0.512 | 100.29 | 0.10 |
| HIGALBM323.2182+0.0362 | 1.445 | 1626.27 | prestellar | in | 0.436 | 147.89 | 0.21 |
| HIGALBM323.2194+0.1907 | 1.479 | 1014.20 | protostellar | in | 0.454 | 95.50 | 0.12 |
| HIGALBM323.2273+0.1433 | 1.119 | 3038.81 | prestellar | out | |||
| AGAL323.171+0.139 | 0.468 | 749.89 | YSO | in | 0.413 | 584.79 | 0.92 |
Acknowledgements.
The authors thank the anonymous referee for helpful comments. This work was mainly funded by the National Natural Science foundation of China (NSFC) under grant No.11973076. It was also partially supported by the NSFC under grant Nos.11433008, 11903070, 12173075, and 12103082, the Heaven Lake Hundred Talent Program of Xinjiang Uyghur Autonomous Region of China, the Natural Science Foundation of Xinjiang Uygur Autonomous Region under grant No. 2022D01E06, and the CAS Light of West China Program under grant Nos. 2020-XBQNXZ-017 and 2021-XBQNXZ-028. D. L. Li has been funded by Youth Innovation Promotion Association CAS and Tianshan Innovation Team Plan of Xinjiang Uygur Autonomous Region (2022D14020). Y. X. has been funded by High Level Talent Heaven Lake Program of Xinjiang Uyghur Autonomous Region of China. W. B. has been funded by Chinese Academy of Sciences President’s International Fellowship Initiative by Grant No. 2021VMA0008.References
- Anathpindika (2010) Anathpindika, S. V. 2010, MNRAS, 405, 1431
- Anderson et al. (2014) Anderson, L. D., Bania, T. M., Balser, D. S., et al. 2014, ApJS, 212, 1
- Aniano et al. (2011) Aniano, G., Draine, B. T., Gordon, K. D., & Sandstrom, K. 2011, PASP, 123, 1218
- Ascenso (2018) Ascenso, J. 2018, in Astrophysics and Space Science Library, Vol. 424, The Birth of Star Clusters, ed. S. Stahler, 1
- Bonnell et al. (2001) Bonnell, I. A., Bate, M. R., Clarke, C. J., & Pringle, J. E. 2001, MNRAS, 323, 785
- Burton et al. (2013) Burton, M. G., Braiding, C., Glueck, C., et al. 2013, PASA, 30, e044
- Carey et al. (2009) Carey, S. J., Noriega-Crespo, A., Mizuno, D. R., et al. 2009, PASP, 121, 76
- Churchwell et al. (2009) Churchwell, E., Babler, B. L., Meade, M. R., et al. 2009, PASP, 121, 213
- Dunham et al. (2015) Dunham, M. M., Allen, L. E., Evans, Neal J., I., et al. 2015, ApJS, 220, 11
- Elia et al. (2017) Elia, D., Molinari, S., Schisano, E., et al. 2017, MNRAS, 471, 100
- Evans et al. (2009) Evans, Neal J., I., Dunham, M. M., Jørgensen, J. K., et al. 2009, ApJS, 181, 321
- Fazio et al. (2004) Fazio, G. G., Hora, J. L., Allen, L. E., et al. 2004, ApJS, 154, 10
- Fukui et al. (2020) Fukui, Y., Habe, A., Inoue, T., Enokiya, R., & Tachihara, K. 2020, PASJ[arXiv:2009.05077]
- Fukui et al. (2015) Fukui, Y., Harada, R., Tokuda, K., et al. 2015, ApJ, 807, L4
- Fukui et al. (2014) Fukui, Y., Ohama, A., Hanaoka, N., et al. 2014, ApJ, 780, 36
- Fukui et al. (2018) Fukui, Y., Torii, K., Hattori, Y., et al. 2018, ApJ, 859, 166
- Gong et al. (2017) Gong, Y., Fang, M., Mao, R., et al. 2017, ApJ, 835, L14
- Gutermuth et al. (2009) Gutermuth, R. A., Megeath, S. T., Myers, P. C., et al. 2009, ApJS, 184, 18
- Habe & Ohta (1992) Habe, A. & Ohta, K. 1992, PASJ, 44, 203
- Haverkorn et al. (2006) Haverkorn, M., Gaensler, B. M., McClure-Griffiths, N. M., Dickey, J. M., & Green, A. J. 2006, ApJS, 167, 230
- Haworth et al. (2015a) Haworth, T. J., Shima, K., Tasker, E. J., et al. 2015a, MNRAS, 454, 1634
- Haworth et al. (2015b) Haworth, T. J., Tasker, E. J., Fukui, Y., et al. 2015b, MNRAS, 450, 10
- Inoue & Fukui (2013) Inoue, T. & Fukui, Y. 2013, ApJ, 774, L31
- Issac et al. (2020) Issac, N., Tej, A., Liu, T., & Wu, Y. 2020, MNRAS, 499, 3620
- Ji et al. (2012) Ji, W. G., Zhou, J. J., Esimbek, J., et al. 2012, A&A, 544, A39
- Kauffmann et al. (2008) Kauffmann, J., Bertoldi, F., Bourke, T. L., Evans, N. J., I., & Lee, C. W. 2008, A&A, 487, 993
- Krumholz et al. (2012) Krumholz, M. R., Klein, R. I., & McKee, C. F. 2012, ApJ, 754, 71
- Krumholz et al. (2009) Krumholz, M. R., Klein, R. I., McKee, C. F., Offner, S. S. R., & Cunningham, A. J. 2009, Science, 323, 754
- Li et al. (2016) Li, G.-X., Urquhart, J. S., Leurini, S., et al. 2016, A&A, 591, A5
- Liu et al. (2015) Liu, H.-L., Wu, Y., Li, J., et al. 2015, ApJ, 798, 30
- Ma et al. (2013) Ma, Y., Zhou, J., Esimbek, J., et al. 2013, Ap&SS, 345, 297
- McKee & Tan (2002) McKee, C. F. & Tan, J. C. 2002, Nature, 416, 59
- Molinari et al. (2010) Molinari, S., Swinyard, B., Bally, J., et al. 2010, PASP, 122, 314
- Ossenkopf & Henning (1994) Ossenkopf, V. & Henning, T. 1994, A&A, 291, 943
- Pillai et al. (2011) Pillai, T., Kauffmann, J., Wyrowski, F., et al. 2011, A&A, 530, A118
- Reid et al. (2019) Reid, M. J., Menten, K. M., Brunthaler, A., et al. 2019, ApJ, 885, 131
- Rieke et al. (2004) Rieke, G. H., Young, E. T., Engelbracht, C. W., et al. 2004, ApJS, 154, 25
- Schuller et al. (2021) Schuller, F., Urquhart, J. S., Csengeri, T., et al. 2021, MNRAS, 500, 3064
- Takahira et al. (2018) Takahira, K., Shima, K., Habe, A., & Tasker, E. J. 2018, PASJ, 70, S58
- Takahira et al. (2014) Takahira, K., Tasker, E. J., & Habe, A. 2014, ApJ, 792, 63
- Urquhart et al. (2018) Urquhart, J. S., König, C., Giannetti, A., et al. 2018, MNRAS, 473, 1059
- Urquhart et al. (2014) Urquhart, J. S., Moore, T. J. T., Csengeri, T., et al. 2014, MNRAS, 443, 1555
- Wang et al. (2015) Wang, K., Testi, L., Ginsburg, A., et al. 2015, MNRAS, 450, 4043
- Zhou et al. (2020) Zhou, J., Zhou, D., Esimbek, J., et al. 2020, ApJ, 897, 74
- Zinnecker & Yorke (2007) Zinnecker, H. & Yorke, H. W. 2007, ARA&A, 45, 481
Appendix A Young star classification
First, we selected the candidates that are located in the G323.18+0.15 complex and have photometric detections in all four IRAC bands () from the GLIMPSE I Spring 07 highly reliable catalog. Then we removed sources contaminated by polyciclic aromatic hydrocarbons according to the constraints from Gutermuth et al. (2009): and , where and . Finally, we identified 16 class I YSOs following the constraints [4.5]-[5.8] ¿ 0.7 and [3.6]-[4.5] ¿ 0.7, and 12 class II YSOs following the constraints , , , and , where and . Four sources lack detections at either 5.8 or 8.0 m but with 3.6 and 4.5 m with and H and K bands from 2MASS with in our region. We identified 24 class II YSOs following the constraints , , + 0.5 , and where and (Gutermuth et al. 2009). We used MIPS with magnitude [24] ¡ 7 ( ¡ 0.2 mag) to identify transition disks (TDs) following the criteria [5.8]-24] ¿ 2.5 or [4.5]-24] ¿ 2.5, and [3.6] ¡ 14. The TDs are classified as sources in an evolutionary stage between class II and class III (Gutermuth et al. 2009), but no TD was found in our G323.18+0.15 complex. The absence of a TD suggests that star formation in G323.18+0.15 is in its early stage, and perhaps the CCC between G32.18a and G323.18b led to a rapid increase of mass at the interface of the collision, and was followed by star formation in a short time.