From Pedestrian Detection to Crosswalk Estimation: An EM Algorithm and Analysis on Diverse Datasets
Abstract
In this work, we contribute an EM algorithm for estimation of corner points and linear crossing segments for both marked and unmarked pedestrian crosswalks using the detections of pedestrians from processed LiDAR point clouds or camera images. We demonstrate the algorithmic performance by analyzing three real-world datasets containing multiple periods of data collection for four-corner and two-corner intersections with marked and unmarked crosswalks. Additionally, we include a Python video tool to visualize the crossing parameter estimation, pedestrian trajectories, and phase intervals in our public source code.
1 Introduction
The detection of crosswalks serves as an important module in pedestrian detection and tracking systems for both intelligent vehicles and smart infrastructure, especially when it comes to safety, as accidents involving pedestrians is one of the leading causes of death and injury around the world (Gandhi & Trivedi, 2008a).
The expected behavior of a vehicle (autonomous or not) in such situations is made explicitly clear by the California DMV Driver Handbook: “If you approach a pedestrian crossing at a corner or other crosswalk, even if the crosswalk is in the middle of the block, at a corner with or without traffic signal lights, whether or not the crosswalk is marked by painted lines, you are required to exercise caution and reduce your speed, or stop if necessary, to ensure the safety of the pedestrian.”
Autonomous vehicles adhere to this policy and reduce speed when a crosswalk is detected; such control methods are described in (Zhu et al., 2021), also accounting for the uncertainty in occluded scenes. Driver assistance systems have also been designed to encourage similar slowing; for example, the detection of a crosswalk activates a pedestrian collision warning system in (Suzuki et al., 2010). Modules and data supporting these practices are extensive; as examples, the crowd-detection system sensitivity in (Reisman et al., 2004) is tuned based on the presence of a crossing, and driver slowing patterns at crosswalks and associated pedestrian behaviors have been thoroughly studied in (Zang et al., 2021) and (Robert et al., 2021), providing a useful model for autonomous vehicles to adopt. Further, autonomous vehicles exercise caution to ensure safety of pedestrians through the estimation of pedestrian paths, which can be enhanced by the presence of crosswalks which can be used to estimate vehicle risk of encountering a pedestrian (Tian et al., 2014) and suggest a higher probability of pedestrian crossing behavior as well as a prescribed motion (Gandhi & Trivedi, 2008b). As some motivating examples, (Chen & Zhang, 2022) shows that knowledge crosswalk boundaries improve this path prediction using a modified social force model, and (Quintero Mínguez et al., 2019) explains that spatial layout of the environment, including crosswalks, provides valuable information to Automatic Emergency Braking Systems. (Deo & Trivedi, 2017) and (Kitani et al., 2012) use scene information such as crosswalks, origins, and destinations to learn a prior distribution on future pedestrian trajectories, and this information appears repeatedly in the research in the literature review on pedestrian behavior prediction presented in (Ridel et al., 2018). The principle is further evident in (Zhu et al., 2022), which shows that contextual information is particularly useful in trajectory prediction when using the technique of ‘unlikelihood training’, where trajectory outputs which violate contextual expectations are assigned lower probability. (Fridovich-Keil et al., 2020) shows that knowledge of goals not only informs trajectory predictions, but more importantly can properly adjust an autonomous system’s expectations in its prediction confidence when a pedestrian behaves in a way which deviates from direct paths to its goal; modeling this uncertainty can help autonomous agents perform more safely in human interactions.
Awareness of crossings is of particular importance in high-speed environments, where street cross markings can lure pedestrians into a false sense of security when drivers are unaware of the crossing (Gandhi & Trivedi, 2007).
In addition to benefits of pedestrian and driver safety, even the vehicle’s own path planning objectives and related tasks can benefit from accurate crosswalk detections; as an example, vehicle localization can be longitudinally corrected based on crosswalk estimates (Jo et al., 2013).
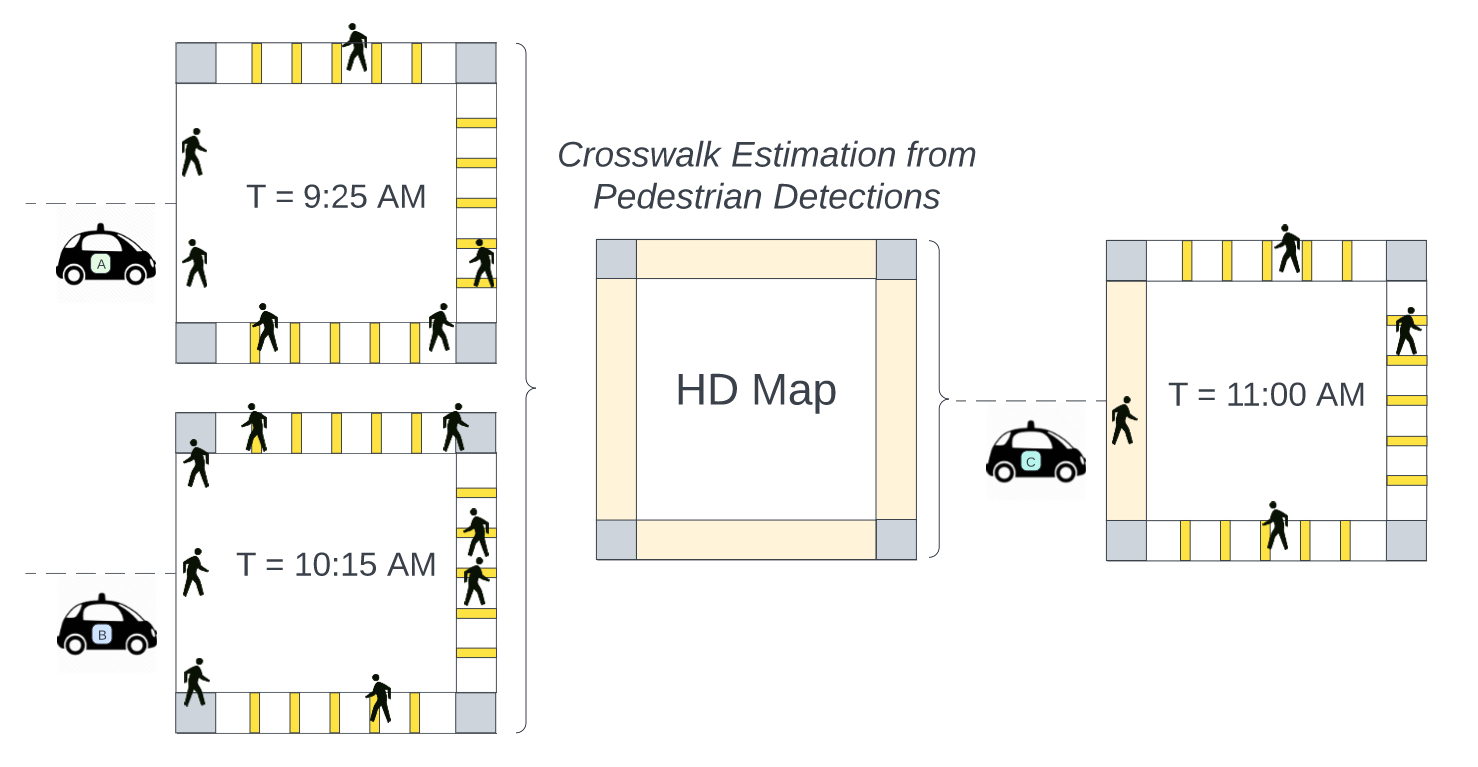
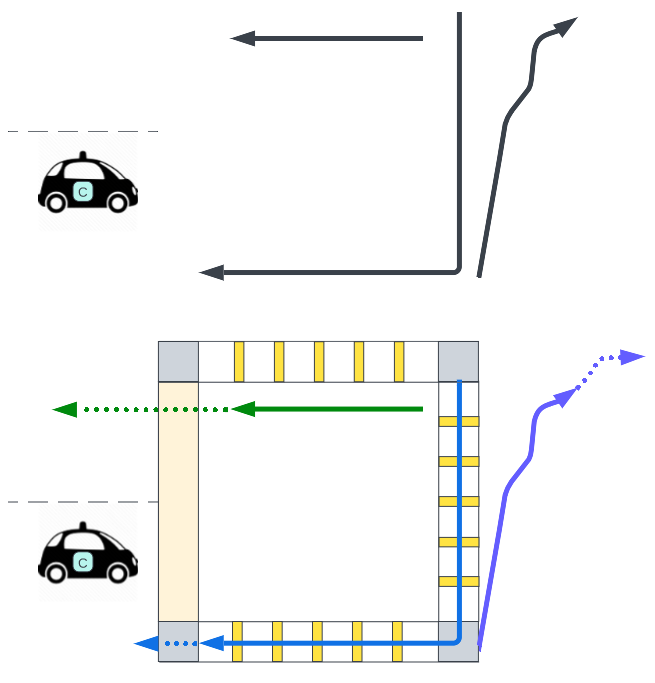
Therefore, we propose an algorithm which, given a set of 3D pedestrian detections, estimates lines which model the de facto pedestrian crosswalks at an intersection. Figures 1 and 2 illustrate the purpose of the algorithm within the context of connected safety systems, where an accurate representation of scene information can improve effectiveness of vehicle safety measures taken at crossings by inferring marked and unmarked pedestrian paths to provide stronger priors for trajectory prediction.
2 Related Research
Past approaches to detecting crosswalks have been primarily based on camera images of the static scene. Such methods include figure-ground segmentation (Coughlan & Shen, 2006), edge direction and cross-ratio analysis (Suzuki et al., 2010), Canny edge detection and Hough line parameter estimation (Tian et al., 2021), MSER and ERANSAC (Zhai et al., 2015), laser scanning (Hernández et al., 2015), monocular image deep learning to classify presence of crosswalk in overall scene (Tümen & Ergen, 2020), PCA-based road segmentation and crosswalk detection from a LiDAR point cloud (Riveiro et al., 2015), and image classification using deep learning over massive instances from satellite imagery (Berriel et al., 2017).
Camera-based approaches are the most popular for such detections, and for good reason: (Song et al., 2022) shows that in urban point cloud maps, crosswalks and other road surface markings (RSMs) are the most challenging class in point cloud semantic segmentation. But even in camera-based approaches, cracks and other damage to painted lines can provide significant challenges, with remedies proposed in (Ito et al., 2021).
Rather than modeling the scene based using computer vision applied to static scene elements, we are the first to use the motion patterns of detected pedestrians to estimate the crosswalks. Our approach provides a few unique benefits:
-
•
The algorithm can directly recognizes crosswalks even under the additional DMV stipulation “whether or not the crosswalk is marked by painted lines”. Pedestrians following such trajectories are not necessarily illegally jaywalking; they are simply using an unmarked crosswalk.
-
•
The algorithm parameterizes crosswalks based on actual crossing paths and rest points, which may differ from those indicated by prescribed road markings.
-
•
No prior knowledge of the intersection geometry is required, only pedestrian detections.
-
•
The algorithm is robust to non-square, non-rectangular, and even non-parallelogram interesection-crossing geometries.
-
•
The algorithm is robust to natural degradation of road markings (chipped paint, graffiti) or temporary detours to paths (e.g. construction).
3 EM Algorithm for Crosswalk Estimation
We make the following assumptions about pedestrian behavior:
-
1.
The crosswalk being utilized by a pedestrian is a latent variable on which their motion depends.
-
2.
Pedestrians spend, on aggregate, more time at a crossing corner than on any point of the street crossing. This enables the use of k-means clusters for initialization of crossing corners.
-
3.
Crosswalks are linear in nature. This enables the estimation of crossings as lines of best-fit.
-
4.
Most pedestrians cross within the designated or de facto crossing bounds with an average trajectory along the middle of the crosswalk. This enables the filtering of outlier crossing points.
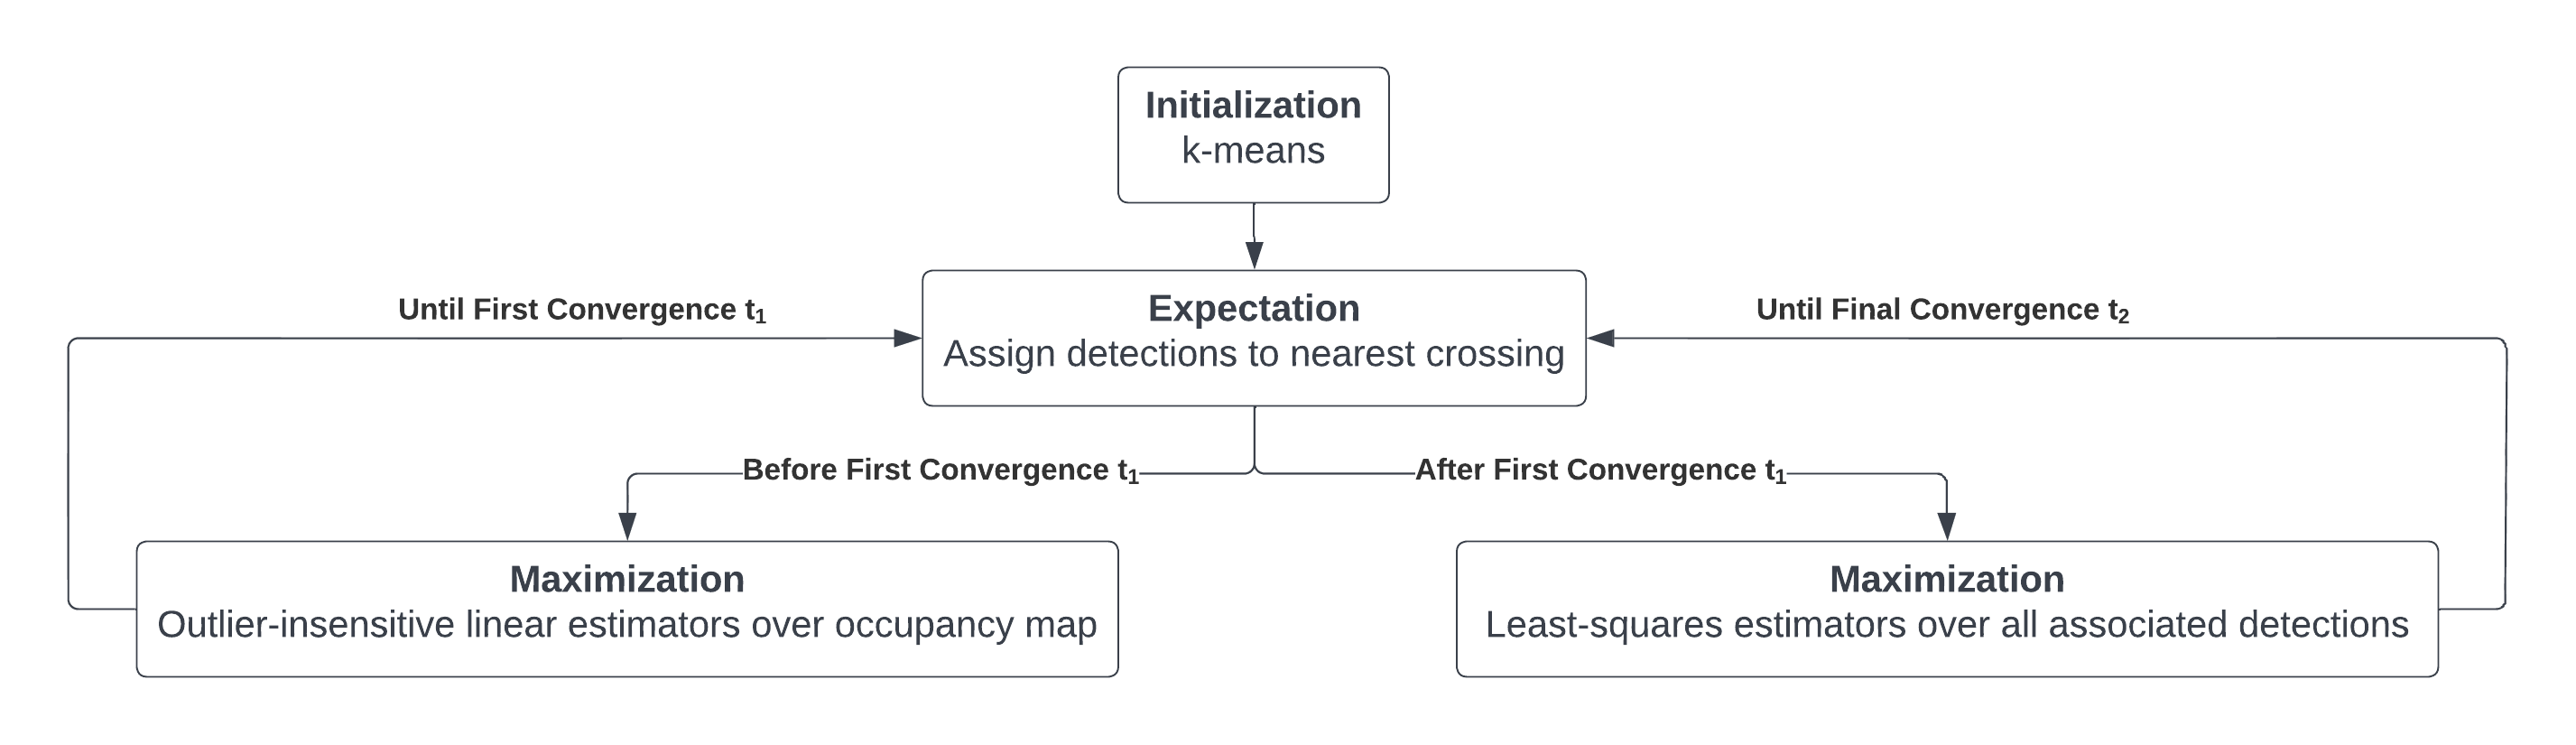
The Expectation-Maximization (EM) algorithm (Dempster et al., 1977) is an iterative algorithm used to find maximum-likelihood estimates of parameters of a statistical model in the presence of latent (hidden) variables. We frame our statistical model to be the distribution of pedestrian detections, subject to the parameters which define the location of street corners. These corners are parameters which dually define the crosswalks as the connecting line segments. Samples from the distribution of the pedestrian detections depends on a latent variable: which crosswalk is the detected pedestrian occupying? Given input of 3D pedestrian detections within a coordinate system, the following EM algorithm estimates the locations of street corners which act as starting or ending points for crosswalks (marked or unmarked). An overview of the algorithm is shown in Figure 3.
-
1.
Initialization
-
(a)
Begin with ground plane positions for all pedestrian detections made using LiDAR points.
-
(b)
Perform k-means clustering (Likas et al., 2003) where is the number of corners expected at the intersection. In the case of our dataset, . These cluster centers will serve as preliminary corners.
-
(c)
Compute the angle between each pair of corners.
-
(d)
Using the corners central to the greatest four angles, form four pairs of corners, which parameterize a given crossing segment. The greatest angles are used to ensure that these segments comprise the border of the intersection rather than diagonal segments which interfere with traffic. In the case of environments where diagonal crossing is expected, additional segments can be allowed.
-
(a)
-
2.
Expectation
-
(a)
Assign to each pedestrian detection an expected value of the latent variable referring to the associated crossing line , parameterized as . In this case, we compute this nearest crosswalk value using
(1) -
(b)
Filter by ignoring outlier points which are more than meters from all crossing lines during this EM iteration. is a hyperparameter; we use a value of meters.
-
(a)
-
3.
Maximization
-
(a)
Fit a line of least-squares to each set of detections associated with a unique , representing the crossing. It is important to note that initial estimates are easily trapped in local minima (for example, if k-means initializes near a non-corner position that a pedestrian chose to stand in wait). To allow the estimate to escape this local well, we use two remedies:
-
i.
Treat the detections as an occupancy map rather than a heatmap (that is, each location within some resolution can be either occupied or non-occupied, rather than allowing multiple detections to be representative of the same area). This is useful in reducing the effect of a person standing in a non-corner area for a long period of time, while still capitalizing on the density of points near corners from regular pedestrian traffic. We use a resolution of 0.1 meters.
-
ii.
Begin the estimate with a line estimate method which is less sensitive to outliers (in our case, we use the Theil-Sen Estimator (Pedregosa et al., 2011)).
Both of these modifications can be dropped once the intersection corners make an initial convergence within some tolerance .
-
i.
-
(b)
Define two parallel boundary lines surrounding each crossing, with distance offset
(2) where is the iteration number, and are the upper and lower limits to the margin of allowable pedestrian points to be considered ‘on’ the nearest crosswalk, and is the rate at which these margins narrow, in meters per iteration. To find these lines, first compute the angle of inclination , where is the slope. The complement of subtends a right triangle whose opposite side is and hypotenuse is , a term which can be added to the initial y-intercept of the line to form a parallel line offset at distance . Note that this step should be skipped until is satisfied; else the restrictive margins may ‘race’ against the initial convergence of corners to a space away from outliers.
-
(c)
Filter points outside the boundaries from the next iteration. As increases, the boundaries tighten to include only the most representative points of the crossing. This also reduces the effects of trajectories deviating from the crossing lines after the pedestrian’s segment between the corners is complete.
-
(d)
Repeat E and M steps until convergence. To determine stopping criteria, take the intersection of each pair of lines as the corresponding crossing corner, and terminate when the corner positions do not change by more than tolerance in sum. Both and are hyperparameters; we use values of and meters.
-
(a)
4 Analysis
4.1 Datasets
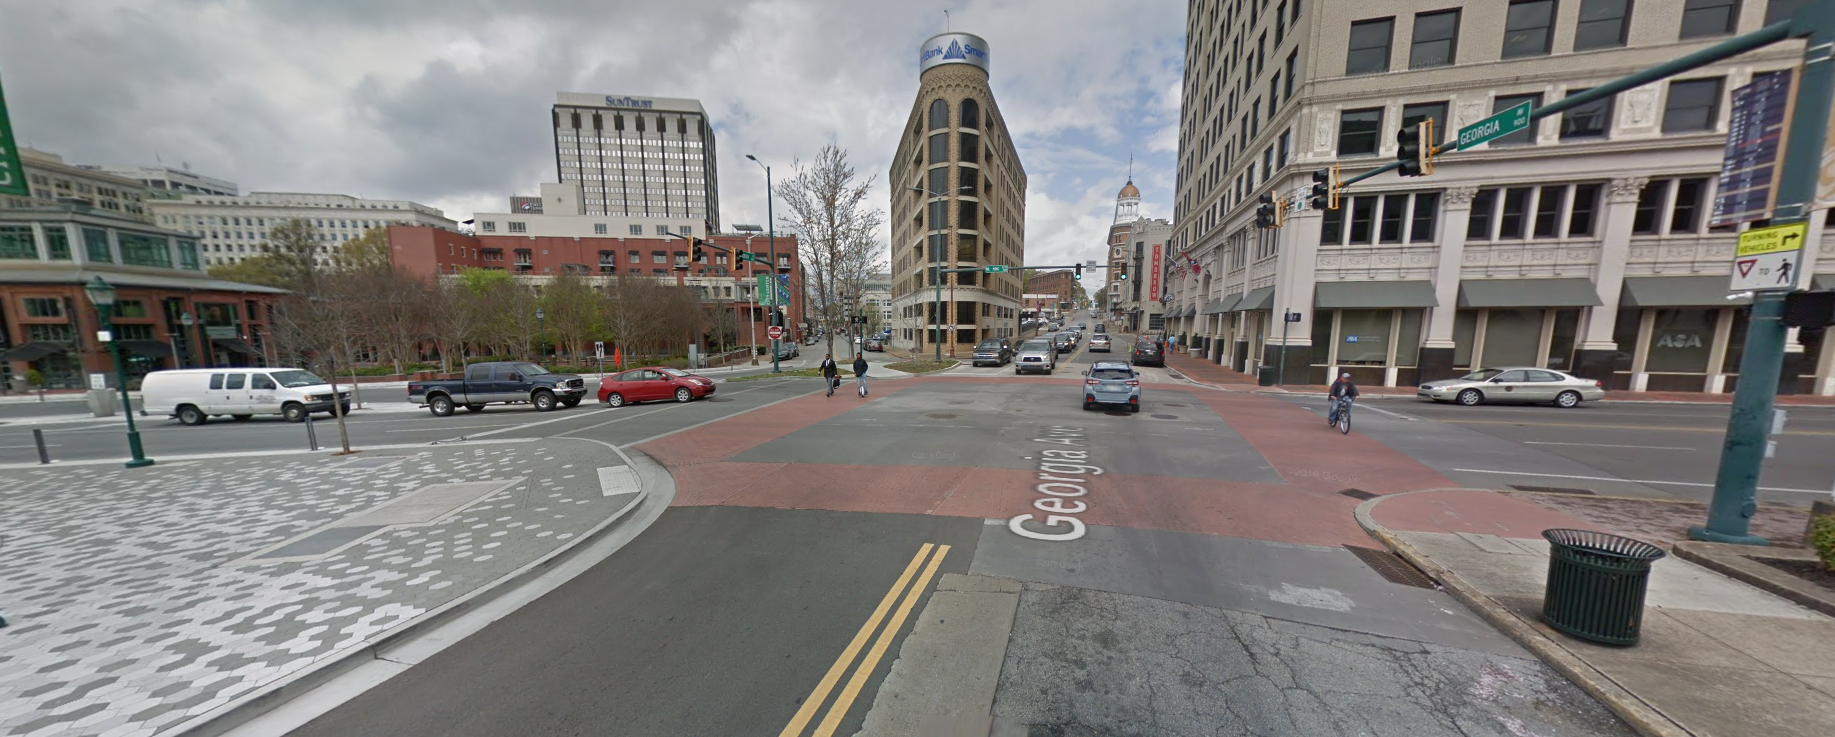
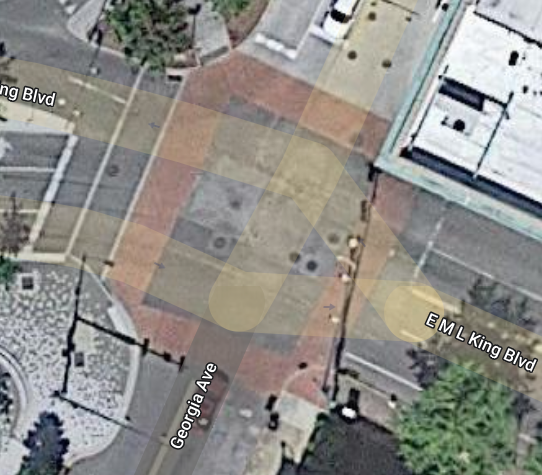
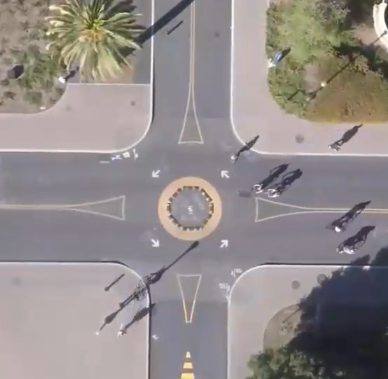
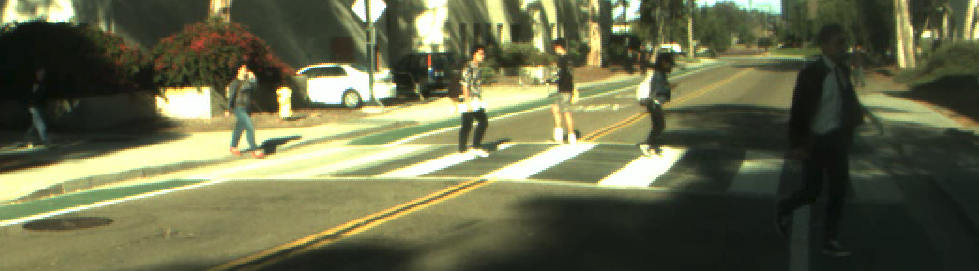
Our experiments utilize three datasets. First, we utilize the data presented in the 2022 Transportation Review Board Committee on Artificial Intelligence and Advanced Computing Applications Transportation Forecasting Competition (Ishak et al., 2021). Three time periods of data were collected from three Ouster OS1-128 LiDAR sensors at the MLK and Georgia Avenue intersection in Chattanooga, Tennessee (see Figure 4). The LiDAR point cloud data was processed by Seoul Robotics software to provide object labels (pedestrian, vehicle, and bicyclist), and sub-classification features of object size, position, and velocity. Each pedestrian data entry also includes a confidence and tracking status. Second, we use pedestrian detection data collected from the Stanford Drone Dataset (Robicquet et al., 2016) at a bicycle traffic circle 5, where pedestrians exhibit similar behavior to street crossing. Note that this dataset provides detections on a pixel scale rather than meters. Third, we use 3D pedestrian detection data collected from a two-corner crosswalk on the campus of University of California, San Diego, collected from a camera mounted to a stationary parked vehicle (see Figure 6) (Deo & Trivedi, 2017).
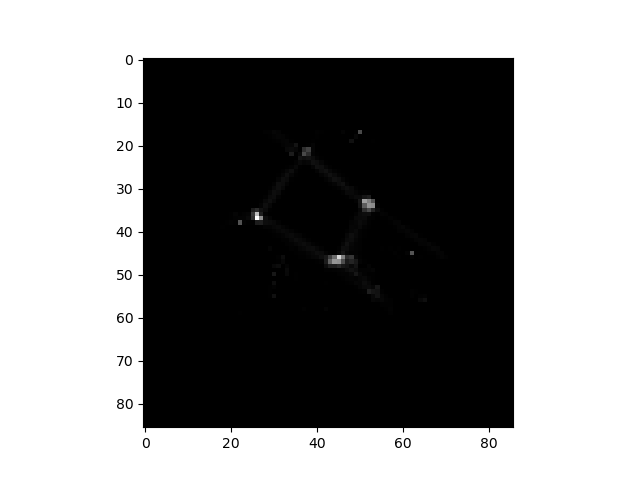
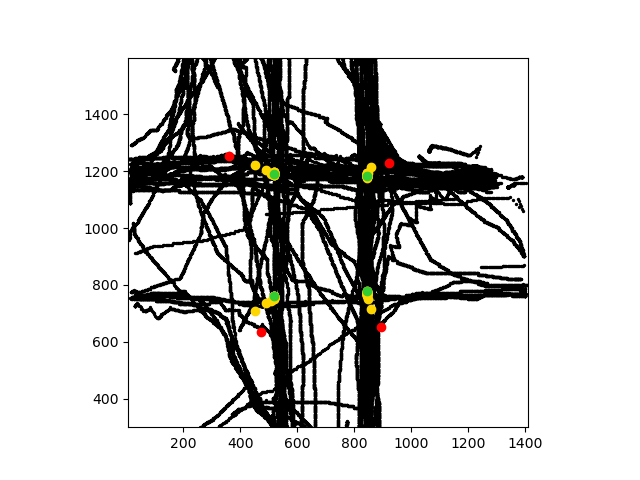
The assumption that pedestrian detections tend to aggregate at crossing corners is valid for the analyzed datasets. This property is illustrated in the data collected at the intersection in Chattanooga, shown in Figure 7.
4.2 Results
4.2.1 Four-Corner Crossing: Chattanooga
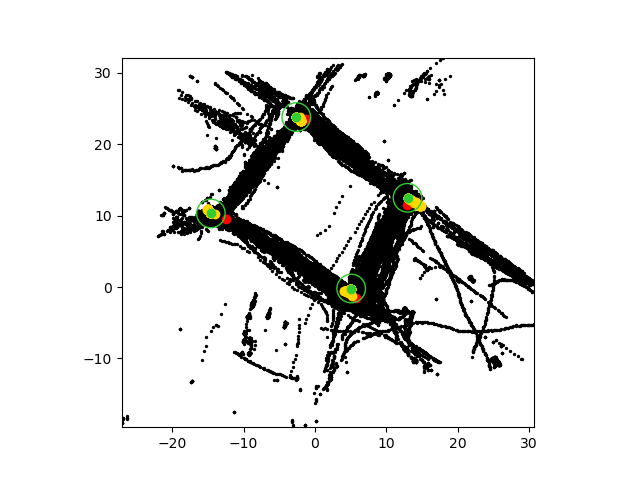
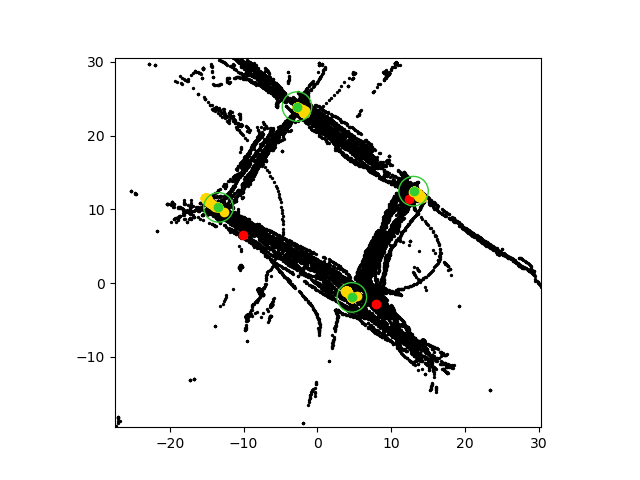
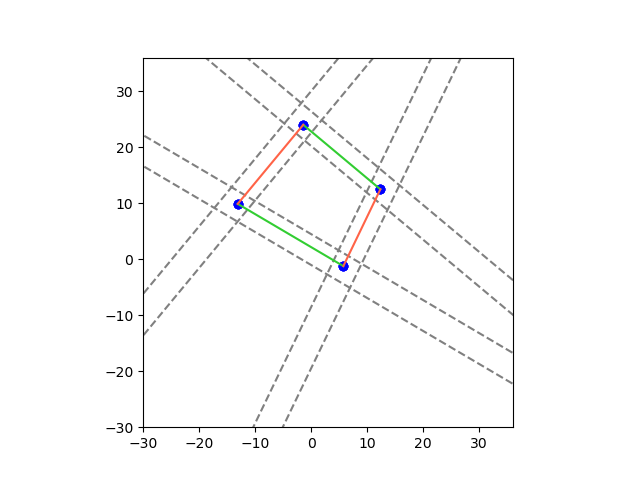
Figures 8, 9, and 10 illustrate the application of the above EM algorithm to estimate the location of crossing corners for each of the three data collection periods. Below each illustration is a graph which shows the decrease in residuals from the least-squares line (averaged over the four clusters) for each iteration of the algorithm. Observing the coverage of the pedestrian detections, it is evident that the final EM algorithm estimates (red) are much closer to the true crosswalk corners than the initial k-means estimates (cyan). Notably, the EM algorithm is able to move the corner estimates to areas less densely populated with detection points to improve accurate positioning, and is robust to the many noisy data points which exist in non-crossing regions. Despite the three samples containing completely different detection datapoints and k-means initializations, the corners converge to similar locations as described in Table 1, with an average difference of 0.667 meters from the estimate based on the aggregate dataset.
| Corner: | 1 | 2 | 3 | 4 | Average |
|---|---|---|---|---|---|
| Batch 1 | 1.282 | 0.227 | 1.615 | 1.273 | 1.111 |
| Batch 2 | 0.030 | 0.085 | 0.223 | 0.112 | 0.112 |
| Batch 3 | 0.217 | 1.161 | 1.553 | 0.181 | 0.778 |
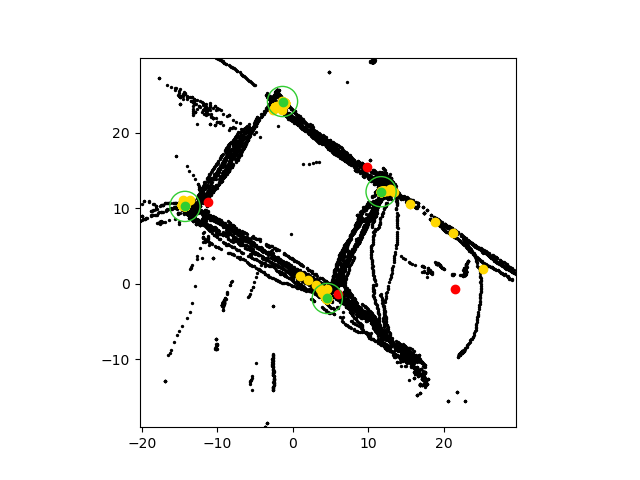
The first batch (Figure 8) shows the most dramatic shift from initial to final locations. This data period was heavily skewed by pedestrian behavior which occurred down the road from the intersection, but the algorithm was able to overcome the initial local minimum through the important step of occupancy-map formulation and outlier-insensitive linear estimation.
The corresponding crosswalks are illustrated in Figure 11, including a margin inside and outside each line to account for pedestrian deviations from the center crossing line. Depending on intended application, this margin can be provided as a hyperparameter to match safety or legal expectations, or learned from the data to match practical usage. For example, in our illustration, we use values for inner and outer margins of and respectively. The greater tolerance for is employed since pedestrians can safely wait further from the corner than the sidewalk, but cannot safely wait within the street.
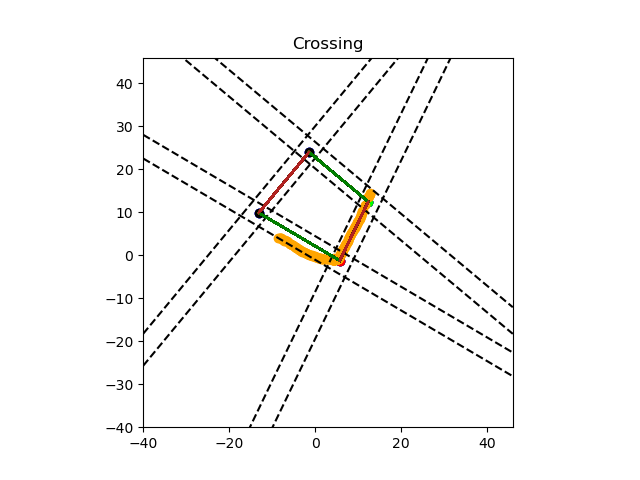
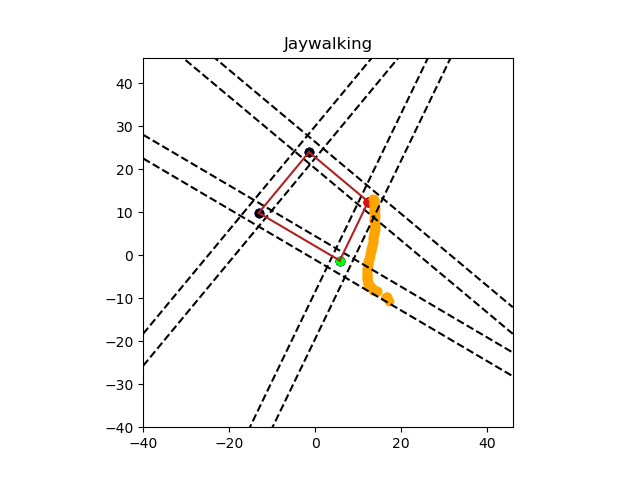
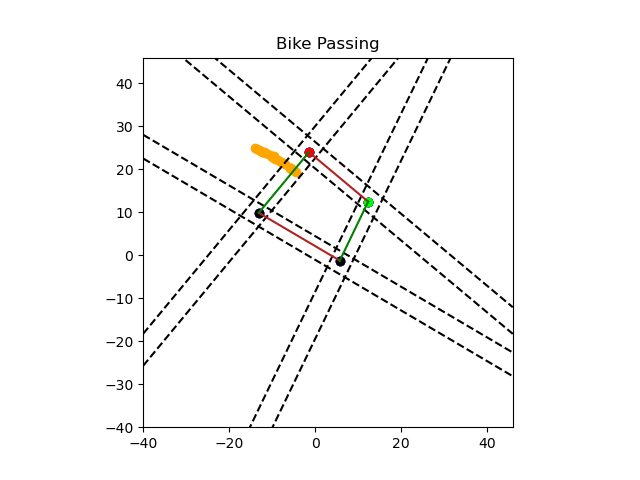
Using the estimated corners and crosswalks, we show that it is possible to classify pedestrian trajectories using a rule-based technique (i.e. pedestrians passing travelling from corner-to-corner are legally crossing, pedestrians who move through an intersection via points adjacent to but not upon corners are likely bikers, pedestrians who cross from a sidewalk to another sidewalk but avoid the corners are jaywalking, etc.). These classifications, shown in Figure 14, have value in predicting future trajectories of the pedestrians for safe vehicle operation.
4.2.2 Four-Corner Crossing: Stanford Traffic Circle
We repeat the proposed algorithm on a bike traffic circle from the Stanford Drone dataset. Most notably, this consists entirely of unmarked crosswalks, yet the pedestrian trajectories still produce a clear pattern which is otherwise invisible in road infrastructure. The k-means initialization places the estimates in locations which are near the corners but not precise; after 27 iterations, the corners converge to positions which represent the most frequent (unmarked) crosswalks used by the pedestrians.
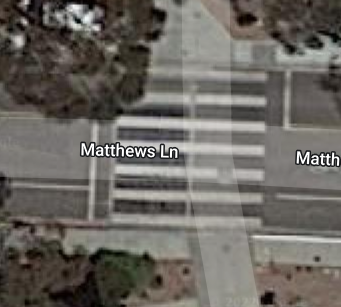
4.2.3 Two-Corner Crossing: La Jolla
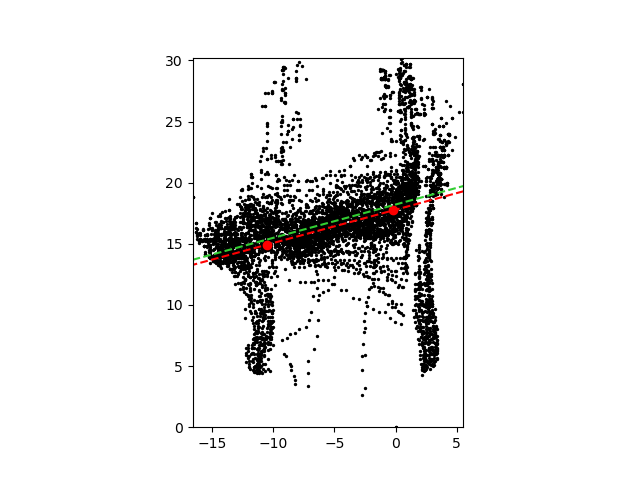
Using the modification of the algorithm for a single crosswalk (no intersecting corners), we demonstrate the algorithm’s effectiveness at locating the two crossing corners at the La Jolla crosswalk. The initial estimate reflects the noise of those walking on the pathway (notice the density in the lower half of the scatter plot in Figure 13), and after refining the estimate by narrowing the accepted margin of inliers, the crossing better reflects the tendency of pedestrians to gather and orient their trajectory diagonally upward within our bird’s-eye-view. Notably, this is not the perpendicular crossing geometry marked by the road, but rather a de facto crossing pattern.
5 Concluding Remarks
In this work, we described and illustrated the effectiveness of an EM algorithm for estimating crosswalks using a real-world pedestrian detection dataset. This algorithm can be used to model both marked and unmarked crossings in a variety of geometries. Crosswalk detection methods which rely on the physical appearance of road infrastructure naturally fail in cases where the infrastructure is damaged, obstructed, or ignored; by contrast, methods which make use of pedestrian motion can still provide reliable information under these conditions.
5.1 Limitations
While the techniques introduced in the two-stage EM algorithm are designed to make the algorithm robust to certain violations of the prerequisite assumptions, the algorithm is less effective in situations where pedestrians congregate at points within the considered area but away from the crossing origins or destinations. In such cases, the k-means clustering provides a poor initialization (for example, if there are two congregating points at one corner, and a severe imbalance of data at another corner, then two cluster centers will share the same corner and may not converge to the crossing geometry). It would therefore be important to add appropriate check conditions to be sure initial corner estimates are sufficiently spaced. Second, though the best-representative crossing line is determined, further investigation to estimate the effective crossing margin would be valuable, as this is currently passed to the algorithm as a hyperparameter and may vary in different crossing scenes.
5.2 Broader Impact
The demonstrated datasets were collected from both city infrastructure LiDAR and vehicle-mounted camera; any modality which can perform 3D detection is suitable. This method readily extends to measurements made by moving vehicles with accurate localization, and can be used downstream to support safe interactions between pedestrians and autonomous vehicles. As explained in (Gandhi & Trivedi, 2008a), detection and tracking of objects from cameras is easier due to absence of camera motion and use of background subtraction, but in addition to infrastructure-based sensing, improvements in vehicle-to-vehicle and vehicle-to-infrastructure communication will allow for improved exchange of temporal information or information about objects that are seen by one but not seen by others. In particular, vehicles which are able to report pedestrian detections within a global coordinate frame can supply local data to HD maps, leveraging the above algorithm to maintain an accurate, dynamic estimate of de facto crosswalks with repeated samples over time.
References
- Berriel et al. (2017) Berriel, R. F., Rossi, F. S., de Souza, A. F., and Oliveira-Santos, T. Automatic large-scale data acquisition via crowdsourcing for crosswalk classification: A deep learning approach. Computers & Graphics, 68:32–42, 2017.
- Chen & Zhang (2022) Chen, H. and Zhang, X. Path planning for intelligent vehicle collision avoidance of dynamic pedestrian using att-lstm, msfm, and mpc at unsignalized crosswalk. IEEE Transactions on Industrial Electronics, 69(4):4285–4295, 2022. doi: 10.1109/TIE.2021.3073301.
- Coughlan & Shen (2006) Coughlan, J. and Shen, H. A fast algorithm for finding crosswalks using figure-ground segmentation. In 2nd Workshop on Applications of Computer Vision, in conjunction with ECCV, volume 5, 2006.
- Dempster et al. (1977) Dempster, A. P., Laird, N. M., and Rubin, D. B. Maximum likelihood from incomplete data via the em algorithm. Journal of the Royal Statistical Society: Series B (Methodological), 39(1):1–22, 1977.
- Deo & Trivedi (2017) Deo, N. and Trivedi, M. M. Learning and predicting on-road pedestrian behavior around vehicles. In 2017 IEEE 20th International Conference on Intelligent Transportation Systems (ITSC), pp. 1–6, 2017. doi: 10.1109/ITSC.2017.8317865.
- Fridovich-Keil et al. (2020) Fridovich-Keil, D., Bajcsy, A., Fisac, J. F., Herbert, S. L., Wang, S., Dragan, A. D., and Tomlin, C. J. Confidence-aware motion prediction for real-time collision avoidance1. The International Journal of Robotics Research, 39(2-3):250–265, 2020.
- Gandhi & Trivedi (2007) Gandhi, T. and Trivedi, M. M. Pedestrian protection systems: Issues, survey, and challenges. IEEE Transactions on Intelligent Transportation Systems, 8(3):413–430, 2007. doi: 10.1109/TITS.2007.903444.
- Gandhi & Trivedi (2008a) Gandhi, T. and Trivedi, M. M. Computer vision and machine learning for enhancing pedestrian safety. In Computational intelligence in automotive applications, pp. 59–77. Springer, 2008a.
- Gandhi & Trivedi (2008b) Gandhi, T. and Trivedi, M. M. Image based estimation of pedestrian orientation for improving path prediction. In 2008 IEEE Intelligent Vehicles Symposium, pp. 506–511. IEEE, 2008b.
- Hernández et al. (2015) Hernández, D. C., Filonenko, A., Seo, D., and Jo, K.-H. Crosswalk detection based on laser scanning from moving vehicle. In 2015 IEEE 13th International Conference on Industrial Informatics (INDIN), pp. 1515–1519, 2015. doi: 10.1109/INDIN.2015.7281958.
- Ishak et al. (2021) Ishak, S., Vlahogianni, E., et al. Trb aed50 data challenge. TRB Data Challenge, 2021.
- Ito et al. (2021) Ito, T., Tohriyama, K., and Kamata, M. Detection of damaged stop lines on public roads by focusing on piece distribution of paired edges. International journal of intelligent transportation systems research, 19(1):56–70, 2021.
- Jo et al. (2013) Jo, K., Chu, K., and Sunwoo, M. Gps-bias correction for precise localization of autonomous vehicles. In 2013 IEEE Intelligent Vehicles Symposium (IV), pp. 636–641, 2013. doi: 10.1109/IVS.2013.6629538.
- Kitani et al. (2012) Kitani, K. M., Ziebart, B. D., Bagnell, J. A., and Hebert, M. Activity forecasting. In European conference on computer vision, pp. 201–214. Springer, 2012.
- Likas et al. (2003) Likas, A., Vlassis, N., and Verbeek, J. J. The global k-means clustering algorithm. Pattern recognition, 36(2):451–461, 2003.
- Pedregosa et al. (2011) Pedregosa, F., Varoquaux, G., Gramfort, A., Michel, V., Thirion, B., Grisel, O., Blondel, M., Prettenhofer, P., Weiss, R., Dubourg, V., Vanderplas, J., Passos, A., Cournapeau, D., Brucher, M., Perrot, M., and Duchesnay, E. Scikit-learn: Machine learning in Python. Journal of Machine Learning Research, 12:2825–2830, 2011.
- Quintero Mínguez et al. (2019) Quintero Mínguez, R., Parra Alonso, I., Fernández-Llorca, D., and Sotelo, M. . Pedestrian path, pose, and intention prediction through gaussian process dynamical models and pedestrian activity recognition. IEEE Transactions on Intelligent Transportation Systems, 20(5):1803–1814, 2019. doi: 10.1109/TITS.2018.2836305.
- Reisman et al. (2004) Reisman, P., Mano, O., Avidan, S., and Shashua, A. Crowd detection in video sequences. In IEEE Intelligent Vehicles Symposium, 2004, pp. 66–71. IEEE, 2004.
- Ridel et al. (2018) Ridel, D., Rehder, E., Lauer, M., Stiller, C., and Wolf, D. A literature review on the prediction of pedestrian behavior in urban scenarios. In 2018 21st International Conference on Intelligent Transportation Systems (ITSC), pp. 3105–3112, 2018. doi: 10.1109/ITSC.2018.8569415.
- Riveiro et al. (2015) Riveiro, B., González-Jorge, H., Martínez-Sánchez, J., Díaz-Vilariño, L., and Arias, P. Automatic detection of zebra crossings from mobile lidar data. Optics & Laser Technology, 70:63–70, 2015.
- Robert et al. (2021) Robert, L., Yang, J., Tilbury, D., et al. Automated vehicle behavior design for pedestrian interactions at unsignalized crosswalks. Available at SSRN 3859366, 2021.
- Robicquet et al. (2016) Robicquet, A., Sadeghian, A., Alahi, A., and Savarese, S. Learning social etiquette: Human trajectory understanding in crowded scenes. In European conference on computer vision, pp. 549–565. Springer, 2016.
- Song et al. (2022) Song, H., Jo, K., Cho, J., Son, Y., Kim, C., and Han, K. A training dataset for semantic segmentation of urban point cloud map for intelligent vehicles. ISPRS Journal of Photogrammetry and Remote Sensing, 187:159–170, 2022. ISSN 0924-2716. doi: https://doi.org/10.1016/j.isprsjprs.2022.02.007. URL https://www.sciencedirect.com/science/article/pii/S0924271622000417.
- Suzuki et al. (2010) Suzuki, S., Raksincharoensak, P., Shimizu, I., Nagai, M., and Adomat, R. Sensor fusion-based pedestrian collision warning system with crosswalk detection. In 2010 IEEE Intelligent Vehicles Symposium, pp. 355–360, 2010. doi: 10.1109/IVS.2010.5548120.
- Tian et al. (2014) Tian, R., Li, L., Yang, K., Chien, S., Chen, Y., and Sherony, R. Estimation of the vehicle-pedestrian encounter/conflict risk on the road based on tasi 110-car naturalistic driving data collection. In 2014 ieee intelligent vehicles symposium proceedings, pp. 623–629. IEEE, 2014.
- Tian et al. (2021) Tian, S., Zheng, M., Zou, W., Li, X., and Zhang, L. Dynamic crosswalk scene understanding for the visually impaired. IEEE Transactions on Neural Systems and Rehabilitation Engineering, 29:1478–1486, 2021. doi: 10.1109/TNSRE.2021.3096379.
- Tümen & Ergen (2020) Tümen, V. and Ergen, B. Intersections and crosswalk detection using deep learning and image processing techniques. Physica A: Statistical Mechanics and its Applications, 543:123510, 2020. ISSN 0378-4371. doi: https://doi.org/10.1016/j.physa.2019.123510. URL https://www.sciencedirect.com/science/article/pii/S0378437119319582.
- Zang et al. (2021) Zang, G., Azouigui, S., Saudrais, S., Peyricot, O., and Hébert, M. Quantitative study of vehicle-pedestrian interactions: Towards pedestrian-adapted lighting communication functions for autonomous vehicles. Electronic Imaging, 2021(17):172–1, 2021.
- Zhai et al. (2015) Zhai, Y., Cui, G., Gu, Q., and Kong, L. Crosswalk detection based on mser and eransac. In 2015 IEEE 18th International Conference on Intelligent Transportation Systems, pp. 2770–2775, 2015. doi: 10.1109/ITSC.2015.448.
- Zhu et al. (2022) Zhu, D., Zahran, M., Li, L. E., and Elhoseiny, M. Motion forecasting with unlikelihood training in continuous space. In Faust, A., Hsu, D., and Neumann, G. (eds.), Proceedings of the 5th Conference on Robot Learning, volume 164 of Proceedings of Machine Learning Research, pp. 1003–1012. PMLR, 08–11 Nov 2022. URL https://proceedings.mlr.press/v164/zhu22a.html.
- Zhu et al. (2021) Zhu, H., Iryo-Asano, M., Alhajyaseen, W. K., Nakamura, H., and Dias, C. Interactions between autonomous vehicles and pedestrians at unsignalized mid-block crosswalks considering occlusions by opposing vehicles. Accident Analysis & Prevention, 163:106468, 2021.