latex-latex \tikzsetbase/.style = inner sep=5pt, text centered, thin, font=, round/.style = base, rectangle, rounded corners=1ex, draw=black, fill=gray!20, minimum height=0.35in
A Comparative Analysis of Ookla Speedtest and Measurement Labs Network Diagnostic Test (NDT7)
Abstract.
Consumers, regulators, and ISPs all use client-based “speed tests” to measure network performance, both in single-user settings and in aggregate. Two prevalent speed tests, Ookla’s Speedtest and Measurement Lab’s Network Diagnostic Test (NDT), are often used for similar purposes, despite having significant differences in both the test design and implementation, and in the infrastructure used to perform measurements. In this paper, we present the first-ever comparative evaluation of Ookla and NDT7 (the latest version of NDT), both in controlled and wide-area settings. Our goal is to characterize when and to what extent these two speed tests yield different results, as well as the factors that contribute to the differences. To study the effects of the test design, we conduct a series of controlled, in-lab experiments under a comprehensive set of network conditions and usage modes (e.g., TCP congestion control, native vs. browser client). Our results show that Ookla and NDT7 report similar speeds under most in-lab conditions, with the exception of networks that experience high latency, where Ookla consistently reports higher throughput. To characterize the behavior of these tools in wide-area deployment, we collect more than 80,000 pairs of Ookla and NDT7 measurements across nine months and 126 households, with a range of ISPs and speed tiers. This first-of-its-kind paired-test analysis reveals many previously unknown systemic issues, including high variability in NDT7 test results and systematically under-performing servers in the Ookla network.
1. Introduction
Network throughput—colloquially referred to as “speed”—is among the most well-established and widely used network performance metrics. Indeed, “speed” is used as the basis for a wide range of purposes, from network troubleshooting and diagnosis, to policy advocacy (of the Attorney General, 2020; the Net, 2022; University and Lab, 2019; Commission, 2021) (e.g., on issues related to digital equity), to regulation and litigation (Commission, 2022) (e.g., on issues related to ISP advertised speed). Given the extent to which stakeholders, from consumers to regulators to ISPs, all rely on “speed”, it is in some sense surprising that there is no consensus on the way to measure it. Absent any standard, many speed tests, varying in both design and implementation, are used interchangeably.
Over the past decade, Ookla’s Speedtest (Ookla, 2022) (“Ookla”) and Measurement Lab’s Network Diagnostic Tool (“NDT”) (Lab, 2022c) have been widely used by both consumers and policymakers: Ookla and NDT report a daily average of over million (Ookla, 2020a) and million tests (Lab, 2020a), respectively. As a result, the compiled datasets from these two tests, amounting to billions of speed tests (Ookla, 2020a; Clark and Wedeman, 2021), have become universal resources for analyzing broadband Internet performance (the Net, 2022; Commission, 2022; of the Attorney General, 2020; University and Lab, 2019). Unfortunately, these datasets have also been used out of context, without a clear understanding of the caveats and limitations of these tools under different circumstances and environments (Ookla, 2020b).
The stakes—and, therefore, the costs—of misuse have also never been higher. In the United States, Congress has committed $43.5 billion to Internet infrastructure, including to last-mile performance and availability improvements (Boak, 2022). In response, state and local officials across the country are currently urging consumers to participate in speed test crowd-sourcing initiatives to help establish which areas meet the federal funding criteria (Press, 2022).
To their credit, the organizations who have developed these speed test tools have tried to prevent misappropriation of the data by issuing guidance about how the tools and public data should and should not be used. M-Lab has gone as far as to say that “M-Lab’s NDT and Ookla’s SpeedTest measure fundamentally different things” (List, 2017). While this statement is certainly true, there has been no study to date about how these differences in tool design can (and do) yield different results in practice, under different operating conditions. Acknowledging that Ookla and NDT7 are different is, in some sense, besides the point. Although each tool may have been designed with a specific purpose in mind, that does not mean it can not fulfill—or be appropriated for—other purposes. Such has been the case with NDT7, which has been used as a tool to measure access ISP throughput, even though its stated design is to test the throughput of a single TCP connection. In light of the significant attention to both of these tests, it is imperative to develop a rigorous, quantitative, and specific understanding of the circumstances under which each tool can accurately measure last-mile speed—and, hence, the context for interpreting each dataset.
To this end, we conduct the first-of-its-kind systematic, comparative study of NDT7 (the latest version of NDT) and Ookla 111We focus on Ookla and NDT7 because of their popularity with consumers and policy makers, but the method in this paper also applies to other tools.. We begin with a set of in-lab experiments that allow us to directly compare the tools under controlled network conditions where “ground truth” is known. Next, we conduct more than 80,000 paired wide-area network tests, whereby the two tests are run back-to-back, from 126 home broadband access networks across more than 30 neighborhoods in one of the largest cities in the United States for nearly a year. In-lab, we use controlled experiments to characterize how NDT7 and Ookla behave under a wide range of network conditions—specifically, varying throughput, latency, packet loss, and cross-traffic. We also study how different transport congestion control algorithms and client types (i.e., browser vs. native client) may affect the measurements that each tool reports. Second, we compare the behavior of these two tools using data from our wide-area network deployment encompassing 10 different ISPs. A unique and important methodological aspect of our study is the use of paired speed tests, where we run Ookla and NDT7 in succession. To our knowledge, this is the first comparative analysis of Ookla and NDT7 in deployment over a significant number of networks for an extended period of time.
| The NDT7 client can send at about 95% of a high-capacity link (up to 2 Gbps) using only a single TCP connection. This finding updates past work that reported a different finding, that a single TCP connection can not achieve a throughput approaching full capacity (Feamster and Livingood, 2020). (section 3.2). |
| The NDT7 client under-reports throughput at higher latencies, in comparison to Ookla: The Ookla client reports speeds up to 12% higher than NDT7 at 200 ms round-trip latency, and up to 56% higher at 500 ms latency (section 3.2). |
| Across all households in the wide-area deployment, the median fraction of paired tests for which Ookla reports a speed that is 0–5% higher than NDT7 is 73.8%. The fraction of paired tests for which Ookla reports a speed that is 5–25% higher is 13.4% (section 4.2). |
| For Ookla, the choice of test server can significantly affect the reported speed. Tests using certain Ookla servers systematically report speeds 10% lower than other servers. (section 4.3). |
| NDT7 tests are more likely to under-report during peak hours. 43.4% of households observed a statistically significant decrease in NDT7-reported download speed tests during peak hours, whereas only 18.9% of these households saw the same for Ookla (section 4.4). |
Table 1 summarizes our findings. We observe significant differences in Ookla and NDT7’s behavior and explain the causes of these differences. Our results and suggestions should help users understand why the reported speed from Ookla and NDT7 may differ, as well as guide policymakers towards more accurate and appropriate use of public data sets based on these tools. To facilitate both the reproduction and extension of our results and study, we have released all of the data from this study, as well as all of the measurement and analysis code we used to conduct the study (Sharma et al., 2022; UChicago, 2022). We view this research as the beginning of a discussion on how to use collective speed test data to shed more light on the state of broadband Internet access networks around the United States, and the world.
The rest of the paper is organized as follows. Section 2 provides background on the design of the Ookla and NDT7 speed tests, including how these tools differ in both design, implementation, and deployment in practice. Section 3 describes how we design in-lab measurements to evaluate the performance of these tools over a comprehensive set of network conditions. In Section 4, we describe a wide-area measurement study of Ookla and NDT7—the first-ever (and only, to date) comparative study of these two speed test tools in real deployed networks. Section 5 describes related work. Section 6 discusses the implications of our results, including guidelines for how our results should (should not) be interpreted and discussion of possible future directions.
2. Differences in Speed Test Design
Past research has produced many different approaches to measuring throughput, available bandwidth, capacity etc. Section 5 summarizes the related work in this area, explaining the differences between these approaches. In recent years, however, Ookla and NDT7 have become the two predominant “speed tests”. Both rely on TCP for transport and attempt to measure the capacity of the path between the client and server by sending as much traffic as possible (“saturating” the link) and computing a throughput value according to the number of bytes transferred over some sending window. Although both Ookla and NDT7 take this approach, their implementation differs significantly in three fundamental ways: (1) the way the client attempts to saturate, or flood, the link; (2) the end-to-end path between the client and server; (3) the sampling and aggregation of the throughput metrics.
Flooding mechanism.
The mechanisms that Ookla and NDT7 use to (or attempt to) saturate the client-server path are quite different. NDT7 opens only a single TCP connection and runs for a fixed duration, ten seconds. Ookla, on the other hand, is known to use multiple TCP connections (Overturf, 2019). In our study, we found that Ookla varies both the number of TCP connections and the test length in response to changes in the measured throughput over the course of the test (see Section 3.2). The latest versions of both Ookla and NDT7 use TCP websockets.
End-to-end path.
Ookla and NDT7 both measure the throughput of an end-to-end network path, which depends on the test server. Ookla and NDT7 manage and operate their server infrastructure in very different ways. Any network can operate an Ookla server, but servers are typically selected based on client proximity, as measured by latency. On the other hand, NDT7 servers are owned and operated by a single organization (Measurement Lab). In addition, Ookla servers are sometimes “on net” (within the same ISP as the client), while NDT7 servers are typically “off-net” because they reside in data centers. Connecting to a test server that is off-net means potentially traversing multiple networks, including transit networks and interconnection points, that may introduce bottlenecks during a test. In the past, for example, it has been shown that transit providers such as Cogent have served as bottlenecks for NDT7 tests, and that these transit providers have prioritized test traffic in times of congestion, thereby affecting the accuracy of the test (List, 2014). Section 4.3 discusses some of these decisions in more detail.
Sampling and aggregation.
The beginning of a TCP connection has a period called “slow start”, whereby the client and server transfer data at a rate that is slower than the steady state transfer rate. Packet loss can also cause a TCP sender to significantly reduce its sending rate. Such variability, particularly at the beginning of a transfer, introduces a design choice about how to sample and aggregate the instantaneous sending rate, as well as where to sample (i.e. from the sender or receiver). Both NDT7 and Ookla report throughput based on the amount of data transferred in the TCP payload. NDT7 reports the average throughput over the entire test (bytes transferred / test time). The sampling methodology for Ookla’s latest version is not public. The legacy HTTP-based Ookla client sampled throughput 20 times and discarded the top 2 and the bottom 25% samples, thus, effectively disregarding the TCP slow start period (Ookla, 2019b). Although the latest version does not use the same sampling method (manually verified by inspecting traces), we do observe some form of sampling whereby it discards low throughput samples.
3. Controlled Measurements
In this section, we explore how Ookla and NDT7’s design and implementation affect their accuracy in controlled network settings, where we know and control the “ground truth” network conditions. We explore in particular how these two tools report throughput under a variety of network conditions, under a range of latency and packet loss conditions, as well as how the choice of TCP congestion control algorithm affects reported speed. Although we focus on Ookla and NDT7, we explore how specific aspects of the test design (e.g., number of TCP connections, test duration) affect the reported speeds under different network conditions. As such, these results can help predict the behavior of other similarly designed speed test tools.
3.1. Method and Setup
For all of our in-lab measurements, we simplify the end-to-end path and connect the client directly to the server via an ethernet cable. We host both the NDT7 and Ookla server daemon on the same physical server. This setup allows us to control the network conditions at the client, server, and the path in between, thus ensuring that any observed differences between Ookla and NDT7 are a result of design and implementation differences between the tests, as opposed to an artifact of changing network conditions along the end-to-end path. We use the native speed test clients for both the in-lab measurements and the wide-area measurements in the next section because the native client provides metadata (e.g., socket-level information, test UUID) that the browser version does not provide. In practice, most users run speed tests through the browser version of these respective tools, despite the fact that both tools also offer native clients. To understand potential effects of browser-based measurements, we compare speed test measurements from both the native and browser clients (Section 3.3); we find no significant difference in the results reported from each modality. This finding is a positive and somewhat surprising result, as early browser-based speed tests did have difficulty achieving more than 200 Mbps (Feamster and Livingood, 2020).
Finally, because of a bug we discovered in NDT7 (discussed in more detail in Section 3.4), for all NDT7 tests we calculate the throughput of NDT7 upload tests using the TCPInfo (based on the throughput calculated by the server at the kernel level) information, as opposed to the value reported to the user, which uses AppInfo (based on the sending rate of the client at the application level).
Hardware.
The server and client are run on identical System76 Meerkat (meer6) desktops (Intel 11th Gen i5 @2.4Ghz, 16-GB DDR memory, and up to 2.5 Gbps throughput) running Ubuntu 20.04.
Software.
For a measurement server, we used ndt-server version 0.20.6 and Ookla daemon build 2021-11-30.2159. Because there is no publicly available Ookla daemon, we collaborated with the developers at Ookla to obtain a custom version. For native client tests, we used ndt-client-go version 0.5.0 and Ookla version 3.7.12.159. For browser-based tests, we use Google Chrome version 100.0.4896.75. We used the tc netem package to set link capacity, latency, and packet loss. Both the server and client use the TCP BBR congestion control algorithm unless otherwise stated.
To facilitate our analysis, we define the accuracy as the reported speed, divided by the true link capacity (i.e., the value that we configure with tc). Despite its name, we do expect this metric to be a fraction that is always strictly less than 1, due to packet header and protocol overhead. This metric enables us to compare results across a range of network conditions, including different link capacities.
3.2. Effects of Network Conditions
We first study how accurately NDT7 and Ookla measure the link capacity under different network conditions. We are interested in quantifying the effects of both (1) the mechanisms used to flood the network path and (2) the sampling technique used to calculate the final speed. To do so, we show both the average throughput (calculated using traffic headers) and the final reported throughput. The average throughput computation enables us to compare results from the different approaches, even if the tools report different numbers as a result of different sampling and aggregation techniques. Having isolated these effects, we can then separately quantify the effect of sampling technique by comparing the final reported speed and the average throughput.
Link capacity.
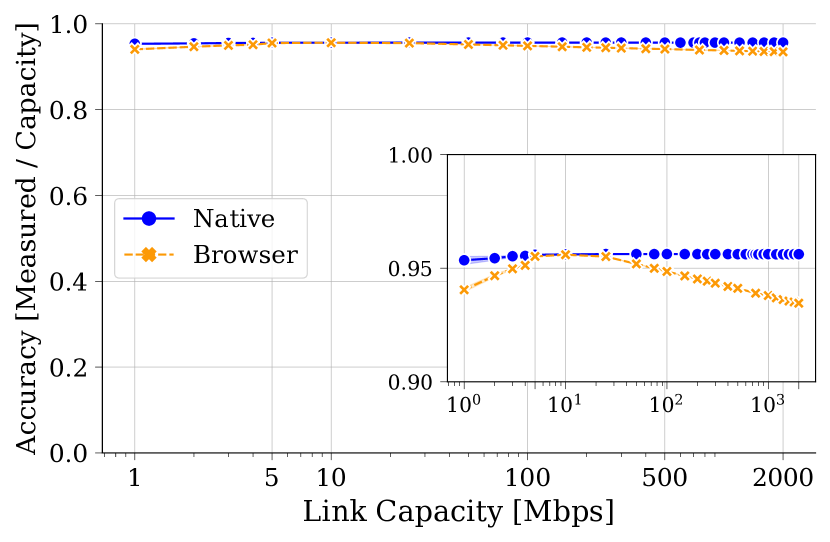
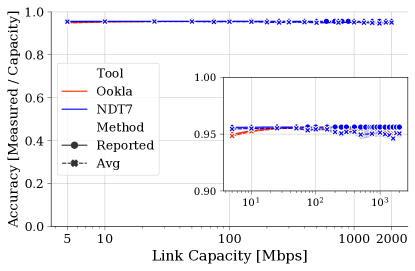
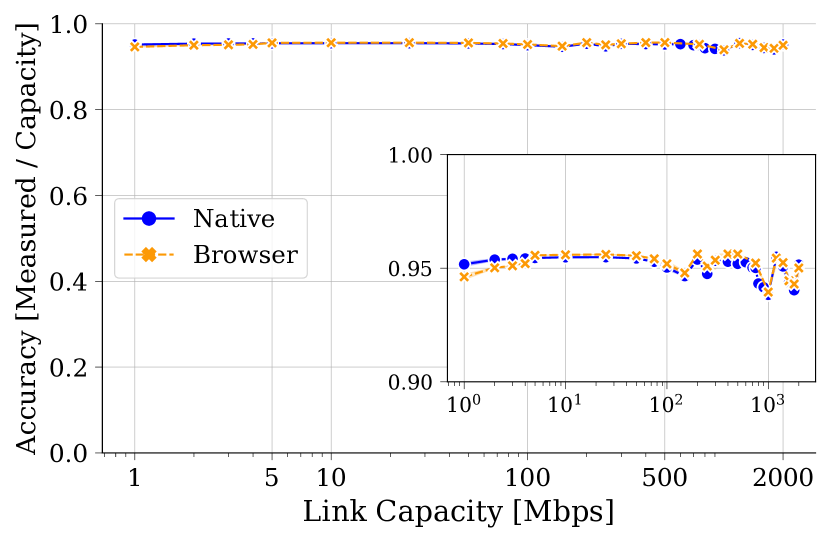
Figure 1 shows each tool’s accuracy when measuring downstream throughput under different link capacities. The results show that there is no significant difference between Ookla and NDT7, in terms of both the reported and average data transfer. Both tools can achieve 95% link saturation up through a 2 Gbps bandwidth connection using only a single TCP connection. Past work (Sundaresan et al., 2011; Bauer et al., 2010) has suggested that a speed test using only a single TCP connection cannot typically achieve a throughput that approaches link capacity, typically maxing out at 80% of the capacity. Our results likely differ because client operating systems (a bottleneck suggested in previous work from Bauer (Bauer et al., 2010)) have improved and the design of speed tools has changed. The results in previous studies of NDT (Sundaresan et al., 2011; Bauer et al., 2010) concern the original NDT version, which differs from the current implementation of NDT7 in several important ways. Most notably, the original NDT server used TCP Reno, which often prevented the tests from saturating the link (Lab, 2020b). The current NDT7 server uses TCP BBR (Lab, 2022b). Absent high latency or packet loss, both tools achieve similar accuracy across a wide range of link capacities. Upload accuracy under different uplink capacities, shown in Figure B.1 in the Appendix, show the same trends, with even less variability.

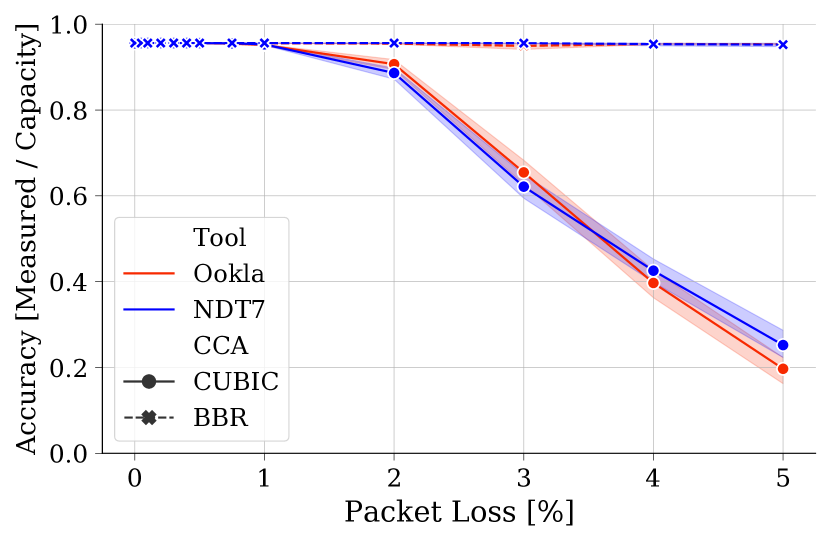
Packet loss.
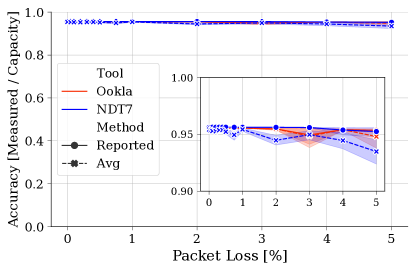
To study how the packet loss between the server and client affects the accuracy of Ookla and NDT7, we fix the uplink and downlink capacity to 100 Mbps and introduce random loss along the path between the client and server. For both NDT7 and Ookla, packet loss up to 5% has very little impact. Figure 2(a) shows how download accuracy varies as packet loss is induced. The range of reported speeds and average throughputs are within 0.3% for Ookla and 2% for NDT7. We see little accuracy degradation because both the server uses TCP BBR as their congestion control algorithm, which does not use packet loss as a congestion signal.
| Rank | Country | Total Tests | ¿ 100ms | ¿ 200ms |
|---|---|---|---|---|
| 1 | USA | 22.9M | 4.4% | 1.5% |
| 2 | India | 15.7M | 12.7% | 4.7% |
| 3 | Brazil | 6.5M | 22.5% | 11.5% |
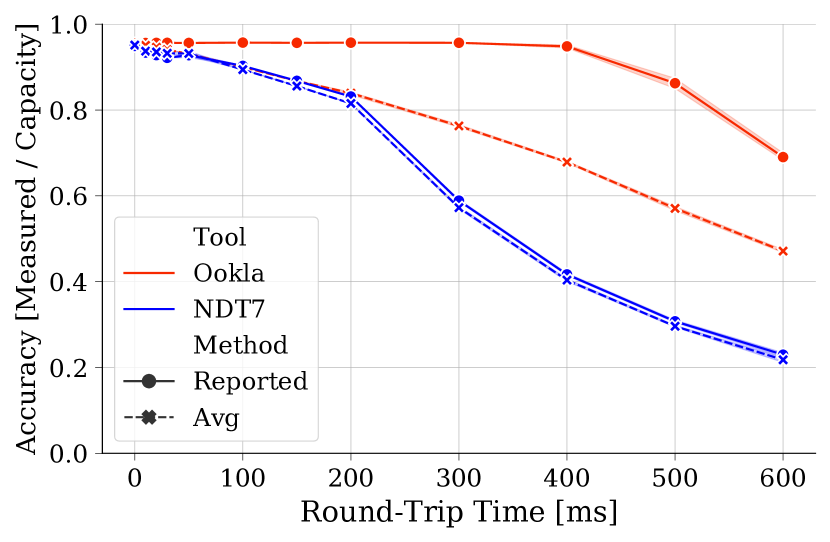
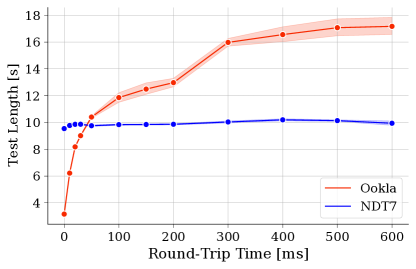
Latency.
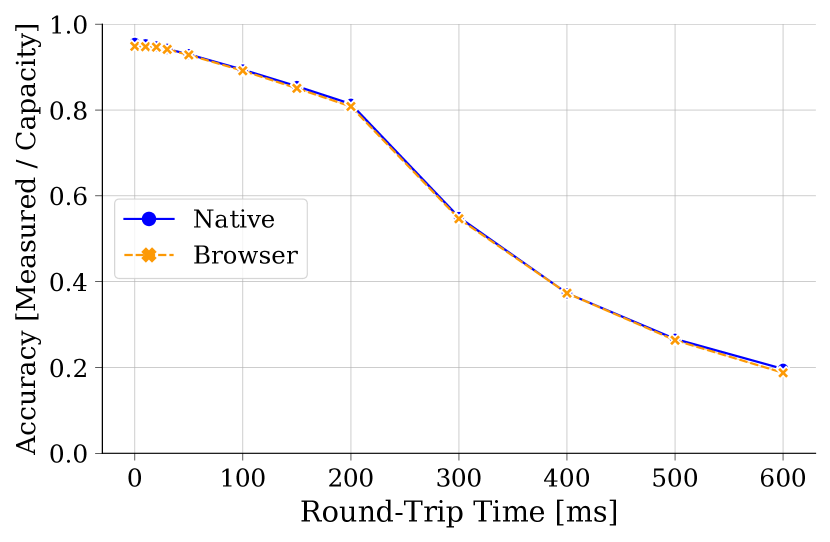
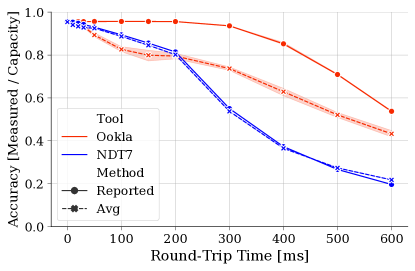
We now study the effects of latency on speed test accuracy for a 100 Mbps link capacity. Figure 2(b) shows download accuracy is affected as round-trip time (RTT) increases. Looking first at reported speed, Ookla is unaffected by the increase in RTT until round-trip latency exceeds ms. Meanwhile, the median speed reported by NDT7 decreases to 90% of the link capacity at only ms, further degrades to 83% at ms. The difference in reported speeds is maximum at ms, with Ookla and NDT7 reporting a median speed of 87 Mbps and 31 Mbps, respectively.
These latency effects are potentially significant because they imply that if a client test selects a path to a server with high latency, then reported throughput could be significantly lower—especially in the case of NDT7, which is more sensitive to high-latency paths. An important question, then, is how often high-latency tests exist. To answer this question, we analyze metadata from recent NDT7 tests to see how often NDT7 tests are conducted when the RTT is at least 200 ms. We consider the reported minimum RTT for the tests conducted in April 2022 from the United States, India, and Brazil, the top three countries in terms of number of tests. Table 2 shows the percentage of NDT7 tests whose minimum round-trip latency exceeds 200 ms. All three of these countries see high latency tests, and in Brazil, 11.5% of NDT7 tests conducted involve paths where the round-trip latency exceeds 200 ms. Our in-lab analysis suggests that these tests would lead to reported speeds of 17% lower than the link capacity (or 12% lower than Ookla) for a 100 Mbps link.
Figure 2(b) also illustrates how the choice of a sampling and aggregation technique to report a throughput result can affect the robustness of the reported result under high-latency conditions. As latency increases, Ookla’s average throughput (dashed red line) begins to decrease while Ookla’s reported speed (solid red line) remains constant. Ookla’s sampling technique discards lower throughput samples, resulting in a reported throughput that remains high, even as the average throughput achieved by the test itself decreases. At higher latency, a TCP connection takes longer to increase its sending rate—averaging still includes this low-throughput interval, but Ookla’s sampling method discards them and calculates the final speed using only the higher throughput samples collected towards the end of the test.
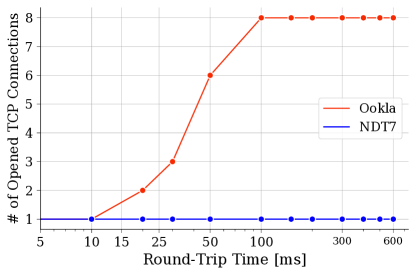
We investigate why Ookla’s average throughput does not degrade similar to NDT7 when RTT exceeds 200 ms. When inspecting the packet traces from the speed test, we observed that Ookla adapts both the number of TCP connections used and the test duration in response to the instantaneous measured throughput over the course of the test, whereas NDT7 does not. Ookla begins to use multiple TCP connections at ms of RTT, increasing the number of connections to as many as eight, at RTT higher than ms. In contrast, NDT7 only uses a single connection regardless of latency (see Figure B.3 for details). As for test length, Ookla begins to increase the median test length from seconds at ms to median test length of 11 seconds at ms—and seconds at ms, as shown in Figure B.4. Longer tests allow Ookla’s throughput to get closer to the link capacity than NDT7, whose tests take between and seconds, regardless of latency. Past work has suggested that Ookla’s test is not adaptive but instead uses a fixed length (Yang et al., 2021); our results show that the assertion from past work is incorrect, and likely based on outdated documentation from Ookla (Ookla, 2014).
Cross-Traffic.
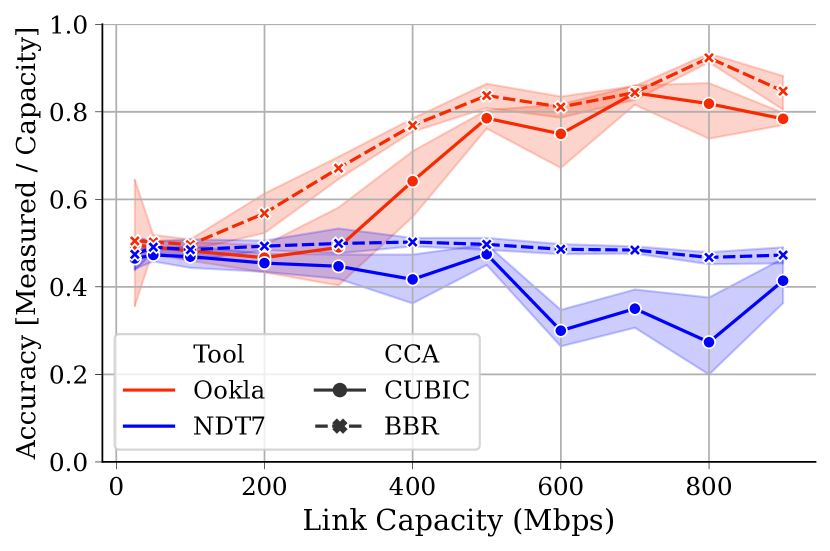
Next, we study the effect of background traffic on the speed reported by each tool. To do so, we run a speed test while a single-threaded iPerf3 TCP flow runs in the background between the same client and server machines. We initiate this TCP flow ten seconds before conducting the speed test. We then repeat this experiment under different link capacities. We set the buffer size of the bottleneck router to be equal to the bandwidth-delay product in all of these experiments.
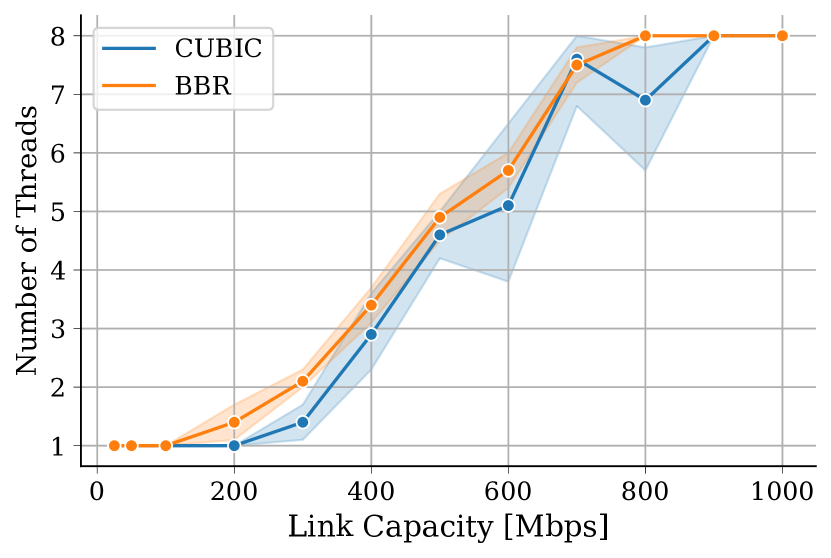
Looking first at NDT7 in Figure 3(a), the reported values are close to half of the link capacity for both TCP BBR and CUBIC. We might expect this outcome as a consequence of resource sharing— NDT7 uses only a single TCP connection and both BBR and CUBIC are designed to fairly share the link when both flows have the same RTT (Ha et al., 2008; Hock et al., 2017). We do observe that NDT7 reports speeds lower than when the capacity exceeds 600 Mbps under TCP CUBIC. It is not clear why NDT7 achieves less than its fair share of capacity in these cases. We suspect it may be due to interactions between the application and transport layer. In contrast, Ookla using TCP CUBIC reports a fair share () up to 300 Mbps, but reports values as high as 80% of the capacity when link capacity is greater than 500 Mbps. We see a similar trend when Ookla uses TCP BBR, the only difference being that the reported speeds become greater than the fair share at lower speeds, i.e., at 200 Mbps. Upon further inspection, we find that Ookla starts using more than one TCP connection when the underlying link capacity is high (see Figure 3(b)). This behavior appears to depend on the link capacity and differs slightly for the two TCP congestion control algorithms. Ookla using TCP BBR starts opening multiple connections at a lower link capacity than it does when using TCP CUBIC, which explains why the reported values are higher for TCP BBR. We did not find any trends corresponding to test duration, indicating the higher speed values are mostly due to the use of multiple TCP connections, not length of test.
Our finding that Ookla and NDT7 behave very differently in the presence of cross-traffic raises an interesting and important discussion about the complexity of speed measurements and the “correct” way to characterize the results, especially given that many crowd-sourced measurements likely experience some amount of cross-traffic. Specifically, NDT7 reports a single connection’s fair share of capacity, whereas Ookla reports the results of a more aggressive approach that relies on multiple parallel connections. It is thus critical to interpret the measurements from these tools in context, because some applications (e.g., web browsing) tend to behave more like Ookla, whereas others (e.g., simple file transfer) may behave more like NDT7. In this vein, greater transparency about how these tools are designed—and what the measurement results likely reflect, in context, as we have done in this paper—would almost certainly be beneficial to anyone who uses these tools or the resulting data.
3.3. Effects of Client Modalities
In addition to variable network conditions, client-side usage modalities can affect the accuracy of Ookla and NDT7. We study the effect of two such modes: (1) choice of TCP congestion control algorithm (CCA) and (2) choice of client types (browser vs. native).
3.3.1. Congestion Control Algorithm
We compare two commonly used TCP CCAs— CCAs that have been used in these speed tests—TCP CUBIC and TCP BBR. We choose these algorithms because TCP CUBIC is the default CCA on all current Linux, Windows, and Mac machines while TCP BBR is the CCA recommended for the NDT7 test. In addition, TCP CUBIC and TCP BBR use different congestion signals, packet loss and changes in latency, respectively. In this part of our study, we study only upsteam throughput measurements, as the choice of client-side CCA only affects the sending rate.
Latency.
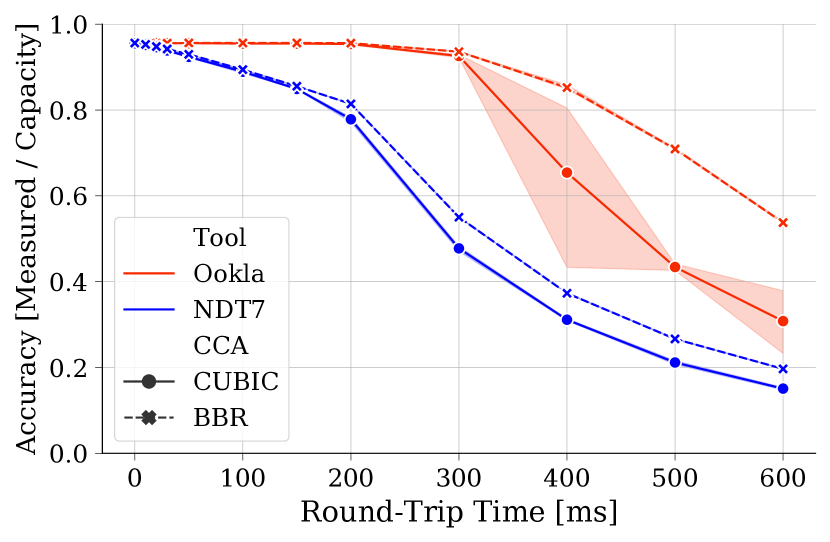
Figure 4(a) shows the reported speed at the indicated round-trip times for different client-side CCAs. The difference in average speed between clients running TCP BBR and TCP CUBIC can be up to 27% of the link capacity for Ookla, and as much as 7% of the link capacity for NDT7. The greater discrepancy for Ookla is caused by Ookla opening multiple TCP connections when using TCP BBR but not for TCP CUBIC. It is unclear why the choice of CCA causes this behavior.
Loss.
When using TCP CUBIC, both Ookla and NDT7 experience severely reduced accuracy at packet loss rates at 2% and higher. Figure 4(b) shows how Ookla and NDT7 accurately measure link capacity under different CCAs and packet loss regimes. As expected, clients running TCP CUBIC suffer because CUBIC uses packet loss as a congestion signal and slows it’s sending rate, whereas TCP BBR is resilient to losses.
3.3.2. Client Type
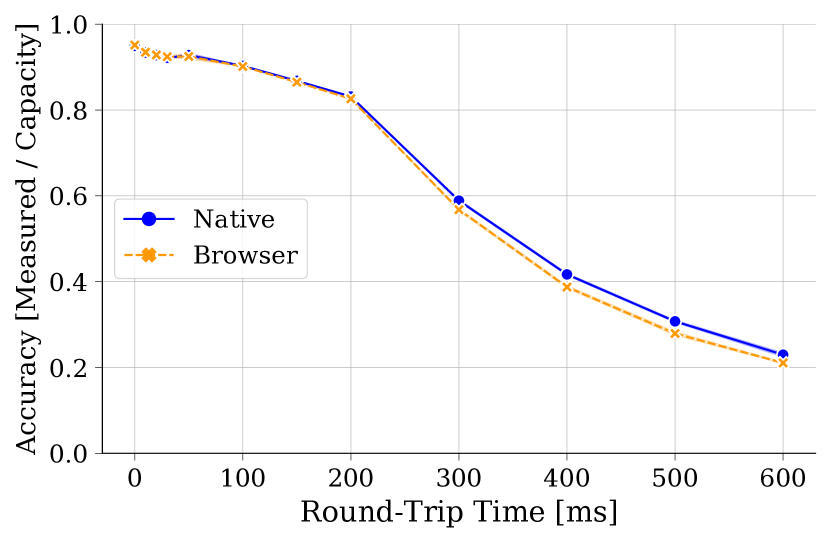
In this section, we compare the accuracy of the NDT7 browser client and the NDT7 native (command-line) client. We perform these experiments for two reasons: (1) in the past, browser-based tests have been less accurate at high link capacities (Feamster and Livingood, 2020); (2) it is likely that most speed tests are conducted using the browser. There is no readily available way to conduct the same comparison for Ookla because it is not open-source, and we cannot configure the test server in Ookla’s current browser client.
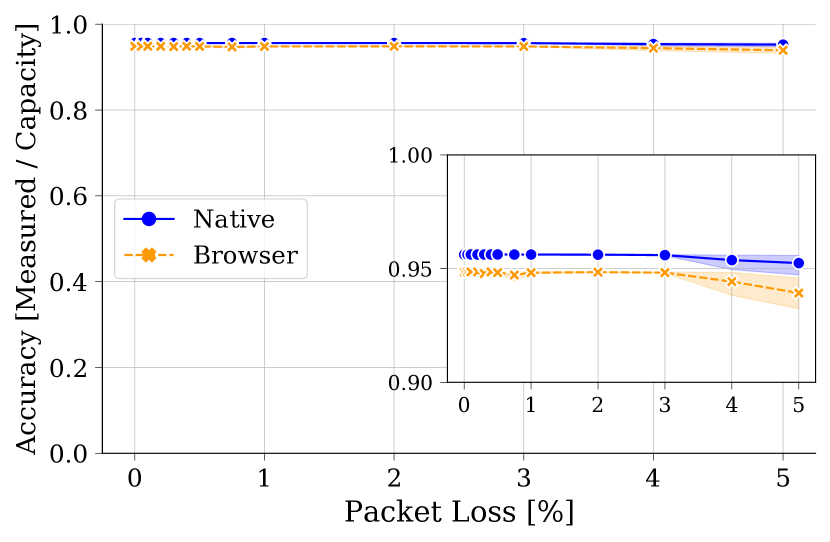
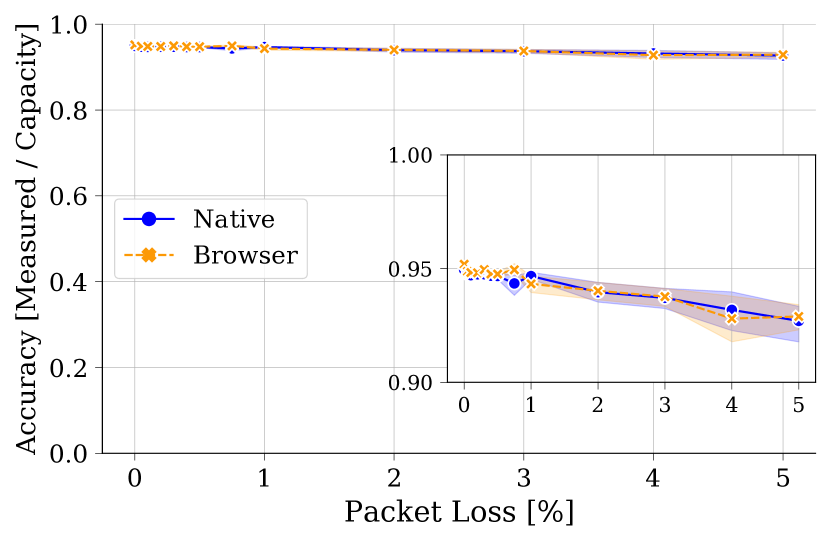
Figure 5 shows the NDT7 upload accuracy for both the native and browser client as the network conditions vary. Recall that we calculate speed using the TCPInfo messages for both the native and browser client. Overall, there is very little difference in accuracy between the two client types. As packet loss and latency between the client and server is induced, the difference in median accuracy between the browser and the native client is within 1%. Although there is a small dip in accuracy as the link capacity is increased, the difference is less than 2%.
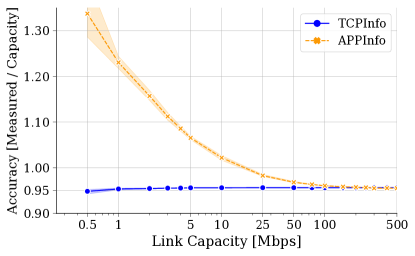
3.4. NDT7 Upload Test Inconsistencies
Our controlled experiments revealed that the NDT7 native client would report upload speeds exceeding the link capacity by up to 34%. Upon making this observation, we studied how the NDT7 native client calculates the final reported speed. The remaining section discusses how we isolated the inconsistency, identified the bug in NDT7, and communicated the finding (and fix) to the Measurement Lab team.
During an NDT7 test, the client and server exchange two types of messages: AppInfo messages and TCPInfo messages. The AppInfo messages track the amount of data transferred at the application level, while the TCPInfo messages track the amount of data transferred at the kernel-level. Before fixing the bug, the native ndt-go-client used the AppInfo messages to calculate speed. This choice only affects upload results, as this method counts all bytes sent to the TCP socket, as opposed to bytes that are successfully sent across the network. Because download speed is also calculated at the client, only successfully received bytes are counted, so the calculation method does not affect the reported download speed.
Figure 6 shows how NDT7 upload accuracy varies across different link capacities when calculated using the AppInfo and TCPInfo messages. The native NDT7 client reports a throughput greater than the link capacity at link capacities under 10 Mbps. At 0.5 Mbps, the native NDT7 client reports a speed that is 134% of the link capacity. It would thus be inappropriate to AppInfo to measure upstream throughput. This discrepancy is of special concern for measuring upstream throughput on residential networks, where it is common for the provisioned uplink capacity to be under 10 Mbps. In light of this finding, we also verified how the NDT7 browser calculated the final speed. To our surprise, we found that the browser calculates upload speed using the TCPInfo messages, not the AppInfo messages.
We communicated our findings to the NDT7 team at Measurement Lab, who have already implemented a bug fix for the NDT7 native client to use the TCPInfo messages instead of the AppInfo messages to compute the speed. Because the NDT7 native client sends data in units of size up to 1 MB, the number of transferred bytes at the sender and receiver can differ by up to 1 MB. This characteristic explains why tests at lower link capacities exhibited greater relative differences than tests at higher link capacities. Although this bug is fixed now, it has implications for analysis of past data. Since many NDT7 native client tests were conducted when speed was calculated using the AppInfo messages, we suggest to recalculate the upload speeds using the TCPInfo statistics available in the Measurement Labs BigQuery database when analyzing past data (Lab, 2020a). Takeaway: NDT7 upload tests conducted using the native client report speeds greater than the link capacity for link capacities under 10 Mbps. This overestimation is caused by the native client reporting sender-side statistics. This inaccuracy is especially important to consider in the context of residential networks, for which upload speeds (especially for historical data) may be less than 10 Mbps.
4. Wide-Area Measurements
We complement our in-lab analysis with a longitudinal study of Ookla and NDT7 on a set of diverse, real-world residential networks. In this study, we conduct at least daily Ookla and NDT7 speed tests over a 9-month period. We begin by asking “how often do Ookla and NDT7 report different speeds and to what extent?”. To answer this question, we compare the reported speeds from the paired Ookla and NDT7 tests. Although differences in test design (e.g. sampling mechanisms) might explain small differences in reported speed , they do not explain larger differences. To this end, we investigate how differences in the Ookla and NDT7 client-server network path might cause these larger differences.
4.1. Method and Setup
We deploy Raspberry Pis (RPis) in households, spanning ISPs from November 2021 to August 2022. All the households are located in a major city. A focused geography enables us to measure the same subset of Ookla or NDT7 server infrastructure from multiple vantage points; thus, enabling discovery of server-side issues in Section 4.3. We recruited these households with the help from various community organizations, as well as our own local outreach initiatives. We made significant efforts to minimize bias by ensuring our sample size spans households from different neighborhoods, ISPs, and speed tiers.
We use Raspberry Pi 4 Model B devices (Quad-core Cortex-A72 CPU, 8GB SDRAM, and up to 1 Gbps throughput). Each RPi conducts a series of active measurements, including at least daily Ookla and NDT7 speed tests at random times of day. We eliminate any WiFi effects and conduct the speed test directly by connecting the RPi to the network router via Ethernet. We verify that the speed test results are not limited by the RPi hardware by performing in-lab tests comparing the RPis against the desktop machines used for controlled experiments. We see no significant performance difference between RPis and desktop machines for download tests. For upload tests, we do observe that, for link capacities of 900 Mbps and 1 Gbps, NDT7 tests conducted on the RPi are on average 5% lower than those conducted on the desktop. Ookla reports lower speeds at 1 Gbps on the RPi than on the desktop. Figure B.7 shows this comparison at various link capacities. These discrepancies should not affect our conclusions at the speeds we test because (1) most ISP offerings for residential networks are significantly lower than 1 Gbps (e.g., up to 35 Mbps for Comcast DOCSIS Cable); (2) our analysis compares Ookla and NDT7 speeds relative to each other, and both tools degrade similarly due to RPi except at speeds above 900 Mbps.
Pairing Ookla and NDT7 tests.
To isolate the effects of Ookla and NDT7’s server infrastructures, we must hold all other test conditions constant, meaning we must control for the network conditions present along the parts of the end-to-end path that Ookla and NDT7 tests have in common. Because network load can vary over time, comparing Ookla and NDT7 test results taken from different points in time would be to inaccurately compare the network in two different states. As such, we conduct paired speed tests, whereby we run Ookla and NDT7 tests back to back. This approach ensures that the network conditions along the shared portion of the end-to-end path are reasonably similar during both tests. Running the tests back to back may introduce bias as the first test may starve any background traffic giving advantages to the second test . However, we find that is not the case through in-lab experiments. This is because the first test runs both download and upload test followed by a period of minimal network activity when the second test is picking a server. Thus, there is enough time gap between download tests of the two tools for any persistent background flow to recover.
Normalizing speed.
We surveyed participants about their speed tiers in the beginning of the study. However, we found discrepancies in the reported speed tier and the measured speeds in a few cases. Moreover, a few participants changed their Internet service plan during the course of the study, resulting in different download and/or upload speeds. Given the lack of ground truth speed tier, we rely on measured speeds. Specifically, we define the nominal speed for a given household to be the 95th percentile speed across all speed tests of a given tool from that household. We choose the 95th percentile in accordance with past work that studied Internet performance in residential networks (Sundaresan et al., 2011). Using the nominal speed, we compute the normalized speed for each test as follows:
| (1) |
where is the speed reported by test and is the th percentile result across all speed tests from that particular household. In addition to using the nominal speed to normalize test results, we use it when assigning households to different speed tiers.
Tier changes.
We identify speed tier changes by manually inspecting each household’s speed test results over time. To accommodate speed tier changes in our study, we treat measurements taken before and after the speed tier upgrade as two distinct households. In total, we observe instances of download speed tier change and instances of upload speed tier change. Therefore, we end up with a different number of households for download and upload tests: and , respectively.
Characterizing test frequency.
For download tests, there is a median of 336 paired tests across households, with a minimum of 32 and maximum of 3,381. For upload tests, there is a median of 347 paired tests, minimum of 32 and maximum of 3,381 for each household. The CDF of the number of tests is shown in Figure B.8. For each household, we run Ookla and NDT7 tests at least once daily for an average of 128 days and median of 108 days. As many households we study have ISP-imposed data caps, we set a limit on the monthly data consumption our tests can use. Households with higher speed connections will consume more data per test and thus will run fewer tests than household with lower speed connections. Over the course of our deployment, high-speed (¿ 500 Mbps download) households have a median of 241 paired tests while low-speed (¡ 500 Mbps download) households have a median of 640.
4.2. Comparing Paired Speed Tests
Conducting paired tests allows us to directly compare Ookla and NDT7 results because both tests were run under similar access link conditions. In this section, we characterize the differences in reported speed for each paired test. We consider the following questions: (1) for each household, is the average difference in reported speeds over time statistically significant and (2) for each paired test, how often and to what extent do the reported speeds differ?
4.2.1. How often do the average test results differ?
Method.
Using longitudinal measurements from each household, we analyze whether the average difference between the speed reported by Ookla and NDT7 is statistically significant. We leverage the fact that we have paired observations and test for significance using a paired t-test. Our sample satisfies the assumptions required to conduct paired t-test as follows: (1) the measurements are collected at random time intervals, (2) the Ookla and NDT7 tests are conducted back-to-back, creating a natural pairing, and (3) the number of paired observations per network is great enough (¿ 30) to satisfy the normality condition (Peck et al., 2009).
The null hypothesis, , is that for a given household, the average difference between each pair of Ookla and NDT7 tests is 0. For each household, we then compute the p-value, or the probability of observed values under the null hypothesis. Using a significance level , we then reject if the calculated p-value is less than . We choose based on the norms in other fields where hypothesis testing is more common. Choosing can be interpreted as there being a 1% chance of rejecting , when is true (Peck et al., 2009).
Results.
For download tests, we can reject for 82.2% of households (111 out of 135) and can conclude that the average difference in reported speeds is statistically significant for those 111 households. Turning next to upload tests, we can reject the null hypothesis for only 59.8% (79 out of 132) households. This is likely because 72% of households have much lower upload speeds (¡ 50 Mbps). For these lower upload speed households, the ISP access link is likely the bottleneck. As observed in our in-lab tests, both tools report similar values under low bottleneck link capacity.
Focusing now exclusively on households for which we could reject , we calculate the mean difference between Ookla and NDT7 speeds for these households. For download tests, the mean difference is within 5% (10%) of the maximum test mean for 75 (91) out of 111 households. Similarly, for upload tests, the mean difference is within 5% (10%) of the maximum test mean for 50 (61) out of 79 households. Thus, overall, the average differences between Ookla and NDT7 are either not statistically significant or within 5% (when they are statistically significant) for 73% and 78% households, for download and upload tests, respectively.
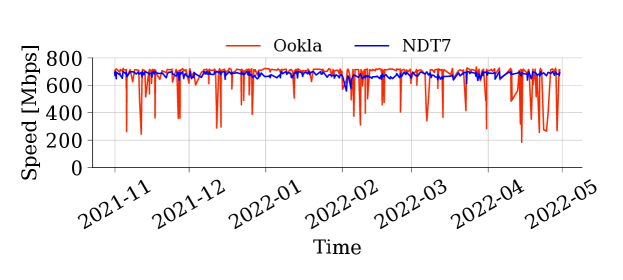
In comparison to average differences, we find that the difference within individual paired test can be high. Figure 7 illustrates the download speeds reported by Ookla and NDT7 tests over time for a single household, for which the average difference between NDT7 and Ookla results was not statistically significant (p-value = ). For of paired tests from this household, NDT7 reports a lower speed (up to 80 Mbps lower) than Ookla. However, Ookla occasionally reports a much lower speed (up to 400 Mbps lower), bringing the Ookla average speed closer to that of NDT7. Given this range in differences within a single paired test, we next study the magnitude and frequency of these differences within each paired test.
4.2.2. How much do individual test results differ?
Method.
We now study the difference in reported speeds for each paired test. For our analysis, we first compute the signed relative difference () for each paired test:
| (2) |
and are the speeds reported by Ookla and NDT7, respectively. Dividing the difference by the maximum of two speed values bounds to .
Interpreting .
If , Ookla reported a higher speed than NDT7 for that paired test, and vice-versa if . The magnitude of indicates the size of the difference between the two tests. For example, if , then the speed reported by NDT7 is 5% lower than the speed reported by Ookla. Similarly, if , then the speed reported by Ookla is 25% lower than the speed reported by NDT7.
For each paired test, we compute and classify it into one of six classes based on . Each class is defined by the direction of the difference (whether Ookla or NDT7 reports a higher speed) and the magnitude of the difference. Table 3 defines the classes and how to interpret them.
| Difference | Bin | |
|---|---|---|
| Low | ||
| Medium | ||
| Ookla reports a higher speed | High | |
| Low | ||
| Medium | ||
| NDT7 reports a higher speed | High |
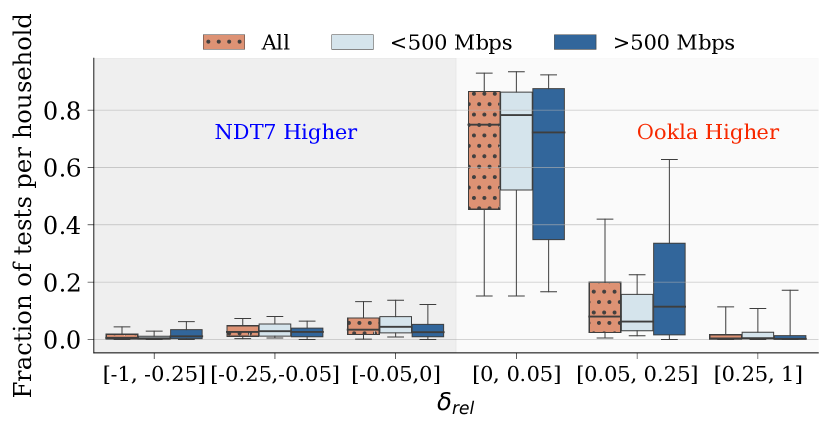
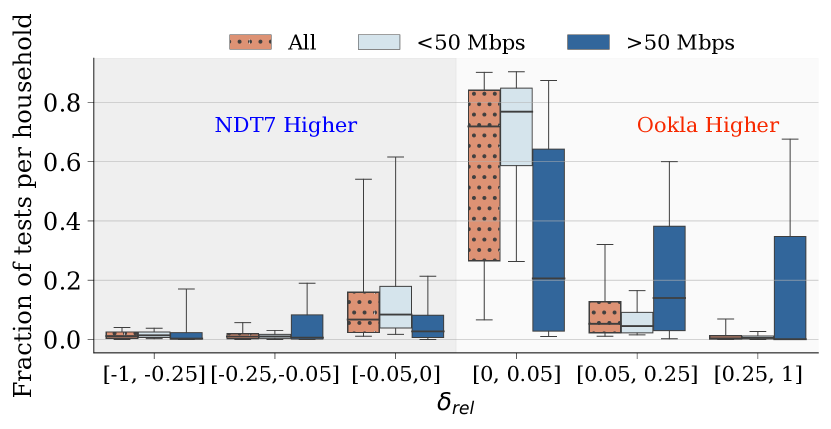
We then compute the fraction of paired tests that fall into each category for each household. This approach allows us to characterize the frequency of paired tests with low, medium, and high difference in reported speed. We analyze the distribution for each household instead of looking at the distribution across all households for two reasons: 1) each household is unique in that the network conditions present vary between households and 2) the number of paired tests from each household is not uniform. Figure 8 shows the distribution for each paired test class, where each point is the fraction of tests that fall into that class for a given household.
Results.
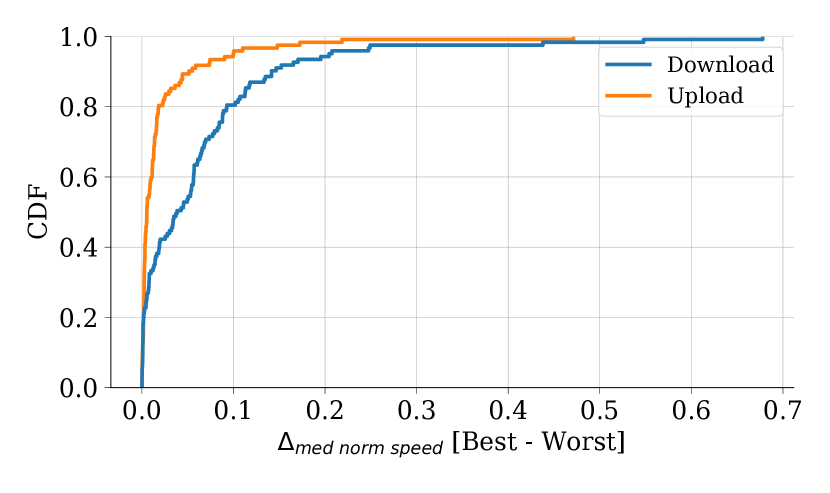
Figure 8(a)) shows that, in the case of downstream throughput, for most paired tests, Ookla reports a slightly higher speed than NDT7. Across all households, the median fraction of paired tests for which is 91.3%. It is likely that differences of this magnitude are caused by differences in the test protocol, for which Ookla’s sampling mechanism discards low-throughput samples and NDT7’s does not. The fraction of paired tests with medium and high difference is much lower. For medium differences, the median fraction of paired tests for which (Ookla reports a higher speed) is 9.6%, while the median fraction of paired tests for which (NDT7 reports a higher speed) is 3.9%. As for high differences, the median fraction of paired tests within [0.25, 1] (Ookla reports a higher speed) is only 0.3%, while the median fraction of paired tests within [-1, -0.25] (NDT7 reports a higher speed) is 0.6%. It is thus more common for a given household to have Ookla report a speed that is 25% lower than NDT7 as opposed to vice versa. This finding aligns with trends observed for the sample household shown in Figure 7, where Ookla, while typically reporting slightly higher speeds, would occasionally report a significantly lower speed.
We further partition households into high and low speed tiers. A household is classified in the high downlink speed tier if the nominal download speed (defined in Equation 1) is greater than 500 Mbps, otherwise it is classified in the low downlink speed tier. As for uplink speed tiers, a household is classified as high-speed if the nominal upload speed is greater than 50Mbps and low speed otherwise. As such, a household may be in the high downlink speed tier but the low uplink speed tier. We see that households in the high downlink speed tier (¿500 Mbps) have a greater fraction of paired tests with medium and high differences than households in the low speed tier (500Mbps). For example, there is a median of 13.7% of paired tests for which among high downlink speed tier households, while the corresponding fraction for low speed downlink households is only 7.2%. The trends are similar for paired upload tests (see Figure 8(b)): the 75th percentile fraction of paired tests within [0.25, 1] among high speed (¿ 50 Mbps) households is 34.7% compared to just 1.2% for low speed (¡ 50 Mbps) networks.
We believe these variations could result from two factors. First, as the available throughput in real-world networks is variable, more so at high speed, the flooding and sampling mechanisms have an impact on the reported speed. Our in-lab experiments indicate that Ookla has clear advantages over NDT7 in this respect, given its use of multiple TCP connections, adaptive test length, and sampling strategy of discarding low throughput samples. Second, for high speed tiers, it is possible that the bottleneck link for one or both the tests is not the ISP access link but a link further upstream. Takeaway: The average difference in reported speed is either not significant or within 5% of the average test values in up to 73% and 78% households for download and upload tests, respectively. For individual test pairs, we observe significant differences – the median fraction of paired tests for which NDT7 reports a speed that is 0–5% lower than Ookla is 91.3% and a speed that is 5–25% lower is 9.6%.
4.3. Effect of Server Selection
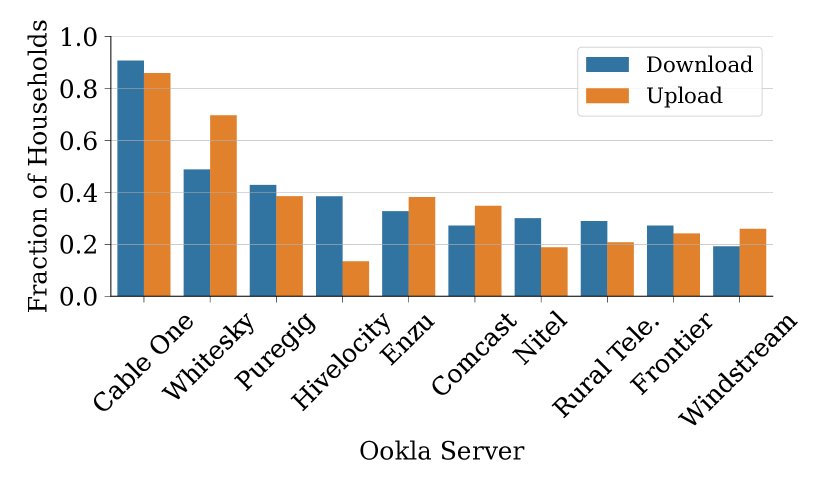
| Rank | AS Name | AS Type | % of Tests | % Households |
|---|---|---|---|---|
| 1 | Nitel | ISP | 24.4% | 98.3% |
| 2 | Puregig | ISP | 13.8% | 96.6% |
| 3 | Whitesky | ISP | 8.6% | 87.3% |
| 4 | Comcast | ISP | 8.0% | 80.6% |
| 5 | Windstream | ISP | 6.9% | 92.4% |
| 6 | Frontier | ISP | 5.9% | 89.0% |
| 7 | Cable One | ISP | 5.7% | 94.9% |
| 8 | Rural Telecom | ISP | 4.1% | 57.9% |
| 9 | Hivelocity | Cloud Service | 3.0% | 39.4% |
| 10 | Enzu | Cloud Service | 2.7% | 42.8% |
| Rank | AS Name | % of Total Tests |
|---|---|---|
| 1 | GTT | 19.62% |
| 2 | Tata Communications | 19.49% |
| 3 | Cogent | 19.38% |
| 4 | Level3 | 19.36% |
| 5 | Zayo Bandwidth | 19.24% |
Server infrastructure.
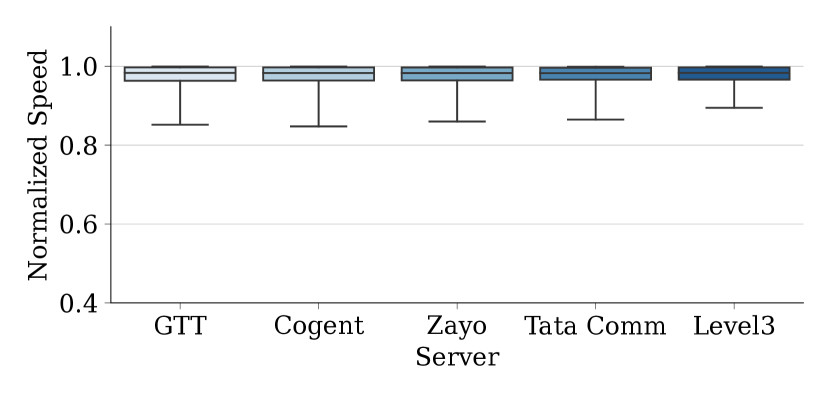
We first characterize the set of servers observed over the course of our deployment. Across all households and tests, we observe 32 unique NDT7 servers. The top 15 most used NDT7 servers service 97.1% of all NDT7 tests. In light of this, we limit our analysis to these 15 servers. Looking next at each NDT7 server hostname, we find five different Tier-1 networks, with 3 of the 15 servers co-located with each Tier-1 network (Table 5).
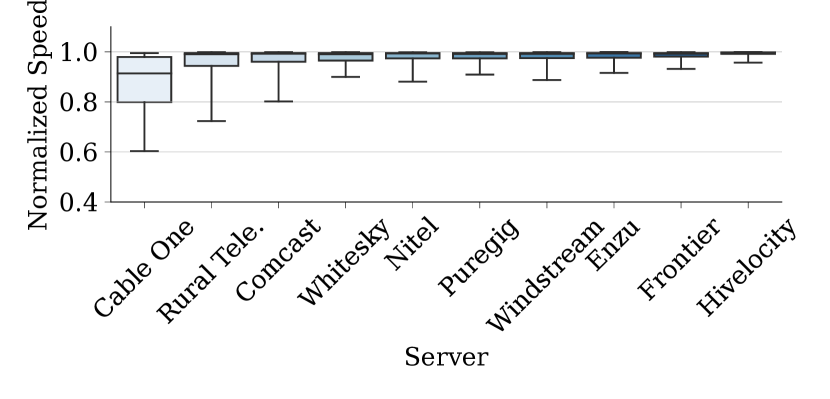
As for Ookla, we observe far greater diversity in where servers are placed. We observe 56 unique Ookla servers. For the remaining analysis, we characterize the top 10 most commonly used Ookla servers. The top 10 servers account for 83.6% of all Ookla tests conducted by our deployment fleet (Table 4). The hostname, which we further validate with an IP lookup, indicates that 8 of the 10 servers are co-located with consumer or enterprise ISP network, while the remaining two are co-located with a cloud provider.
We next study how often households use each server. For NDT7 tests, we find each server is used roughly equally across tests. This is expected as NDT7 uses M-Lab’s Naming Server to find the server (Lab, 2022a). The default policy of the naming server returns a set of nearby servers based on client’s IP geolocation. The NDT7 client then randomly selects a server from this set. As for Ookla, some servers are used disproportionately more than others. This is in line with Ookla’s server selection policy. The Ookla client pings a subset of nearby test servers (selected using client IP geolocation) and picks the server with minimum ping latency (Ookla, 2019a).

Performance variation across servers.
We now study how the reported speed varies with the choice of the server. We group all test results by server and then compute the normalized speed for each test, as defined in Equation 1. Figure 9 shows the distribution of normalized download speeds across different servers for both Ookla and NDT7. For NDT7, we find that the distribution of normalized speed is similar across test servers. The bottom 10% of tests across all NDT7 servers have speeds at least 11%-16% lower than the household’s nominal speed depending on the server. On the other hand, several Ookla servers show higher variability than others. For instance, the median normalized speed for tests conducted using Cable One’s Ookla server is 0.91, suggesting that when using Cable One’s server, 50% of tests report speeds at least 9% lower than the household’s nominal speed. In contrast, the median normalized speed for Rural Telecom’s Ookla server is 0.99.
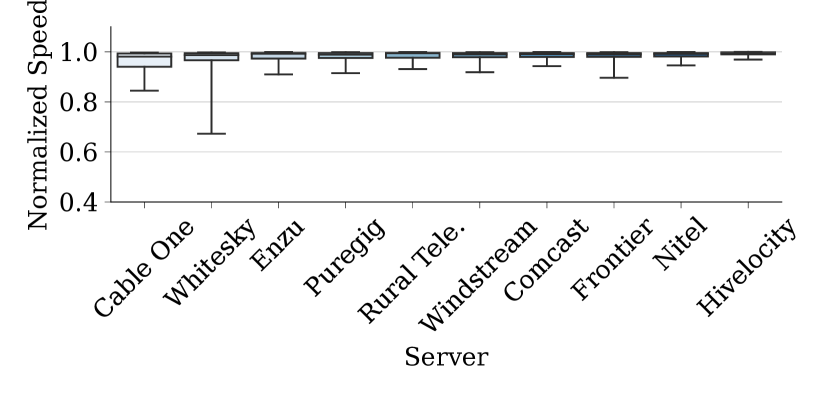
For upload tests (Figure 10), we observe a similar trend. The distribution of normalized speed is similar across NDT7 servers, while several Ookla servers show greater variability than others. Specifically, for Ookla, Comcast’s and Cable One’s server report a median normalized speed of 0.99 and 0.98, respectively, while the percentile normalized speed is 0.94 and 0.84, respectively. This heterogeneity across Ookla servers could be caused by either server underprovisioning or issues in the end-to-end network path between the client and Ookla server.
Because the number of tests per households varies, certain households with many tests may be overrepresented in the overall trends. To determine whether these trends hold for individual households, for each household, we rank Ookla servers by the median normalized speed from tests that used that server. We remove servers for which fewer than 10 tests used that server. Figure 12 shows the proportion of households for which a given server is among the three lowest ranked servers for that household. Cable One’s server is a bottom three server for 90% and 85% of households, for download and upload tests, respectively. Similarly, Whitesky’s server is a bottom three server for 48% and 69% households, for download and upload tests, respectively.
Finally, we quantify the difference between Ookla servers within a household by computing the median normalized speed of the highest and the lowest ranked server, denoted by . Figure 12 shows the CDF of across households. For download tests, the worst servers report a difference of 0.1 or greater for 20% of the users. The difference in upload tests is smaller, with 5% users reporting a difference of at least 0.1, likely because most access links have slower upload than download speeds.
4.4. Effect of Time of Day
Past work has suggested that ISPs experience higher loads at certain “peak” usage periods, leading to a corresponding increase in network congestion (Sundaresan et al., 2011). If true, the time of day at which a speed test is run may affect the reported speed. In this section, we analyze our deployment data to see if the effect is similar for Ookla and NDT7. In accordance with previous work (Sundaresan et al., 2011), we define peak hours as 7–11 p.m.
For this analysis, we use a two sample t-test, or independent t-test, because we are comparing two independent populations. We define our null hypothesis to be that for a given household, the average reported speeds for tests conducted in peak and off-peak hours are equal. To satisfy the normality condition, we only test households for which we have at least tests from both peak and off-peak hours. Enforcing this condition leaves households with sufficient download tests and households with sufficient upload tests. Recall that we treat households that undergo speed tier upgrades as two separate households, explaining why the number of households differ for download and upload tests. As in Section 4.2.1, we use a significance level () of 0.01.
| Direction | Tool | # Rejecting | % Rejectng |
|---|---|---|---|
| NDT7 | 37 | 40.7% | |
| Download (n = 91) | Ookla | 21 | 23.1% |
| NDT7 | 7 | 7.5% | |
| Upload (n = 93) | Ookla | 9 | 9.7% |
Table 6 summarizes the results. For download tests, we find sufficient evidence to reject for NDT7 on 40.7% of households, but only 23.1% of networks for Ookla. This difference suggests that the time of day at which the speed test is conducted has a greater effect for NDT7 than for Ookla. Furthermore, the set of households for which we can reject for NDT7 is a strict superset of the set of households for which we can reject for Ookla. For this fact and the fact that we run paired tests, we can attribute the discrepancy in the number of networks to the specific tool, not the access network (which we control for). The different behavior of Ookla and NDT7 can be due to one or both of the following: (1) the client-server paths for NDT7 have more cross-traffic during peak hours than Ookla; (2) the test protocol, especially use of multiple threads and sampling heuristic by Ookla, makes Ookla more resilient to cross traffic than NDT7. For upload tests, we can only reject on 7.5% and 9.7% of households for NDT7 and Ookla, respectively; this decrease may be the result of asymmetry in upload and download traffic loads.
5. Related Work
Speed test design.
There are two primary ways to measure throughput: (1) packet probing and (2) flooding. Most packet probing techniques send a series of packets and infer metrics like available bandwidth or link capacity based on the inter-arrival packet delay (Keshav, 1991; Dovrolis et al., 2001; Ribeiro et al., 2003; Jain and Dovrolis, 2002; Hu and Steenkiste, 2003). More recently, Ahmed et al. (Ahmed et al., 2020) estimate bandwidth bottlenecks by probing the network using recursive in-band packet trains. However, these techniques can be inaccurate especially for high speed networks due to their sensitivity to packet loss, queuing policy etc. As a result, most commercial speed tests, including ones offered by both ISPs (AT&T, 2022; Comcast, 2022) and non-ISP entities (Ookla, 2022; Lab, 2022c; Netflix, 2022), are flooding-based tools that work by saturating the bottleneck link through active measurements.
Evaluating speed tests.
Feamster and Livingood (Feamster and Livingood, 2020) discuss considerations with using flooding-based tools to measure speed. They do not, however, conduct empirical experiments to characterize NDT7 and Ookla performance. Similarly, Bauer et al. (Bauer et al., 2010) explain how differences in speed test design and execution contribute to differences in test results. Bauer et al.’s work differs from ours in several ways. First, both Ookla and NDT have seen major design changes in the 12 years since that study. Both tools have updated their flooding and sampling mechanisms, and NDT’s latest version (NDT7) uses TCP BBR instead of TCP Reno. Second, they only analyze public NDT data and do not study both Ookla and NDT in controlled lab settings, nor did they conduct paired measurements in the wide area that allows direct comparison of Ookla and NDT, as we do. Complimentary to our comparative analysis is work by Clark et al. (Clark and Wedeman, 2021) that provides recommendations on how to use aggregated NDT data, including considering the self-selection bias and other end-user bottlenecks like slow WiFi and outdated modems.
Residential broadband.
Goga et al. (Goga and Teixeira, 2012) evaluate the accuracy of various speed test tools in residential networks, yet tools have changed and speeds on residential networks have increased more than since this study ten years ago. Sundaresan et al. (Sundaresan et al., 2011) studied network access link performance in residential networks more than ten years ago. Whereas our work is more focused on characterizing speed test tools, this work examined network performance differences across ISPs, looking at latency, packet loss, and jitter in addition to throughput. Canadi et al. (Canadi et al., 2012) use publicly available Ookla data to analyze broadband performance in metropolitan regions. Finally, the Federal Communications Commission (FCC) conducts the Measuring Broadband America project (MBA) (fcc, 2022), an ongoing study of fixed broadband performance in the United States. The FCC uses SamKnows whiteboxes (SamKnows, 2022) to collect a suite of network QoS metrics, including throughput, latency, and packet loss. Because the MBA project maps broadband Internet performance across different ISPs, they use a single speed test—a proprietary test developed by SamKnows—and do not consider Ookla or NDT7. Most recently, Paul et al. (Paul et al., 2022) analyze crowdsourced data from M-Lab and Ookla speed tests. That work focuses on contextualizing speed test data that has already been collected by inferring the end-user broadband subscription plan from existing measurements. This paper studies a different, complementary concern: how the speed test methodology affects the reported speeds. Although they also find that Ookla reports higher median speeds than NDT7, our approach is quite different. We compare back-to-back NDT7 and Ookla tests from individual households, while Paul et al. compare aggregate test data from the same ISP and same inferred subscription plan at a city-level.
6. Conclusion
This paper provided an in-depth comparison of Ookla and NDT7, focusing on both test design and infrastructure. Our measurements, both under controlled network conditions and wide area network using paired tests, present new insights about the differences in behavior of the two tools. Yet, while this work is the first to perform such a controlled and extensive comparison between these speed test tools, we neither hope nor expect that it will be the last, and note that many important questions remain, both in the technical and policy realms. Below we summarize the implications of our findings for the future of speed test tools and data analysis and outline multiple avenues for future work.
NDT7 and Ookla, not NDT7 or Ookla.
Some readers may (mis)interpret our results as an endorsement or condemnation of a particular measurement tool—but that is not our intention at all. We believe, based on our findings—and the notion that there are many facets to Internet speed—that the existing datasets can all be useful, provided that the users of the data understand the measurement techniques used to gather the data, as well as the limitations of each tool that may make it more (or less) appropriate for specific questions. Both NDT7 and Ookla provide a wealth of measurements, and each dataset offers valuable measurements from the edge of the Internet, as well as complementary coverage and perspective. NDT7 in particular also offers an open-source tool and method that can be rigorously tested (and improved upon); indeed, this very research has allowed us to highlight bugs and shortcomings of the NDT7 tool and infrastructure that the developers have since fixed. It is worth noting, however, that the tools are designed, implemented, and deployed differently, and therefore measure slightly different phenomena, resulting in divergent results under different network conditions and circumstances. While no single approach is “correct” or “incorrect”, it is critical to understand how different network conditions and deployments—from cross-traffic to high latency to interconnect congestion—may affect the numbers that each of these tools may report, as well as how their results may diverge.
It is also important to note that the design of speed tests—and NDT in particular—has evolved over time, and thus warrants continual re-appraisal. For instance, past work found that NDT is limited by its use of a single TCP connection, leading to it underestimating speed on high capacity paths (Feamster and Livingood, 2020; Bauer et al., 2010). Our results, however, indicate that for most in-lab and real-world cases, Ookla and NDT7 report similar speeds. NDT7’s improved results are likely due to many factors, including improvements to the tool implementation, to browsers and operating systems as well as migration to different transport protocols (e.g., TCP BBR). As such, our work provides a methodology to comprehensively assess these tools as they continue to evolve. Nevertheless, we recommend greater transparency into the test design and updates to enable practitioners to better understand the reported speed.
Implications for speed data analysis.
Our study reveals specific network conditions where Ookla and NDT7 yield inaccurate results:
-
•
NDT7 reports lower speeds when the client-server latency is high (e.g., RTT ¿ 100ms for a 100 Mbps link) and data from such high latency tests should be discarded.
-
•
The client software version can impact the test accuracy. For instance, we found the the initial version of NDT7 client we used was over-reporting upload speeds as it relied on client-side measurements. NDT7 software releases are accompanied with release notes that can help identify if (and how) the older version impacted test accuracy.
-
•
The longitudinal WAN measurements highlight significant performance differences between Ookla’s servers. This warrants the need for careful auditing of server-side issues and even server selection methods that currently only rely on latency measurements. An alternative could be to use results from past measurements of clients within the same IP subnet to select optimal server.
More generally, it is important to account for the network conditions, testing context (e.g., device and software version), and test parameters (e.g., test duration, number of TCP connections) while analyzing the speed data. We recommend that the speed test tools provide such metadata along with speed results for a more accurate analysis of speed data.
How generally do these results apply?
Our in-lab experiments were conducted over a comprehensive set of network conditions, and we thus expect the results from the in-lab experiments to apply broadly. We conducted these controlled in-lab experiments to insulate the tools from the effects of a wide range of network conditions, from consumer devices to WiFi effects, that can occur in real-world deployments and skew crowdsourced measurements. The controlled experiments vary only one network parameter at a time to isolate the effect of that parameter on the accuracy of these widely used speed tests. To our knowledge, a controlled, comparative study between these tools has never been performed at this scale—and certainly not for the modern versions of NDT7 and Ookla. Readers and users of these tools should be able to read the results from the in-lab experiments to gain a general understanding of how these tools are likely to behave under certain circumstances.
Moreover, the in-lab results can be extended to the design and use of other speed tests that rely on flooding the bottleneck link to measure throughput. This work highlights the effects of a number of design choices, including the test length, number of TCP connections, and sampling technique on the speed reported by each test. These characteristics are not specific to the tests that we study in this paper, and designers and users of of these and others speed tests (and their data) can draw insights from the findings in this study. For example, the results of Section 3 confirm that a speed test tool that uses multiple TCP connections or runs for a longer duration will report higher speeds under high latency and background traffic than a tool that uses a single TCP connection or runs for a shorter duration.
The wide-area experiments have a different purpose: To understand how these tools might produce divergent measurements in operational access networks. To do so, we performed a longitudinal study for nine months, across nearly 126 homes in a large metropolitan area, covering about 30 neighborhoods and all of the major ISPs for that city. Although the sample is comprehensive and longitudinal, it is important to recognize that this sample does omit certain ISPs, and in particular certain types of ISPs. For example, the sample does not contain fixed 5G providers, which is an increasingly common mode of home Internet access in certain geographies. Our deployment study, however, is ongoing, and the measurement tools and analysis that we have produced is open-source and public. Several other regions in the country are now, in fact, adopting our software and tools for their own studies. To this point, conducting a wide-area study of these tools in different geographies and settings, with a different sample, continues to be an excellent avenue for ongoing and future work—particularly as both Internet access and the tools to measure it continue to evolve.
7. Acknowledgments
This work was supported by National Science Foundation awards CNS-2224687 and CNS-2223610 and a data.org Inclusive Growth and Recovery Challenge Award. We thank the reviewers and our shepherd, Zubair Shafiq, for helpful comments. We are also grateful to Guilherme Martins, Marc Richardson, and Grace Chu for their help in building the data collection platform and recruiting participants for the study of residential networks.
References
- (1)
- fcc (2022) 2022. Measuring Broadband America. https://www.fcc.gov/general/measuring-broadband-america
- Ahmed et al. (2020) Adnan Ahmed, Ricky Mok, and Zubair Shafiq. 2020. Flowtrace: A framework for active bandwidth measurements using in-band packet trains. In Passive and Active Network Measurement. Springer.
- AT&T (2022) AT&T. 2022. AT&T Internet Speed Test. https://www.att.com/support/speedtest/
- Bauer et al. (2010) Steven Bauer, David D Clark, and William Lehr. 2010. Understanding broadband speed measurements. TPRC.
- Boak (2022) Josh Boak. 2022. Biden Administration to Release $45B for Nationwide Internet. https://apnews.com/article/technology-broadband-internet-643949e239296f4f5154509d4c40de73
- Canadi et al. (2012) Igor Canadi, Paul Barford, and Joel Sommers. 2012. Revisiting broadband performance. In Proceedings of the 2012 Internet Measurement Conference. ACM.
- Clark and Wedeman (2021) David D. Clark and Sara Wedeman. 2021. Measurement, Meaning and Purpose: Exploring the M-Lab NDT Dataset. SSRN Scholarly Paper. Rochester, NY.
- Comcast (2022) Comcast. 2022. Xfinity Speed Test. https://speedtest.xfinity.com/
- Commission (2021) Federal Communications Commission. 2021. Measuring Broadband America Program. https://www.fcc.gov/general/measuring-broadband-america
- Commission (2022) Federal Communications Commission. 2022. FTC Takes Action Against Frontier for Lying about Internet Speeds and Ripping Off Customers Who Paid High-Speed Prices for Slow Service. https://www.ftc.gov/news-events/news/press-releases/2022/05/ftc-takes-action-against-frontier-lying-about-internet-speeds-ripping-customers-who-paid-high-speed
- Dovrolis et al. (2001) Constantinos Dovrolis, Parameswaran Ramanathan, and David Moore. 2001. What do packet dispersion techniques measure?. In Proceedings IEEE INFOCOM.
- Feamster and Livingood (2020) Nick Feamster and Jason Livingood. 2020. Measuring internet speed: current challenges and future recommendations. Commun. ACM (2020).
- Goga and Teixeira (2012) Oana Goga and Renata Teixeira. 2012. Speed measurements of residential internet access. In Passive and Active Network Measurement. Springer.
- Ha et al. (2008) Sangtae Ha, Injong Rhee, and Lisong Xu. 2008. CUBIC: a new TCP-friendly high-speed TCP variant. ACM SIGOPS operating systems review 42, 5 (2008), 64–74.
- Hock et al. (2017) Mario Hock, Roland Bless, and Martina Zitterbart. 2017. Experimental evaluation of BBR congestion control. In 2017 IEEE 25th International Conference on Network Protocols (ICNP). 1–10. https://doi.org/10.1109/ICNP.2017.8117540
- Hu and Steenkiste (2003) Ningning Hu and Peter Steenkiste. 2003. Evaluation and characterization of available bandwidth probing techniques. IEEE Journal on Selected Areas in Communications (2003).
- Jain and Dovrolis (2002) Manish Jain and Constantinos Dovrolis. 2002. Pathload: A measurement tool for end-to-end available bandwidth. In Passive and Active Measurements (PAM) Workshop.
- Keshav (1991) Srinivasan Keshav. 1991. A control-theoretic approach to flow control. In Communications architecture & protocols.
- Lab (2020a) Measurement Lab. 2020a. BigQuery QuickStart. https://www.measurementlab.net/data/docs/bq/quickstart/
- Lab (2020b) Measurement Lab. 2020b. Evolution of NDT. https://www.measurementlab.net/blog/evolution-of-ndt/
- Lab (2022a) Measurement Lab. 2022a. M-Lab Name Server: Server Selection Policy. https://github.com/m-lab/mlab-ns
- Lab (2022b) Measurement Lab. 2022b. NDT (Network Diagnostic Tool). https://www.measurementlab.net/tests/ndt/
- Lab (2022c) Measurement Lab. 2022c. Speed test by Measurement Lab. https://speed.measurementlab.net/
- List (2014) Measurement Lab Mailing List. 2014. Discussion of Cogent’s prioritization of Measurement Lab’s traffic. https://groups.google.com/a/measurementlab.net/g/discuss/c/hqvIPYkIus0/m/iJp48rPXwAoJ
- List (2017) Measurement Lab Mailing List. 2017. Measurement Labs (NDT) Speedtest is incorrect? https://groups.google.com/a/measurementlab.net/g/discuss/c/vOTs3rcbp38
- Netflix (2022) Netflix. 2022. fast.com. https://fast.com/
- of the Attorney General (2020) New York State Office of the Attorney General. 2020. New York Internet Health Test. https://ag.ny.gov/SpeedTest
- Ookla (2014) Ookla. 2014. (Outdated) Ookla Speed Test Methodology - Legacy HTTP client. https://sandboxsupport.speedtest.net/hc/en-us/articles/202972350
- Ookla (2019a) Ookla. 2019a. How does Ookla select a server? https://help.speedtest.net/hc/en-us/articles/360038679834
- Ookla (2019b) Ookla. 2019b. Ookla Speed Test Methodology. https://help.speedtest.net/hc/en-us/articles/360038679354
- Ookla (2020a) Ookla. 2020a. About Ookla SpeedTests. https://www.speedtest.net/about
- Ookla (2020b) Ookla. 2020b. Case study: Ookla and NDT data comparison for upstate New York. https://www.ookla.com/articles/better-funding-decisions-accurate-broadband-network-data
- Ookla (2022) Ookla. 2022. Speedtest by Ookla - The Global Broadband Speed Test. https://www.speedtest.net/
- Overturf (2019) Carin Overturf. 2019. How does Speedtest measure my network speeds? https://help.speedtest.net/hc/en-us/articles/360038679354-How-does-Speedtest-measure-my-network-speeds-
- Paul et al. (2022) Udit Paul, Jiamo Liu, Mengyang Gu, Arpit Gupta, and Elizabeth Belding. 2022. The Importance of Contextualization of Crowdsourced Active Speed Test Measurements. In Proceedings of the 22nd ACM Internet Measurement Conference (Nice, France) (IMC ’22). Association for Computing Machinery, New York, NY, USA, 274–289. https://doi.org/10.1145/3517745.3561441
- Peck et al. (2009) Roxy Peck, Chris Olsen, and Jay L. Devore. 2009. Chapter 11: Comparing Two Populations or Treatments.
- Press (2022) Idaho County Free Press. 2022. Push on internet speed tests to increase chance at 1B USD in funding. https://archive.ph/RWdY8
- Ribeiro et al. (2003) Vinay Joseph Ribeiro, Rudolf H Riedi, Richard G Baraniuk, Jiri Navratil, and Les Cottrell. 2003. pathchirp: Efficient available bandwidth estimation for network paths. In Passive and active measurement workshop.
- SamKnows (2022) SamKnows. 2022. https://www.samknows.com/
- Sharma et al. (2022) Ranya Sharma, Tarun Mangla, James Saxon, Marc Richardson, Nick Feamster, and Nicole P Marwell. 2022. Benchmarks or Equity? A New Approach to Measuring Internet Performance. A New Approach to Measuring Internet Performance (August 3, 2022) (2022).
- Sundaresan et al. (2011) Srikanth Sundaresan, Walter De Donato, Nick Feamster, Renata Teixeira, Sam Crawford, and Antonio Pescapè. 2011. Broadband internet performance: a view from the gateway. ACM SIGCOMM computer communication review (2011).
- the Net (2022) Battle For the Net. 2022. Internet Health Test based on Measurement Lab NDT. https://www.battleforthenet.com/internethealthtest/
- UChicago (2022) Internet Equity Initiative UChicago. 2022. Speed test data collected from Netrics. https://github.com/chicago-cdac/netrics-data
- University and Lab (2019) Pennsylvania State University and Measurement Lab. 2019. Broadband Availability and Access in Rural Pennsylvania. https://www.rural.pa.gov/publications/broadband.cfm
- Yang et al. (2021) Xinlei Yang, Xianlong Wang, Zhenhua Li, Yunhao Liu, Feng Qian, Liangyi Gong, Rui Miao, and Tianyin Xu. 2021. Fast and Light Bandwidth Testing for Internet Users.. In NSDI.
Appendix A Statement of Ethics
We obtained approvals from our Institution Review Board (IRB) before deploying RasPi devices in participants’ households. We have uploaded the consent form that was shared with each participants before signing up. At each step in the study, we have taken utmost care about user privacy. The RasPi devices deployed in the household collect only active measurements. In fact, we can not monitor any user network traffic due to our network setup. We also remove any privacy-sensitive user identifiers (e.g., physical address, demographics) before analyzing the data. Taking a broader view of ethics, our work has the potential for positive impact on society. It informs appropriate use of speedtest data which in turn has implications on accurately mapping and bridging the digital divide.
Appendix B In-Lab
B.1. Network Conditions
B.1.1. Bandwidth
B.1.2. Latency
B.1.3. Loss
B.1.4. Client Type
B.2. Real-World Deployment