Analysis of the reflection spectra of MAXI J1535-571 in the hard and intermediate states
Abstract
We report results on the joint-fit of the NuSTAR and HXMT data for the black hole X-ray binary candidate MAXI J1535-571. The observations were obtained in 2017 when the source evolved through the hard, hard-intermediate and soft-intermediate states over the rising phase of the outburst. After subtracting continuum components, X-ray reflection signatures are clearly showed in those observations. By modeling the relativistic reflection in detail, we find that the inner radius is relatively stable with during the three states, which implies that the inner radius likely extends to the innermost stable circular orbit even in the bright hard state. When adopting , the spin parameter is constrained to be at 90% confidence (statistical only). The best-fitting results reveal that the inclination of the inner accretion disc is degrees, which notably conflicts with the apparent orientation of the ballistic jet (45 degrees). In addition, both the photon index and the electron temperature increase during the transition from hard to soft state. It seems that the corona evolves from dense low-temperature in the LHS to tenuous high-temperature after the state transition, which indicates that the state transition is accompanied by the evolution of the coronal properties.
keywords:
accretion, accretion discs – black hole physics – methods: data analysis – X-rays: individual: MAXI J1535-5711 Introduction
During a typical outburst of a transient black hole binary, the black hole binary goes through different spectral states with spectral and timing properties changes. As the source luminosity increases, it evolves from the low/hard state (LHS) to the hard and soft intermediate states (HIMS, SIMS), then enters into the high/soft state (HSS, Belloni et al. 2005; Remillard & McClintock 2006). It is generally agreed that the change of spectral states is induced by the evolution of the accretion geometry of the black hole binary system.
In the HSS, the source spectrum is dominated by thermal emission ( keV) accompanied by a hard power-law tail. The accretion flow is composed of an optically thick and geometrically thin accretion disc (Shakura & Sunyaev, 1973) with its inner radius likely at the innermost stable circular orbit (ISCO, Tanaka & Lewin 1995; Steiner et al. 2010). In the LHS, the spectrum is dominated by the hard powerlaw X-rays, together with the very faint thermal component detected sometimes. The hard X-rays are produced by the inverse Compton scattering of thermal emission in a region of hot plasma, the so-called corona, and can be well described by powerlaw with . In the model of Esin et al. (1997), at a low accretion rate, the disc is truncated before it reaches the ISCO, and an advection-dominated accretion flow, which is evaporated from the accretion disc (Meyer et al., 2000; Liu et al., 2002; Qiao & Liu, 2010), is in the inner region. A disc with a truncated inner radius of several tens to hundreds of (the gravitational radius and calculated by ) has indeed been inferred by modelling the disc component of some BHXRBs, e.g., XTE J1118+480 (Esin et al., 2001). With this truncated model, the transition from the LHS to the HSS can be well explained by the extending of inner radius down to the ISCO (Plant et al., 2014). This model has also been invoked to explain the positive correlation between the X-ray photon index and the reflection strength (Zdziarski et al., 1999; Ezhikode et al., 2020; Panagiotou & Walter, 2020).
On the other hand, a black hole binary will experience HIMS and SIMS before it enters the HSS. The thermal emission and the hard X-ray emission are both strong, which leads to a softer spectrum than that in LHS. The HIMS-SIMS transition can be very rapid. They are normally distinguished by the differences in their timing properties. For instance, either a type A or a type B QPO appears in the SIMS, while a type C QPO is often shown in the HIMS. Black hole binary also shows very weak variability in SIMS (Belloni et al., 2005; Belloni, 2010). These intermediate states, as the transition states between the LHS and HSS, may provide import clues on the physical driver for state transition, thus it is important to investigate the properties of the accretion flow during the source in the HIMS and SIMS.
In addition to the hard powerlaw and the thermal emission, the relativistic reflection spectrum is frequently reported (Fabian et al., 1989; García et al., 2014; Plant et al., 2014; Dong et al., 2020a, b; Feng et al., 2022) in the X-ray spectrum of both black hole X-ray binaries (BHXRBs) and active galactic nucleus (AGNs). The reflection spectrum appears when a substantial flux of coronal photons are reflected from the surface of the disc. As a result, this reflected component includes absorption edges, fluorescent lines and a Compton hump. If the reflection emissions come from the region that is close enough to the black hole, it will be distorted by the relativistic effects, carrying the information of strong fields (Laor, 1991). The study of reflection features can provide insights on the inclination, the iron abundance, and the ionization of the disc, as well as the geometry and the electron temperature of the corona. Moreover, the detailed modeling of reflection features is an important tool to measure the inner radius of the disc (García et al., 2015; Xu et al., 2020; Sridhar et al., 2020). If the inner radius is located at the ISCO, the spin of the black hole can then be estimated (Bardeen et al., 1972). The study of the reflection spectra in different states offers an opportunity to yield important insights on the co-evolution of the disc and corona. Interestingly, in contrast to the theoretical expectation (e.g., Esin et al., 1997; Meyer et al., 2000), it has been suggested that the inner accretion disc is not truncated by moddelling the relativistic reflection in the LHS for some sources. For example, the inner radius is found to be very close to the ISCO for Cyg X-1 (Reis et al., 2010; Parker et al., 2015), GX 339-4 (García et al., 2015; Steiner et al., 2017), and MAXI J1820+070 (Buisson et al., 2019). Whether the truncation of the inner disc in LHS and at what phase the truncation appears are still in hot debate in recent years.
MAXI J1535-571 is an X-ray transient discovered in LHS by MAXI (Negoro et al., 2017a) and Swift (Kennea et al., 2017), on September 2nd, 2017 (MJD 57999). Its X-ray spectral and timing properties (Negoro et al., 2017b), together with its bright radio signals (Russell et al., 2017), strongly suggest a black hole primary. MAXI J1535-571 was also observed in the optical and infrared bands (Scaringi & ASTR211 Students, 2017; Dinçer, 2017). Its X-ray spectra started to soften on September 10th (Nakahira et al., 2017; Kennea et al., 2017), followed by the intermediate state which lasted for 2 months (Shidatsu et al., 2017). During the LHS-HIMS-SIMS transitions, low frequency QPOs were detected (Huang et al., 2018; Stevens et al., 2018; Stiele & Kong, 2018; Sreehari et al., 2019), and the evolution of compact jet and relativistic jet were reported (Russell et al., 2019, 2020). Russell et al. (2019) also constrained the jet inclination to be degrees. The source is heavily absorbed with a line-of-sight (LOS) column density larger than 1022 (Stevens et al. 2018; Cúneo et al. 2020, and the references therein). The source distance () is estimated to be kpc based on the analysis on H\Romannum1 absorption spectrum (Chauhan et al., 2019).
Xu et al. (2018) analyzed the NuSTAR data observed on September 7th during which MAXI J1535-571 was in the bright phase of the LHS. They found a strong relativistic reflection component in the NuSTAR data. They reported no significant disc truncation and a rapidly rotating black hole (>0.84 and >0.987 with the relxilllpcp and relxillcp model, respectively). Kong et al. (2020) found the spin was with the relxilllpcp model using the data obtained by HXMT, also on the September 7th, but the exposure time was less than 1 ks. Miller et al. (2018) and Sridhar et al. (2019) constrained the spin parameter using NICER and AstroSat observations, respectively. Both observations were obtained when the source was in the start of the HIMS. The best-fitting model of the NICER data indicated a high spin of , while AstroSat data indicated a moderate spin of . The inner radius and the spin are degenerate since they both affect the red wing of the fluorescent iron line. So, moderate spin may indicate a moderately truncated disc. The inconsistent values of spin also may attribute to the model difference.
Here we report a joint analysis of the NuSTAR (The Nuclear Spectroscopic Telescope Array, Harrison et al., 2013) and HXMT (Hard X-ray Modulation Telescope, or Insight-HXMT, Zhang et al. 2014) observations of MAXI J1535-571. We analyze 3 epochs data obtained as the source increased in intensity while undergoing transition from a bright-hard towards the soft state during the 2017 outburst. NuSTAR is the first focusing high-energy X-ray telescope in orbit which covers a broad energy band (3-79 keV) with unprecedented energy resolution and sensitivity in the hard X-ray band. HXMT, as the first Chinese X-ray astronomical satellite, includes three slat-collimated instruments: the Low Energy X-ray Telescope (LE, 1-15 keV), the Medium Energy X-ray Telescope (ME, 5-30 keV), and the High Energy X-ray Telescope (HE, 20-250 keV). The dataset from both satellites are not affected by photon pile-up effects. Similar spectra analysis of Cyg X-1 (Zhao et al., 2020) and MAXI J1820-070 (You et al., 2021; Zhao et al., 2021; Guan et al., 2021) using HXMT have been reported. The paper is organized as follows: in Section 2, we describe the detail of observations and data reduction; the data analysis and results are presented in Section 3; Section 4 includes discussions and Section 5 includes conclusions.
2 Observations and Data reduction
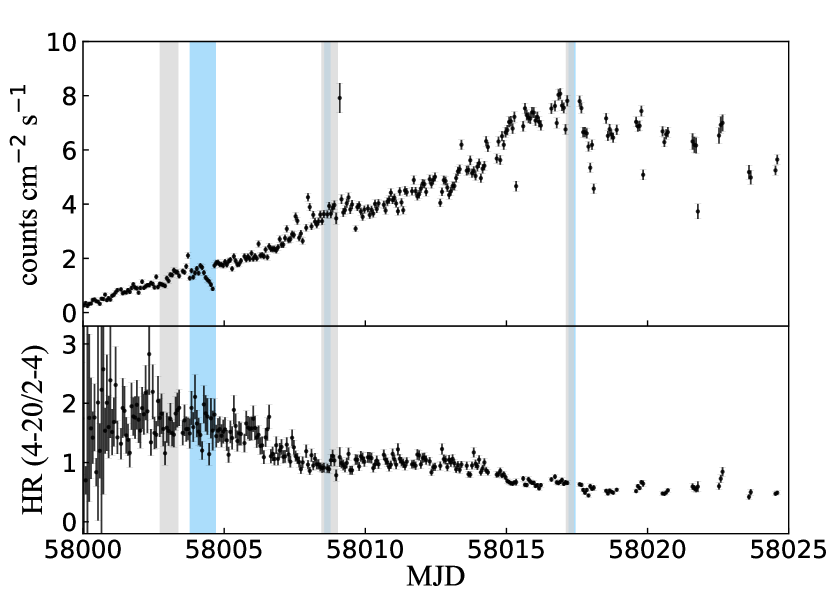
We show MAXI J1535-571’s light curve and hardness ratio obtained by MAXI (Matsuoka et al., 2009) in Figure 1. In this paper, we analyze 3 NuSTAR observations (blue shadow in Figure 1) with exposure time of 8685, 2258 and 1531 seconds, respectively. Quasi-simultaneous HXMT observations are also analyzed with exposure time of 5614.5, 4316 and 3496 seconds, respectively. We mark HXMT observations as gray shadow in Figure 1. For the data in Epoch 1 (ObsID: 90301013002), the NuSTAR and HXMT are not observed simultaneous with the NuSTAR observation carried out less than 10 hours later than the HXMT observation. However, the NuSTAR and HXMT data show roughly the same reflection spectral features (iron emission line and Compton hump region), suggesting no significant change in the reflection component, we thus still jointly analyze the NuSTAR and HXMT data to increase the signal-to-noise ratio (SNR). The including of the HXMT/LE data enable us to perform spectral analysis down to 2.1 keV which will be valuable to detect the weak thermal emission in LHS. The details of observations of both satellites can be found in Table 1. The three epoch observations are in LH, HIMS and SIMS, respectively (Huang et al., 2018; Tao et al., 2018). In the following sections, we describe the observations and data reduction for NuSTAR and HXMT.
[b]
|
Instrument | ObsID | MJD | Start Time | End time |
|
|
Total countsb | Statec | |||||
| Epoch 1 | ||||||||||||||
| NuSTAR | FPMA | 90301013002d | 58003.79 | 09-07 18:41:09 | 09-08 17:01:09 | 8685 | 1.11 | LHS | ||||||
| FPMB | … | … | … | … | 9077 | |||||||||
| HXMT | LE | 11453500104 | 58002.72 | 09-06 17:11:13 | 09-06 20:22:09 | 1047 | 8.13 | |||||||
| ME | … | … | … | … | 1331 | |||||||||
| HE | … | … | … | … | 1309 | |||||||||
| LE | 11453500105 | 58002.85 | 09-06 20:22:09 | 09-06 23:33:06 | 898 | |||||||||
| ME | … | … | … | … | 1218 | |||||||||
| HE | … | … | … | … | 1730 | |||||||||
| LE | 11453500106 | 58002.98 | 09-06 23:33:06 | 09-07 02:43:10 | 1057 | |||||||||
| ME | … | … | … | … | 1193 | |||||||||
| HE | … | … | … | … | 1543 | |||||||||
| LE | 11453500107d | 58003.11 | 09-07 02:43:10 | 09-07 05:54:06 | 937 | |||||||||
| ME | … | … | … | … | 1487 | |||||||||
| HE | … | … | … | … | 1837 | |||||||||
| LE | 11453500108 | 58003.25 | 09-07 05:54:06 | 09-07 09:05:03 | 1676 | |||||||||
| ME | … | … | … | … | 1960 | |||||||||
| HE | … | … | … | … | 378 | |||||||||
| Epoch 2 | ||||||||||||||
| NuSTAR | FPMA | 80302309002 | 58008.55 | 09-12 13:01:09 | 09-12 18:26:09 | 2258 | 5.05 | HIMS | ||||||
| FPMB | … | … | … | … | 2418 | |||||||||
| HXMT | LE | 11453500144 | 58008.44 | 09-12 10:38:15 | 09-12 13:58:12 | 1137 | 3.73 | |||||||
| ME | … | … | … | … | 2168 | |||||||||
| HE | … | … | … | … | 1684 | |||||||||
| LE | 11453500145 | 58008.58 | 09-12 13:58:12 | 09-13 00:41:28 | 3179 | |||||||||
| ME | … | … | … | … | 8202 | |||||||||
| HE | … | … | … | … | 9329 | |||||||||
| Epoch 3 | ||||||||||||||
| NuSTAR | FPMA | 80302309010 | 58017.21 | 09-21 04:51:09 | 09-21 10:46:09 | 1531 | 5.50 | SIMS | ||||||
| FPMB | … | … | … | … | 1652 | |||||||||
| HXMT | LE | 11453500901 | 58017.10 | 09-21 02:26:26 | 09-21 06:00:41 | 1676 | 5.93 | |||||||
| ME | … | … | … | … | 2967 | |||||||||
| HE | … | … | … | … | 2467 | |||||||||
| LE | 11453500902 | 58017.25 | 09-21 06:00:41 | 09-21 09:21:07 | 1820 | |||||||||
| ME | … | … | … | … | 2780 | |||||||||
| HE | … | … | … | … | 3697 | |||||||||
-
•
Note. a. The count rate is shown within the energy band of 4.0-79.0 keV for NuSTAR/FPMA and FPMB, 2.1-10.0, 10.0-27.0, 27.0-60.0 keV for HXMT/LE, ME, and HE, respectively.
b.The total number of counts are shown for the two modules of NuSTAR and the three modules of HXMT combined spectra.
2.1 NuSTAR Data Reduction
The NuSTAR data were processed using NuSTAR Data Analysis Software (NuSTARDAS v2.0.0) with CALDB v20210524, which are included in HEASOFT v6.28. We created cleaned event files using the NUPIPELINE routine. The count rate exceeds 100 counts s-1 in these 3 observations. Therefore, we set STATUEXPR to be “STATUS==b0000xxx00xxxx000”. Especially for Obs. 1, we also set saacalc = 2, saamode = strict, and tentacle =NO to remove background flares, which is caused by enhanced solar activity. The X-ray spectra, backgrounds and instrument responses were generated using NUPRODUCTS. The spectra were extracted from a circular region with radius of 180′′ centred on MAXI J1535-571, while backgrounds were extracted from a circular region with radius of 180′′ located on the same detector. The spectra were grouped with GRPPHA to have at least 30 counts within an energy bin. We choose the 4-79 keV range for the spectral analysis.
2.2 HXMT Data Reduction
HXMT includes the Low Energy X-ray Telescope (LE) , the Medium Energy X-ray Telescope (ME), and the High Energy X-ray Telescope (HE). We carried data reduction following the standard procedures for individual instruments, as the suggestions given by HXMT team. The data pipelines and tools of HXMT Data Analysis Software (HXMTDAS) v2.04 111http://hxmten.ihep.ac.cn/SoftDoc.jhtml were used. The HXMT spectra, were extracted based on the cleaned events files, which were filtered by the good time intervals (GTIs). The GTIs recommended by pipeline are intervals when (1) elevation angle greater than 10 degrees; (2) geomagnetic cut-off rigidities greater than 8 GeV; (3) satellite not in SAA and 300 seconds intervals near SAA; (4) pointing deviation to the source less than 0.04 degrees. We binned the spectra at least 30 counts within an energy bin. Then, the systematic uncertainties of 0.5%/0.5%/3% were added for LE/ME/HE to account for the instrumental uncertainties222The systematic uncertainties are related to the spectrum energy, and 1%/2%/3% are recommended for LE/ME/HE. But we found that are overestimated for LE and ME (with a less than 1) when we compare the fit statistics between HXMT and NuSTAR. Therefore, the systematic error is set to 0.5% for LE and ME.. For spectral analysis, we use 2.1-10 keV, 10-27 keV, 27-60 keV energy band for LE, ME and HE, respectively. The spectra at higher energies are dominated by the background.
Data in Epoch 1 was split into 5 continuous observations, and both Epoch 2 and 3 were split into 2. We used the following ways to check the spectral variability for all observations within one epoch. For each epoch, we performed a joint-fit with an absorbed powerlaw model to all spectra within this epoch. A constant multiplication factor was also included to account for the flux fluctuation. The parameters column density, photon index and normalization were linked among spectra. We find their data to model ratios are highly consistent. Additionally, if the photon index was allowed to be float among different observations, the value of it is consistent within the errors. Therefore, the source spectral shape is not significantly variable within each epoch. The average spectra were created with the ADDASCASPEC tool for each of the 3 epochs, and were used for the subsequent spectral analysis.
3 Spectral analysis and results
The spectral analysis are performed using XSPEC version 12.11.1 (Arnaud, 1996), which is included as part of the HEASOFT v6.28. In all models, a multiplicative constant model is included using the constant model to account for the differences in the flux calibration between instruments. This constant is fixed at 1.0 for NuSTAR/FPMA, and allowed to vary for NuSTAR/FPMB and HXMT/LE, ME, and HE, unless otherwise noted. We use the tbabs model (Wilms et al., 2000) to model the neutral Galactic absorption, with the abundances of Wilms et al. (2000) and the cross-sections of Verner et al. (1996) adopted. All parameter uncertainties are quoted at 90% confidence level for one parameter of interest.
3.1 Fitting spectra individually
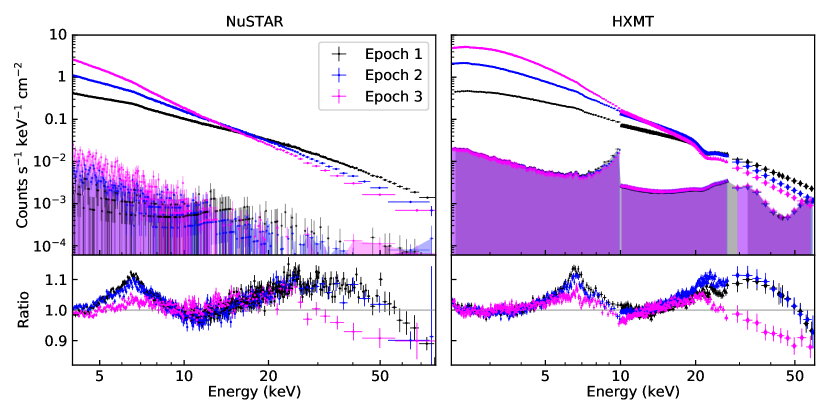
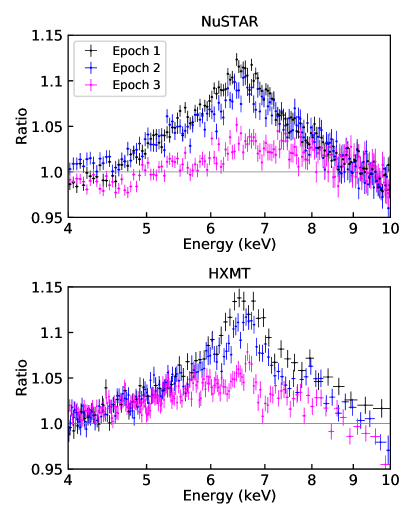
We initially jointly fitted the NuSTAR and HXMT data for each of the 3 epochs with an absorbed powerlaw model plus a multi-temperature thermal disc (diskbb) model (Mitsuda et al., 1984). There is no overlap in the coverage among the 3 instruments of HXMT. We therefore linked the 3 constant parameters together to prevent the degeneracy between the constant parameters for LE/ME/HE and the photon index of powerlaw. The remained parameters were linked for the NuSTAR and HXMT data. The iron line region between 4-8 keV and Compton hump region between 15-45 keV were ignored to avoid potential contribution to the powerlaw continuum. We note that the residual profiles in the high energy band for NuSTAR and HXMT are slightly different for Epoch 1. We find that this could be due to the change of the photon index of the the powerlaw continuum component between the NuSTAR and HXMT observations in Epoch 1. Indeed, the residuals for the NuSTAR and HXMT data are consistent if the photon index is fitted independently for the NuSTAR and HXMT data. Figure 2 shows the ratios of the data-to-model for 3 epochs. It is clear that significant reflection features are revealed in all of 3 epochs. The profile of the iron line appears to be relatively stable with its red wing extending below 5 keV over 3 epochs, indicating that the inner accretion disc may always be at the ISCO. On the other hand, the flux of the iron line decreases from Epoch 1 to 3 (Figure 3).
We then replaced the powerlaw model with a reflection model relxillCp (relxill v1.4.3, Dauser et al. 2014; García et al. 2014) to fit the relativistically blurred reflection component in the data. The relxillCp model also internally includes a continuum component which is calculated using the Comptonization model nthcomp (Zdziarski et al., 1996; Życki et al., 1999). A distance reflection component, which is generally believed to originate from the reflection of the outer accretion disc, is also added using the model xillverCp (García & Kallman, 2010). The total model is given by constant*tbabs(diskbb+relxillCp+xillverCp) in XSPEC. We fitted each epoch independently with this model.
In order to test the potential evolution of the inner radius of the disc over the rise phase of the outburst, we fixed the spin () of the black hole at its maximal value 0.998 (). While the inner radius () of the disc was free in the relxillCp model. The outer radius of the disc () was fixed at the default value 400 . We found that the best-fitting value of the iron abundance parameter was very close to the solar abundance in all the 3 epochs. We thus fixed at the solar abundance. The emissivity profile is described by a broken powerlaw in relxillCp, i.e., for and for . is the break radius, while and are the index for the inner and outer regions, respectively. Our data, however, cannot constrain all the 3 parameters simultaneously. We thus used a simple powerlaw to describe the emissivity profile by linking the value of to that of . All the other parameters (the inclination angle , the ionization state log, the electron temperature , and the normalization ) in the relxillCp are free parameters.
The parameters in the xillverCp component were linked to those of relxillCp except for the ionization () and the normalization () paramaters. We initially fixed the of the xillverCp component at zero. Compared with the best-fitting results shown in Table 3, the statistics were degraded by , 93.7, and 52.5 for 1 degree of freedom in Epoch 1, 2, and 3, respectively. The case that the distant reflection comes from ionized material is consistent with the previous studies (Xu et al., 2018; Sridhar et al., 2019), in which they reported that the ionization of the outer disc could be high (e.g. ) and may be different from the inner disc region. We then set of the xillverCp component independent of that () of relxillCp. The two values of are consistent within uncertainty for the Epoch 3, but they are quite distinct for the Epoch 1 and 2. Therefore, the two values of in the xillverCp and relxillCp were linked for Epoch 3, while they were fitted independently for Epoch 1 and 2. In addition, we find that unlinking photon index () of powerlaw between the NuSTAR and the HXMT data can greatly improve the fitting result for Epoch 1 with for one additional parameter. The values of photon index are constrained to be and , respectively. The minor difference between values of maybe attributed to the non-strictly simultaneous observation in Epoch 1.
This model can fit all the 3 epochs well, yielding reasonable statistics with = 4576.52/4273 = 1.07, 3296.6/3323 = 0.99 and 3317.74/2991 = 1.11 for the Epoch 1, 2 and 3, respectively. Table 3 presents the details of independent fitting of each epoch. The best-fitting emissivity profile is steep in each of the 3 epochs, i.e. for Epoch 1, for Epoch 2, and for Epoch 3. Xu et al. (2018) also used the same model to fit the NuSTAR data of Epoch 1. Our best-fitting results of Epoch 1 are consistent with their results, albeit they fixed at 3 with = . Assuming the Newtonian case (Shakura & Sunyaev, 1973; Novikov & Thorne, 1973; Reynolds & Begelman, 1997), i.e. was fixed at 3, we got much worse fits with = 97.67, 52.23, and 38,87 for Epoch 1, 2 and 3, respectively.
The inferred LOS hydrogen column density () varies from for Epoch 1 to for Epoch 2 and 3. These best-fitting LOS column densities are higher than that expected from Galactic absorption ( ), which may imply intrinsic absorption from the source. The variation of this excess absorption could attribute to the wind or the outer region of the disc. However, it can also be due to systematic uncertainty with the model, as such variation of the absorption is not typical in low-mass X-ray binaries. In addition, there is no evidence of the absorption lines detected in the X-ray spectra of MAXI J1535-571. To test whether a constant LOS absorption can fit the data, we performed a simultaneous fit to all the 3 epochs.
[b]
| Component | Parameter | M1 | M2 | |||||
| Epoch 1 | Epoch 2 | Epoch 3 | Epoch 1 | Epoch 2 | Epoch 3 | |||
| (LHS) | (HIMS) | (SIMS) | (LHS) | (HIMS) | (SIMS) | |||
| TBabs | ( cm-2) | 5.48 | 5.46 | |||||
| diskbb | (keV) | 0.3240.012 | 0.349 | 1.2 | 0.326 | 0.34 | 1.201 | |
| () | 167.49 | 225.27 | 1.91 | 54.71 | 265.76 | 1.92 | ||
| relxillCp | 9.13 | 8.73 | 9.5 | 7.49 | 8.68 | 9.72 | ||
| … | 0.985 | |||||||
| (degrees) | 72.8 | 70.7 | ||||||
| () | 1.38 | … | ||||||
| 1.822 | 2.401 | 2.795 | 1.819 | 2.4010.002 | 2.79 | |||
| log (erg cm s-1) | 3.24 | 3.110.06 | 3.3 | 3.25 | 3.13 | 3.3 | ||
| (keV) | 18.13 | 34.01 | 322.3 | 18.060.15 | 34.09 | 311.01 | ||
| 0.9 | 1.08 | 0.95 | 0.79 | 0.870.06 | 0.7 | |||
| () | 9.62 | 39.88 | 134.35 | 9.52 | 40.68 | 134.54 | ||
| 1.784 | … | … | 1.780.004 | … | … | |||
| xillverCp | log (erg cm s-1) | 2.53 | … | 2.80.04 | 3.58 | … | ||
| () | 1.54 | 6.58 | 16.0 | 1.94 | 6.23 | 17.47 | ||
| constant | 1.0220.001 | 1.0070.001 | 0.9970.001 | 1.0220.001 | 1.007 | 0.9970.001 | ||
| 0.7450.003 | 0.9550.002 | 0.9760.001 | 0.7460.002 | 0.955 | 0.9750.001 | |||
| 0.7410.003 | 0.960.002 | 0.9390.002 | 0.7410.002 | 0.960.002 | 0.940.002 | |||
| 0.7950.012 | 0.9720.015 | 0.9550.015 | 0.795 | 0.968 | 0.9470.015 | |||
| 11296.6 | 11356.31 | |||||||
| 10591 | 10593 | |||||||
| 1.07 | 1.07 | |||||||
-
•
Notes. The model constant*tbabs(diskbb+relxillCp+xillverCp) is used to fit in M1 and M2. In M1: the spin parameter is fixed at 0.998, the inner radius is free. In M2: is free and linked among 3 epochs, is fixed at -1, which means = . In the two models, the column density and inclination angle are linked among 3 epochs. The emissivity profile is assumed to be a single powerlaw, for which the emissivity index = = . The constant factor is fixed at unity for NuSTAR/FPMA, and free for NuSTAR/FPMB (), HXMT/LE (), ME (), and HE (). The other free parameters listed above: Temperature of the disc (); Inner radius of the disc (); Photon index ( and , which is only different for Epoch 1); Ionization state ( and for relxillcp and xillvercp, respectively, which is linked for Epoch 3); Electron temperature (); Reflection fraction (); Normalization constants of diskbb (), relxillcp () and xillvercp ().
3.2 Fitting spectra simultaneously
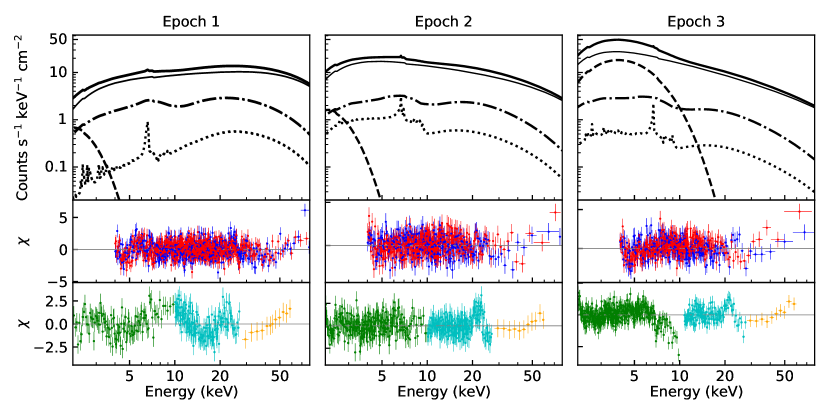
The LOS column density , inclination angle of the disc , Fe abundance , and the black hole spin were not supposed to vary among the 3 epochs, they were thus linked together. We again fixed at solar abundance and at the maximum 0.998. The was left as free parameter. The remaining parameters were fitted independently for each epoch, and were set up as stated in Section 3.1. We refer this model as M1. The model can fit the data well with = 11296.6/10591 = 1.07. The best-fitting parameters for M1 are presented in Table 2. The components of the model together with the residuals are shown in Figure 4. A positive feature between 21-23 keV in HXMT residuals (bottom panels of Figure 4), which is a known effect that is caused by the photoelectric effect of silver elements (You et al., 2021). Ignoring this energy range (only for the HXMT/ME instrument) does not affect the results. We also note that an excess at high energy tail is shown in the residuals in Epoch 1. Such excess may be attribute to the weaker disc component in the joint-fit, as it is not seen when fit the spectra individually (Section 3.1) of which we got a stronger disc component with also a slightly larger and higher column density. Since the column density is expected to not vary dramatically among these 3 epochs. We therefore mainly report on the results from the joint-fit to 3 epochs (M1).
The best-fitting is found to be ( . This high absorption is slightly larger than the result obtained from the Swift ( , Kennea et al. 2017) and NICER ( , Gendreau et al. 2017; Miller et al. 2018). It is noteworthy that fixing at a smaller value will significantly worsen the fit, e.g., for 1 degree of freedom if is fixed at .
The best-fitting photon index in Epoch 1 is ( for HXMT spectra). The best-fitting increases to and in Epoch 2 and 3, respectively. The temperature of the disc does not change significantly ( keV) in Epoch 1 and 2, while it becomes much higher ( keV) in Epoch 3. This trend is clearly illuminated in the top panel of Figure 4 where we showed the best-fitting model for each component. The relatively weak thermal components showed in Epoch 1 and 2 are comparable, while a prominent thermal component is clearly shown in Epoch 3 (dashed line in the upper panels). We find that a steep emissivity index is required for all the 3 epochs ( for Epoch 1, for Epoch 2, and for Epoch 3). The parameter , which represents the temperature of the electrons in the corona, is constrained to be keV for Epoch 1, keV for Epoch 2, and keV for Epoch 3. The reflection fraction is approximate unity in all 3 epochs, indicating that half of the powerlaw photons irradiate the disc. The constant factor is low for LE/ME/HE of HXMT in Epoch 1, which is because of non-simultaneity. In addition, the inner radius of the accretion disc is broadly consistent among the 3 epochs with only minor difference, i.e., for Epoch 1, for Epoch 2, and for Epoch 3. However, the best-fitting inclination angle, = degrees, is much higher than that measured from radio jet.
Our results suggests that the inner radius of the accretion disc does not change significantly which may indicate that it extends to the ISCO in all the three accretion states studied in this work. To self-consistently measure the spin of black hole, we then fixed the inner radius for all 3 epochs at ISCO () in the relxillcp model. The was allowed to be free, but linked together among 3 epochs. We refer this model as M2. Comparing to M1, M2 can equally fit all the data well with . We present the best-fitting parameters in Table 2. We obtained a precise measurement of the spin ( = ). The is slightly lower than that in M1. The values of other parameters are similar to those obtained with M1.
We also tried to fit the data with the lamp-post model relxilllpcp. In this scenario, the hard X-ray photons are produced in a point source above the black hole spin axis (Miniutti & Fabian, 2004). The height () of the corona, instead of , and in relxillcp, is used to describe the illumination of the disc. The lamp-post configuration with a low height of the corona have been successfully used to explain the steep emissivity profile found in several BHXRBs (Duro, Refiz et al., 2016; García et al., 2018). We jointly fit all the 3 epoch data together, allowing the height parameter () to be vary among the 3 epochs (the variant of M1). The other parameters set are as M1. This model provides a slightly worse fit to the data comparing with M1, with for the same degree of freedom. The can not be well constrained in the lamp-post configuration. The obtained for Epoch 1, 2 and 3 are < 4.61, < 13.94, and < 8.54 in units of , respectively. The are estimated to be , , and in units of for 3 epochs, respectively, which is not consistent with a compact corona close to the black hole. The inclination angle is 66-70 degrees.
The result presented in Steiner et al. (2017) emphasises the importance of the Compton scattering of the reflected photons by the hot coronal. To take this effect into account, we built a model in which the model simpl, a kernel to calculate the Compton scattering (Steiner et al., 2009), is used to convolve the thermal and reflected photons. In simpl, the free parameters are the scattered fraction and the . The represents the proportion of the seed photons being scattered. However, we find that the is poorly constrained. It doesn’t show any significant influence on the calculation of the relativistic reflection. So we opt for M1 instead.
4 Discussions
We have presented the detailed multi-epoch analysis of the reflection spectra of the black hole binary candidate MAXI J1535-571 over its rising phase of the outburst in 2017. The data were observed quasi-simultaneously by NuSTAR and HXMT when the source was in the LHS (Epoch 1), HIMS (Epoch 2), and SIMS (Epoch 3). We initially fitted the 3 epochs independently. We then performed joint modelling of the data for the 3 epochs. After subtracting the continuum (absorbed thermal emission plus power law component), prominent reflection features including the relativistic Fe K line and the Compton hump are detected in each of the 3 epochs. The Fe K line profile does not change significantly among the 3 epochs, while its flux decreases gradually from Epoch 1 to 3. In addition to the smeared reflection from the disc close to the black hole, the distant reflection, which maybe reflected from the ionized surface of the outer disc or the companion, was also observed. The relxillcp and xillvercp models were used in this work to fit the relativistic and distant reflection, respectively. We found that the hydrogen column density changes when fitted the 3 epochs independently, which may be induced by the systematic issues. Therefore, we also fitted the data from the 3 epochs simultaneously with the hydrogen column density assumed to be the same.
The inclination of the accretion disc measured by modeling the X-ray reflection spectra is high (70 degrees) in MAXI J1535-571. This is in agreement with the previous results by fitting NuSTAR, NICER, and AstroSat data in Xu et al. (2018), Miller et al. (2018), and Sridhar et al. (2019), respectively. The inclination we obtained is significantly larger than the jet inclination ( 45 degrees) which is measured by analyzing the radio data (Russell et al., 2019). We also tried to fit the data with the inclination fixed at smaller values, e.g., less than 45 degrees. However, this always resulted in an unacceptable fit. Our results imply that the rotation axis of the inner accretion disc seems to be misaligned with the radio jet. Additionally, the jet and binary orbital plane is potentially misaligned. Such discrepancy has been previously reported in other systems like Cyg X-1 (Tomsick et al., 2014; Parker et al., 2015; Walton et al., 2016) and MAXI J1820+070 (Poutanen et al., 2022).
The reflection-based measurements constrained the spin of the black hole in MAXI J1535-571 to be (Xu et al., 2018), (Miller et al., 2018), (Kong et al., 2020), and (Sridhar et al., 2019) by analysing data obtained between September 7 and 13. Because of the strong degeneracy between the spin and the inner radius, the intermediate spin measured in the HIMS by Sridhar et al. (2019) may indicate that the disc is moderately truncated before it extending down to the ISCO. In this work, we use the NuSTAR and HXMT data observed on September 7 (LHS), 12 (HIMS) and 21 (SIMS) to study the potential evolution of the disc inner radius in MAXI J1535-571. We find that the inner radius does not change significantly in the three epochs with . The lack of the disc truncation is inconsistent with the work by Sridhar et al. (2019), which may attribute to the high iron abundance assumed in their model. The phenomenon of the disc inner radius without receding or proceeding represents . The spin is estimated to be via letting free instead of , suggesting a rapidly rotating black hole in MAXI J1535-571, which is in agreement with Xu et al. (2018) and Miller et al. (2018).
Except the two key systematic parameters, i.e., the spin of the black hole and the inclination of the inner disc, were estimated, the properties of the thermal emission and the Comptonized component are also explored. The parameters related to them present good consistency between M1 and M2. We note that these two components are exhibiting evolution. Epoch 1 is obtained when the source is in the bright phase of the hard state, while Epoch 2 is obtained at the beginning of the hard-to-soft state. In epoch 3, of which the luminosity of the source is approaching the peak during the outburst, and the source stay in the soft intermediate state. From Figure 4, the flux is dominated by the powerlaw component in Epoch 1 and 2, while the powerlaw and thermal components are equivalently strong in Epoch 3.
The thermal emission observed above 2.1 keV is equally weak in Epoch 1 and 2, but becomes strong in Epoch 3. As listed in Table 2, the two best-fitting parameters, and ()333To distinguish from the inner radius shown in relxillcp model, we use to represent the inner radius indicated by diskbb., of model diskbb change significantly during the source transited from Epoch 2 to 3, which is in agreement with the results in Tao et al. (2018). It appears that the inner radius of the disc is slightly truncated in Epoch 1 and 2, which is inconsistent with the stable inner radius by modelling relativistic reflection components. Based on the results in Table 2, we calculated the unabsorbed disc flux (0.001-20 keV) for the 3 epochs, which are , , (in units of ergs cm-2 s-1), respectively. The flux does not show significant change from Epoch 2 to Epoch 3. This is inconsistent with the rise of the count rate shown in Figure 1, which indicates the increase of the accretion rate. The similar flux of the disc emission maybe led by the model without accounting for the Compotonization of the disc photons in corona. In the other hand, the effective temperature and the effective radius should be estimated after correcting the and by a hardening factor . Because the model diskbb does not account for any effects from the general relativity or electron scattering. A positive correlation between and accretion rate was reported in Davis & El-Abd (2019) and Done & Davis (2008). Therefore, the abrupt change in the and may be attributed from the change of accretion rate and hardening factor.
The photon index of in Epoch 1 is typical of the hard state. The spectrum softens as the state transition progresses, in Epoch 2 (2.40) and Epoch 3 (2.79). is used to describe the slope of the powerlaw, a component produced by inverse Compton scatter of the thermal emission in the corona. is related to the electron temperature () and optical depth () of the corona by formula (Zdziarski et al., 2020):
| (1) |
where is determined by , and , the rest mass of the electron, is equal to 511keV. The term is the average number of scattering, which is calculated as follows (Zdziarski et al., 2020) :
| (2) |
| (3) |
The corona temperature, however, is challenging to be determined by X-ray spectral analysis because of the low sensitivity of the detectors at high energies (> 10 keV), until the launch of the NuSTAR mission. Indeed, NuSTAR observations have provided opportunities to detect the in a large number of AGNs and X-ray binaries (Lohfink et al., 2015; Pahari et al., 2017; Lanzuisi et al., 2019; Yan et al., 2020). On the other hand, a better statistics can be achieved by adding HXMT observations in this work. The values of are constrained to be , , and keV for Epoch 1, 2, and 3 respectively. The unconstrained upper limit in Epoch 3 maybe caused by the extremely steep of the powerlaw and the signal to noise is not sufficient enough. The corona temperature change slightly from Epoch 1 to 2, but increases more than ten times in Epoch 3.
The increased represents that the spectrum is becoming softer. If it is the case discovered in the LHS, the softening can be explained by the movement of the inner disc towards the black hole or the inflowing corona with a moderately relativistic velocity Zdziarski et al. (1999). More soft photons emitted from the disc will go into the Comptonization region. This will increase the cooling effect of the population of electrons, then the of the corona decreases and the of the powerlaw increases. In this work, we found that the spectra become softer with steeper power index as the corona temperature increases during the LHS-HIMS-SIMS transition. This is inconsistent with this framework. Moreover, the inner radius has been stable at the ISCO during the 3 epochs. The behavior of the and is similar to the behavior in GX 339-4 (Motta et al., 2009) and GRO 1655-40 (Joinet et al., 2008).
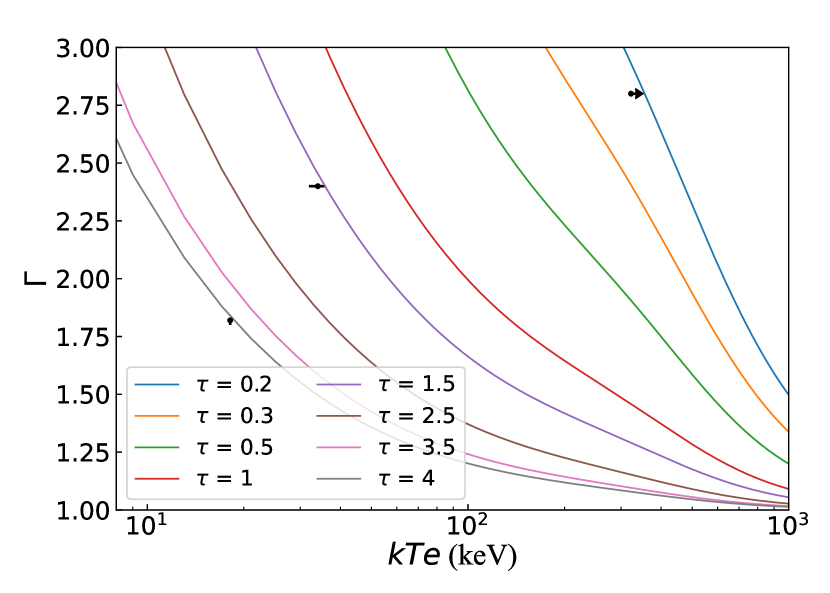
Following the above equations, we calculated plane assuming different values of (Figure 5). The optical depth experienced dramatic change. Its value decreased from (Epoch 1) to (Epoch 2), then to (Epoch 3). It seems that a dense low-temperature corona in the LHS evolves to a tenuous high-temperature corona after the state transition. The low optical depth of the corona in the SIMS may lead to inefficiency of the Compton scatterings in the corona, of which the cooling is substantially suppressed. Therefore, the corona temperature in Epoch 3 becomes much higher. The behaviour seems to imply that the state transition is accompanied by the coronal evolution. The detailed physical mechanism driving such evolution of the corona is beyond the scope of this work.
5 Conclusions
The black hole candidate MAXI J1535-571 was caught by NuSTAR and HXMT at three different states during its 2017 outburst: LHS, HIMS, and SIMS. The results of this work on the broad-band reflection spectra by jointly-fit to these three states found that the inner radius of the disc should be stable at the ISCO. The spin indicates a fast rotating black hole in the system. A high inclination angle of the disc is indicated. During the LHS-HIMS transition, the Comptonized component becomes soft, the electron temperature increases slightly, and the thermal component from the disc is relatively comparable. Across the HIMS-SIMS transition, the Comptonized component continues to be soft, the electron temperature shows an abrupt increase, and the thermal component also contributes significantly. We calculated the - panel giving a range value 0.2-4 of the optical depth of the corona. The best-fitting results of and imply that the varies from 4 to 1.5, and to 0.2 over the state transitions. It is clear that the properties of the corona has changed. The corona evolves from dense low-temperature in the LHS to tenuous high-temperature after the state transition, which seems to imply that the physical properties of the corona has changed during the state transition.
Acknowledgements
The authors thank the referee for the helpful comments to improve our manuscript. This work is supported by the NSFC (11773050, 11833007, 12073023), the science research grants from the China Manned Space Project with NO. CMS-CSST-2021-A06. This work made use of data from the NuSTAR mission, a project led by the California Institute of Technology, managed by the Jet Propulsion Laboratory, and funded by the National Aeronautics and Space Administration. This work also made use of the data from the Insight-HXMT mission, a project funded by China National Space Administration (CNSA) and the Chinese Academy of Sciences (CAS).
Data availability
Data used in this article are publicly available from the NuSTAR mission (https://heasarc.gsfc.nasa.gov/docs/archive.html) and HXMT mission (http://hxmten.ihep.ac.cn).
References
- Arnaud (1996) Arnaud K. A., 1996, in Jacoby G. H., Barnes J., eds, Astronomical Society of the Pacific Conference Series Vol. 101, Astronomical Data Analysis Software and Systems V. p. 17
- Bardeen et al. (1972) Bardeen J. M., Press W. H., Teukolsky S. A., 1972, ApJ, 178, 347
- Belloni (2010) Belloni T. M., 2010, States and Transitions in Black Hole Binaries. p. 53, doi:10.1007/978-3-540-76937-8_3
- Belloni et al. (2005) Belloni T., Homan J., Casella P., van der Klis M., Nespoli E., Lewin W. H. G., Miller J. M., Méndez M., 2005, A&A, 440, 207
- Buisson et al. (2019) Buisson D. J. K., et al., 2019, MNRAS, 490, 1350
- Chauhan et al. (2019) Chauhan J., et al., 2019, MNRAS, 488, L129
- Cúneo et al. (2020) Cúneo V. A., et al., 2020, MNRAS, 496, 1001
- Dauser et al. (2014) Dauser T., García J., Parker M. L., Fabian A. C., Wilms J., 2014, MNRAS, 444, L100
- Davis & El-Abd (2019) Davis S. W., El-Abd S., 2019, ApJ, 874, 23
- Dinçer (2017) Dinçer T., 2017, The Astronomer’s Telegram, 10716, 1
- Done & Davis (2008) Done C., Davis S. W., 2008, ApJ, 683, 389
- Dong et al. (2020a) Dong Y., García J. A., Liu Z., Zhao X., Zheng X., Gou L., 2020a, MNRAS, 493, 2178
- Dong et al. (2020b) Dong Y., García J. A., Steiner J. F., Gou L., 2020b, MNRAS, 493, 4409
- Duro, Refiz et al. (2016) Duro, Refiz et al., 2016, A&A, 589, A14
- Esin et al. (1997) Esin A. A., McClintock J. E., Narayan R., 1997, ApJ, 489, 865
- Esin et al. (2001) Esin A. A., McClintock J. E., Drake J. J., Garcia M. R., Haswell C. A., Hynes R. I., Muno M. P., 2001, ApJ, 555, 483
- Ezhikode et al. (2020) Ezhikode S. H., Dewangan G. C., Misra R., Philip N. S., 2020, MNRAS, 495, 3373
- Fabian et al. (1989) Fabian A. C., Rees M. J., Stella L., White N. E., 1989, MNRAS, 238, 729
- Feng et al. (2022) Feng Y., et al., 2022, Science China Physics, Mechanics, and Astronomy, 65, 219512
- García & Kallman (2010) García J., Kallman T. R., 2010, ApJ, 718, 695
- García et al. (2014) García J., et al., 2014, ApJ, 782, 76
- García et al. (2015) García J. A., Steiner J. F., McClintock J. E., Remillard R. A., Grinberg V., Dauser T., 2015, ApJ, 813, 84
- García et al. (2018) García J. A., et al., 2018, ApJ, 864, 25
- Gendreau et al. (2017) Gendreau K., et al., 2017, The Astronomer’s Telegram, 10768, 1
- Guan et al. (2021) Guan J., et al., 2021, MNRAS, 504, 2168
- Harrison et al. (2013) Harrison F. A., et al., 2013, ApJ, 770, 103
- Huang et al. (2018) Huang Y., et al., 2018, ApJ, 866, 122
- Joinet et al. (2008) Joinet A., Kalemci E., Senziani F., 2008, ApJ, 679, 655
- Kennea et al. (2017) Kennea J. A., Evans P. A., Beardmore A. P., Krimm H. A., Romano P., Yamaoka K., Serino M., Negoro H., 2017, The Astronomer’s Telegram, 10700, 1
- Kong et al. (2020) Kong L. D., et al., 2020, Journal of High Energy Astrophysics, 25, 29
- Lanzuisi et al. (2019) Lanzuisi G., et al., 2019, ApJ, 875, L20
- Laor (1991) Laor A., 1991, ApJ, 376, 90
- Liu et al. (2002) Liu B. F., Mineshige S., Meyer F., Meyer-Hofmeister E., Kawaguchi T., 2002, ApJ, 575, 117
- Lohfink et al. (2015) Lohfink A. M., et al., 2015, ApJ, 814, 24
- Matsuoka et al. (2009) Matsuoka M., et al., 2009, Publications of the Astronomical Society of Japan, 61, 999
- Meyer et al. (2000) Meyer F., Liu B. F., Meyer-Hofmeister E., 2000, A&A, 361, 175
- Miller et al. (2018) Miller J. M., et al., 2018, ApJ, 860, L28
- Miniutti & Fabian (2004) Miniutti G., Fabian A. C., 2004, MNRAS, 349, 1435
- Mitsuda et al. (1984) Mitsuda K., et al., 1984, PASJ, 36, 741
- Motta et al. (2009) Motta S., Belloni T., Homan J., 2009, MNRAS, 400, 1603
- Nakahira et al. (2017) Nakahira S., et al., 2017, The Astronomer’s Telegram, 10729, 1
- Negoro et al. (2017a) Negoro H., et al., 2017a, The Astronomer’s Telegram, 10699, 1
- Negoro et al. (2017b) Negoro H., et al., 2017b, The Astronomer’s Telegram, 10708, 1
- Novikov & Thorne (1973) Novikov I. D., Thorne K. S., 1973, in Dewitt C., Dewitt B. S., eds, Black Holes (Les Astres Occlus). pp 343–450
- Pahari et al. (2017) Pahari M., McHardy I. M., Mallick L., Dewangan G. C., Misra R., 2017, MNRAS, 470, 3239
- Panagiotou & Walter (2020) Panagiotou C., Walter R., 2020, A&A, 640, A31
- Parker et al. (2015) Parker M. L., et al., 2015, ApJ, 808, 9
- Plant et al. (2014) Plant D. S., Fender R. P., Ponti G., Muñoz-Darias T., Coriat M., 2014, MNRAS, 442, 1767
- Poutanen et al. (2022) Poutanen J., et al., 2022, Science, 375, 874
- Qiao & Liu (2010) Qiao E., Liu B. F., 2010, PASJ, 62, 661
- Reis et al. (2010) Reis R. C., Fabian A. C., Miller J. M., 2010, MNRAS, 402, 836
- Remillard & McClintock (2006) Remillard R. A., McClintock J. E., 2006, ARA&A, 44, 49
- Reynolds & Begelman (1997) Reynolds C. S., Begelman M. C., 1997, ApJ, 488, 109
- Russell et al. (2017) Russell T. D., Miller-Jones J. C. A., Sivakoff G. R., Tetarenko A. J., Jacpot Xrb Collaboration 2017, The Astronomer’s Telegram, 10711, 1
- Russell et al. (2019) Russell T. D., et al., 2019, ApJ, 883, 198
- Russell et al. (2020) Russell T. D., et al., 2020, MNRAS, 498, 5772
- Scaringi & ASTR211 Students (2017) Scaringi S., ASTR211 Students 2017, The Astronomer’s Telegram, 10702, 1
- Shakura & Sunyaev (1973) Shakura N. I., Sunyaev R. A., 1973, A&A, 24, 337
- Shidatsu et al. (2017) Shidatsu M., et al., 2017, The Astronomer’s Telegram, 11020, 1
- Sreehari et al. (2019) Sreehari H., Ravishankar B. T., Iyer N., Agrawal V. K., Katoch T. B., Mandal S., Nandi A., 2019, MNRAS, 487, 928
- Sridhar et al. (2019) Sridhar N., Bhattacharyya S., Chandra S., Antia H. M., 2019, MNRAS, 487, 4221
- Sridhar et al. (2020) Sridhar N., García J. A., Steiner J. F., Connors R. M. T., Grinberg V., Harrison F. A., 2020, ApJ, 890, 53
- Steiner et al. (2009) Steiner J. F., Narayan R., McClintock J. E., Ebisawa K., 2009, PASP, 121, 1279
- Steiner et al. (2010) Steiner J. F., McClintock J. E., Remillard R. A., Gou L., Yamada S., Narayan R., 2010, ApJ, 718, L117
- Steiner et al. (2017) Steiner J. F., García J. A., Eikmann W., McClintock J. E., Brenneman L. W., Dauser T., Fabian A. C., 2017, ApJ, 836, 119
- Stevens et al. (2018) Stevens A. L., et al., 2018, ApJ, 865, L15
- Stiele & Kong (2018) Stiele H., Kong A. K. H., 2018, ApJ, 868, 71
- Tanaka & Lewin (1995) Tanaka Y., Lewin W. H. G., 1995, in X-ray Binaries. pp 126–174
- Tao et al. (2018) Tao L., et al., 2018, MNRAS, 480, 4443
- Tomsick et al. (2014) Tomsick J. A., et al., 2014, ApJ, 780, 78
- Verner et al. (1996) Verner D. A., Ferland G. J., Korista K. T., Yakovlev D. G., 1996, ApJ, 465, 487
- Walton et al. (2016) Walton D. J., et al., 2016, ApJ, 826, 87
- Wilms et al. (2000) Wilms J., Allen A., McCray R., 2000, ApJ, 542, 914
- Xu et al. (2018) Xu Y., et al., 2018, ApJ, 852, L34
- Xu et al. (2020) Xu Y., Harrison F. A., Tomsick J. A., Walton D. J., Barret D., García J. A., Hare J., Parker M. L., 2020, ApJ, 893, 30
- Yan et al. (2020) Yan Z., Xie F.-G., Zhang W., 2020, ApJ, 889, L18
- You et al. (2021) You B., et al., 2021, Nature Communications, 12, 1025
- Zdziarski et al. (1996) Zdziarski A. A., Johnson W. N., Magdziarz P., 1996, MNRAS, 283, 193
- Zdziarski et al. (1999) Zdziarski A. A., Lubiński P., Smith D. A., 1999, MNRAS, 303, L11
- Zdziarski et al. (2020) Zdziarski A. A., Szanecki M., Poutanen J., Gierliński M., Biernacki P., 2020, MNRAS, 492, 5234
- Zhang et al. (2014) Zhang S., Lu F. J., Zhang S. N., Li T. P., 2014, in Takahashi T., den Herder J.-W. A., Bautz M., eds, Society of Photo-Optical Instrumentation Engineers (SPIE) Conference Series Vol. 9144, Space Telescopes and Instrumentation 2014: Ultraviolet to Gamma Ray. p. 914421, doi:10.1117/12.2054144
- Zhao et al. (2020) Zhao X.-S., et al., 2020, Journal of High Energy Astrophysics, 27, 53
- Zhao et al. (2021) Zhao X., et al., 2021, ApJ, 916, 108
- Życki et al. (1999) Życki P. T., Done C., Smith D. A., 1999, MNRAS, 309, 561
Appendix A Results for individual fits to 3 epochs
| Component | Parameter | Epoch 1 | Epoch 2 | Epoch 3 |
|---|---|---|---|---|
| (LHS) | (HIMS) | (SIMS) | ||
| TBabs | ( cm-2) | 6.95 | 5.5 | 5.33 |
| diskbb | (keV) | 0.3490.009 | 0.349 | 1.215 |
| () | 213.88 | 230.98 | 1.850.04 | |
| relxillCp | 9.81 | 7.33 | 7.22 | |
| (degrees) | 77.8 | 69.69 | 68.88 | |
| () | 1.35 | 1.440.06 | ||
| 1.927 | 2.4 | 2.777 | ||
| log (erg cm s-1) | 2.8 | 3.11 | 3.32 | |
| (keV) | 25.2 | 34.12 | 277.43 | |
| 1.97 | 0.890.21 | 1.14 | ||
| () | 10.830.16 | 40.04 | 122.11 | |
| 1.886 | … | … | ||
| xillverCp | log (erg cm s-1) | 2.27 | 3.68 | … |
| () | 1.15 | 6.87 | 11.88 | |
| constant | 1.0220.001 | 1.007 | 0.9970.001 | |
| 0.7360.002 | 0.9550.002 | 0.9760.001 | ||
| 0.731 | 0.960.002 | 0.9360.002 | ||
| 0.783 | 0.970.015 | 0.948 | ||
| 4576.52 | 3296.6 | 3317.74 | ||
| 4273 | 3323 | 2991 | ||
| 1.07 | 0.99 | 1.11 |
-
•
Notes. Fitting 3 epochs individually with the model constant*tbabs(diskbb+relxillCp+xillverCp). The spin parameter is fixed at 0.998. The inner radius is free. The emissivity profile is assumed to be a single powerlaw, for which the emissivity index = = . The constant factor is fixed at unity for NuSTAR/FPMA, and free for NuSTAR/FPMB (), HXMT/LE (), ME (), and HE (). The other free parameters listed above: Temperature of the disc (); Inner radius of the disc (); Photon index ( for and , which is only different for Epoch 1); Ionization state ( and for relxillcp and xillvercp, respectively, which is linked for Epoch 3); Electron temperature (); Reflection fraction (); Normalization constants of diskbb (), relxillcp () and xillvercp ().