Energy Efficiency of Web Browsers in the Android Ecosystem
Abstract
This paper presents an empirical study regarding the energy consumption of the most used web browsers on the Android ecosystem. In order to properly compare the web browsers in terms of energy consumption, we defined a set of typical usage scenarios to be replicated in the different browsers, executed in the same testing environment and conditions. The results of our study show that there are significant differences in terms of energy consumption among the considered browsers. Furthermore, we conclude that some browsers are energy efficient in several user actions, but energy greedy in other ones, allowing us to conclude that no browser is universally more efficient for all usage scenarios.
Index Terms:
Energy Efficiency, Web Browsers, Green Software, AndroidI Introduction
The use of non-wired, portable devices is changing our lives. Everyday tasks, such as reading a newspaper, socializing with friends, listening to music/videos, or the search for information are now easily performed via an always present mobile phone. Most of those tasks rely on the internet, and web browsers are one of the most important and used tools to access the web [1, 2, 3, 4]. The widely use of mobile devices are also changing the way software engineers develop their programs: while in the last century runtime performance was the main goal, in our mobile-device age energy consumption is a new concern for application software developers [5]. Being a web browser one of the most used software applications it is no surprise the large number of available browsers (currently there are more than only for Android). In a mobile ecosystem, where energy consumption is of concern to the user, it is very relevant to understand which browser is the most energy-efficient. In fact, depending on the type of the task being performed, the browser choice may vary.
In this paper, we present our empirical procedure and preliminary study on five of the most popular/used web browsers available in the Android ecosystem. Our execution procedure uses Qualcomm’s Trepn Profiler [6], which is suited for Android devices that use Snapdragon chipsets and uses RERAN [7] in order to define simulation scripts that aim to emulate real-user interaction with a physical Android device and browser under test. For each browser, we developed several scripts with RERAN that aim to emulate three different usage scenarios: i) video streaming (on YouTube111www.youtube.com and Vimeo222www.vimeo.com), ii) search engine usage and iii) social media interaction. By designing this empirical procedure and executing it on a real, physical device, while monitoring its energy consumption, we intend to answer the following research questions:
-
•
RQ1: Which mobile browser is the most energy-efficient for browsing YouTube? According to Statista [8], YouTube is the most popular online video platform. Understanding which browser is the most energy-efficient can help heavily reduce the energy consumed during this typical web browsing.
-
•
RQ2: Which mobile browser is the most energy-efficient for browsing Vimeo? Vimeo is an alternative to YouTube which has been gaining popularity, with 7.9 million downloads of the mobile application in 2021 alone [9], by providing identical features with a more pleasant user experience.
-
•
RQ3: Which mobile browser is the most energy-efficient for performing searches in search engines? Providing access to search engines is one of the main reasons to use a web browser. For this scenario, we designed usage scenarios for performing keyword searching on Google.
-
•
RQ4: Which mobile browser is the most energy-efficient for browsing Facebook? Social networks are among the most used applications and websites on all platforms, with Facebook being the most widely used [10]. Discovering which mobile browser is the most battery-friendly can help reduce energy consumption and can advise users to choose an energy-efficient browser.
-
•
RQ5: Which mobile browser is the most energy-efficient overall? While there may be browsers more suited to perform specific tasks, understanding overall which is the most energy-efficient one, can further help users select the most adequate browser for a uniformly more energy-friendly experience.
To answer these questions we present an empirical study on the energy efficiency of the most popular browsers available for Android. The results of our study show interesting findings, such as there is no overall winner in all user action scenarios considered. In fact, some browsers are very energy efficient in some usage scenarios, but energy greedy in other ones.
This remainder of this paper is organized as follows. In Section II we present the related work, followed by Section III, which details the methodology followed to select the corpus of web browsers, as well as the process to execute them with realistic user actions and to estimate its energy consumption. Section IV contains the analysis and discussion of our preliminary results. In Section V, we present the threats to the validity of our work and finally we present our conclusions (Section VI).
II Related Work
Studies aiming to compare the performance of widely used pieces of software have been increasingly appearing in the scientific community [11, 12, 13, 14, 15]. Web browsers are not an exception, despite the majority of the efforts being focused on their runtime performance [12, 13, 14]. Nevertheless, in terms of the energy efficiency of browsers, there are also some studies analyzing the energy consumption of different tasks within the same browser.
In [16] an infrastructure is presented to measure the precise energy consumption used by a mobile browser to load and render websites as well as the energy needed to render individual web elements, such as cascade style sheets (CSS), JavaScript, images, and plug-in objects. This was performed in different types of areas like finance, e-commerce, email, blogging, news, and social networking sites, at popular websites such as Gmail, Amazon, and many others. This study shows that downloading and parsing cascade style sheets and JavaScript consume a significant portion of the total energy required to render a page for popular sites, and rendering JPEG images are considerably cheaper than the other formats. It was also possible to provide concrete recommendations on how to design web pages without affecting the user experience to reduce the amount of energy needed to render the page. Thus, the goal of this work is different from ours since we evaluate several categories of everyday tasks.
Hsu et al. [17] studied how page loading can affect the the energy efficiency of three widely used Android web browsers, namely Chrome, Firefox, and Opera. The paper compares the page loading of 150 random websites considering two different internet frequencies, with the purpose of verifying whether there is a greener page loading browser. Although this paper shares our goal of comparing web browsers, it only focus on loading websites and not exploiting their regular use.
A recent approach [18] developed a simple command-line tool, PowDroid, to measure the energy consumed by any application running without requiring access to the source code. It can be used to perform benchmarks and analyze which components are draining more battery. Three test scenarios were made to prove its efficiency: web browser, camera, and weather applications. The web browsers Firefox, Chrome, Edge, Opera, Samsung Browser, and Brave were tested and the test consisted of searching for a keyword and opening three websites. Each test took 4 minutes, with the battery level at 50% at the beginning, screen brightness at 50%, and audio at 50%. Their experiments found that Brave is the most energy-efficient, while Firefox was the worst with a 33,8% increase in energy consumption. The authors justify these results due to the default built-in ad-blocker in Brave. Our results also show Brave as one of the greenest browsers, however, there are user tasks such as playing YouTube videos where it has poor energy efficiency.
We have conducted a preliminary study comparing the energy performance of desktop-based browsers, where we considered Chrome and Firefox [19]. In that study, we used RAPL [20, 21] to monitor the energy consumption during the execution of each script under the same specific test conditions. These scripts were generated with Selenium [22], where multiple actions were performed to force browsers to simulate user actions, such as watching videos, scrolling down, etc. This research was a test-bed and preliminary study to serve with advancements and inspiration to explore this further, observing the results obtained.
III Methodology
The astonishing adoption of smartphones leads to the increasing use of mobile apps, including mobile browsers. When selecting their browser, users consider many factors, such as speed, features, resource management, themes, compatibility, etc. Due to the lack of information, users do not currently consider the energy efficiency of the browsers. While many might assume speed directly equates to energy efficiency, several research works are showing this is, in fact, not always direct [23, 24, 25].
This section describes the design of our benchmark to assess the energy efficiency of web browsers. We start by specifying the methodology followed to select the browsers considered in our empirical setup. Next, we define the techniques and tools used to simulate real user interactions in the selected browsers. Finally, we detail how we executed and measured the energy consumption of the actions performed over each web browser.
III-A Browser Selection
Nowadays, there are more than mobile browsers. Considering all the corpus of available browsers in our empirical setup would be extremely time-consuming, since we intended to simulate real user interaction, by manually performing real user inputs, recording them and replicating them with automatic procedures. Furthermore, we needed to gather a limited set of web browsers, containing browsers with significant and representative usage by Android users, by defining specific selection criteria.
The first selection criteria consisted in considering the top 5 most downloaded web browsers for mobile devices [26]. In our reference list, Safari was the second browser most used worldwide, but it was excluded from our corpus since it is not available for Android devices. Furthermore, we considered Google Chrome, Samsung Explorer, UC Browser, Opera Mini, and Mozilla Firefox. Information regarding the number of downloads of each selected browser can be found in Table I.
| Browsers | Number of Downloads |
|---|---|
| Chrome | 5mM+ |
| Samsung Explorer | 1mM+ |
| UC Browser | 500M+ |
| Opera Mini | 500M+ |
| Mozilla | 100M+ |
Besides considering the 5 most downloaded web browsers, we also intended to select 2 more browsers with significant usage that could compete with the widely used browsers already considered. After a manual inspection of the list of the top 10 web browsers with the most downloads in the Google Play Store, we selected 2 more browsers, Brave and DuckDuck, due to having interesting features and descriptions on their page. Brave states to offer a factor of 2 to 4 of speed boost on Android, saving data and battery. They also claim that its users can count up to 2.5 extra hours of browsing time per battery charge. DuckDuck was selected because it claims it provides an additional level of security and privacy. Furthermore, we wanted to discover if providing such features imply an energy overhead.
III-B Execution Procedure
Our study intends to simulate real-user interaction with a browser, using an automatic execution approach. Obtaining actual usage data from users might raise privacy issues that make such an approach avoidable. Replicating the interaction process manually enough times to obtain reliable estimates of energy consumption and reduce the impact of external interference in the monitoring process is also a time-consuming and cumbersome task. Additionally, performing interactions that perform all sorts of tasks possible in a web browser is impossible. Consequently, the RERAN [7] tool was used to record a set of actions that intend to represent the execution of some tasks typically performed in web browsers.
RERAN is a record-and-replay tool that allows to record inputs made on the screen of a device (such as touches, gestures) or other input devices and replicate them with or without delay on a device with the same screen dimensions. In this way, we used this tool to manually record the interactions that intend to simulate real-user interaction in each browser and be able to replicate them several times. Although each recorded test is specific for each browser (i.e. a test was defined for each browser), the steps in each test are equivalent. Also, we performed some of the tests several times in order to assure that the tests have negligible differences in terms of runtime and assure that the comparisons to be made are fair.
In order to answer RQ1, three similar scripts were developed. These scripts emulate the process of browsing www.youtube.com, searching for one specific video by typing in the search bar and playing it in 720p. The videos chosen were the video-clip Despacito from Luis Fonsi, the short cartoon Masha and the Bear-Recipe for Disaster from Get Movies and a video-clip of Paradise, from Coldplay. The first two videos have been selected from the list of most viewed videos on Youtube [27], while the latter was randomly selected from a list of music videos. This process was not recorded on Opera Mini and DuckDuck browsers because they did not allow the video to be displayed on full screen, leaving two black bars on the screen. Since this did not happen for other browsers and it could influence the results, we decided to not include these two browsers in this experiment.
The strategy to answer RQ2 was similar to the one followed for answering RQ1, but only the video Paradise was the same. The other videos were A Mind Sang and Shadows In The Sky, and they were chosen randomly. Contrary to what happened with Youtube, where two browsers did not allow putting the video on full screen, on Vimeo, only Firefox and UC allow putting it on full screen. Therefore, these two browsers were not considered in this evaluation.
The strategy used to answer RQ3 consisted of three scripts. They consist of browsing to www.google.com and using the search bar to research two questions and one recipe. One of the scripts consists in searching the question “who was the first man on the moon” and then clicking on the NASA website [28], staying on this website for 30 seconds. Afterward, it returns to Google and clicks on the next result (Apolo 11 on Wikipedia [29]), staying on such a website for 60 seconds (30 seconds on the main text, and scrolling down through details for another 30 seconds). The second script searches for “world war two” and clicks on the first entry, pointing to the Wikipedia website [30]. Afterward, it waits 30 seconds while the first paragraph is on the screen, scrolling down the following text for 50 seconds. The last developed script searches “recipes with chicken” on www.google.com and proceeds to the Delish website [31]. Then, it selects the second recipe and simulates the process of reading ingredients and the five steps for the recipe, spending 20 seconds on each. Afterwards, it scrolls up to watch the recipe video and plays the video until the end. This script was replicated for all browsers except DuckDuck, due to its privacy policy, which always erases the browser history and cookies. For that reason, it did not allow the development of a script with the RERAN tool because it was impossible to guarantee that the clicks were in the same place throughout the different executions.
To answer RQ4, the script starts to browse www.facebook.com where an account was already logged in. Afterwards, the search bar was used to search for “Jornal de Noticías” [32] (a Portuguese newspaper) by clicking on history search. After that, it follows to the photos section, where 15 photos of the front page of a newspaper are loaded one by one. It goes back to the landing page of “Jornal de Notícias” and scrolls down through the feed where news is posted. After that, it goes to the account’s saved content, where a video is selected and played for 60 seconds. This test was not conducted on Opera Mini and DuckDuck browsers for the same reason stated when describing the RQ1 strategy.
Finally, by combining all the results obtained with the procedures designed to answer the first 4 research questions, we answer RQ5.
III-C Script Execution and Energy Measurement
In order to profile the execution procedure to estimate energy consumption, we used Trepn Profiler [6]. This profiler has been used in several research efforts [33, 11] to obtain energy measurements, providing accurate results in physical devices with Snapdragon chipsets, since it extracts power measurements from its PMIC (Power Management Integrated Circuit). Trepn can be used to profile hardware and resource usage, as well as to obtain power consumption at the system or application level, with a sampling rate of 100 milliseconds.
Different precautions were taken to have consistent data and minimize external interferences to the monitoring process. All measurements were performed in the same LG Nexus 5 device running Android 6.0.1, for which Trepn Profiler is known to retrieve accurate values. The brightness level was set to the minimum, and all applications were turned off, only with Trepn service running in the background. We also performed efforts to reduce effects from cold starts, warm-ups, and cache effects. Every script was executed five times, and the script from Facebook was performed in the middle of the night to ensure that no news was added and the feed was the same for every browser.
IV Results and Analysis
This section presents and analyzes the results obtained through our execution procedure replicated for each of the considered browsers. Furthermore, in this section, we use statistical methods and graphical information to describe and analyze the results obtained by combining our executing scripts with Trepn Profiler.
IV-A Results
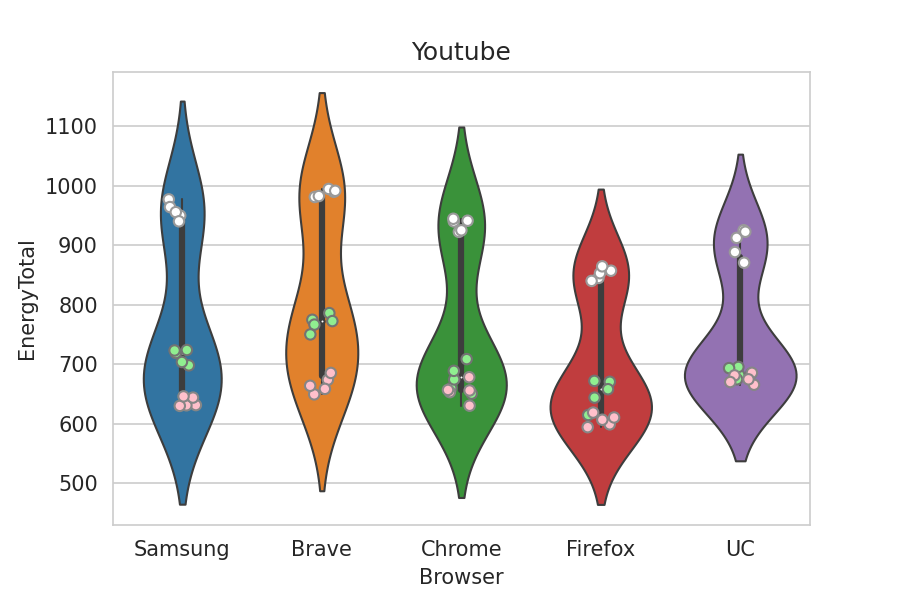
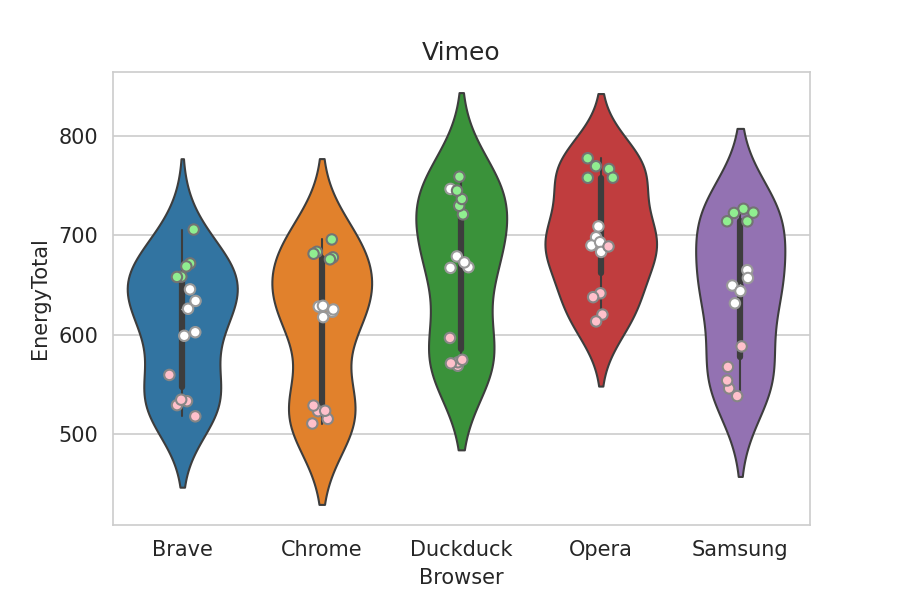
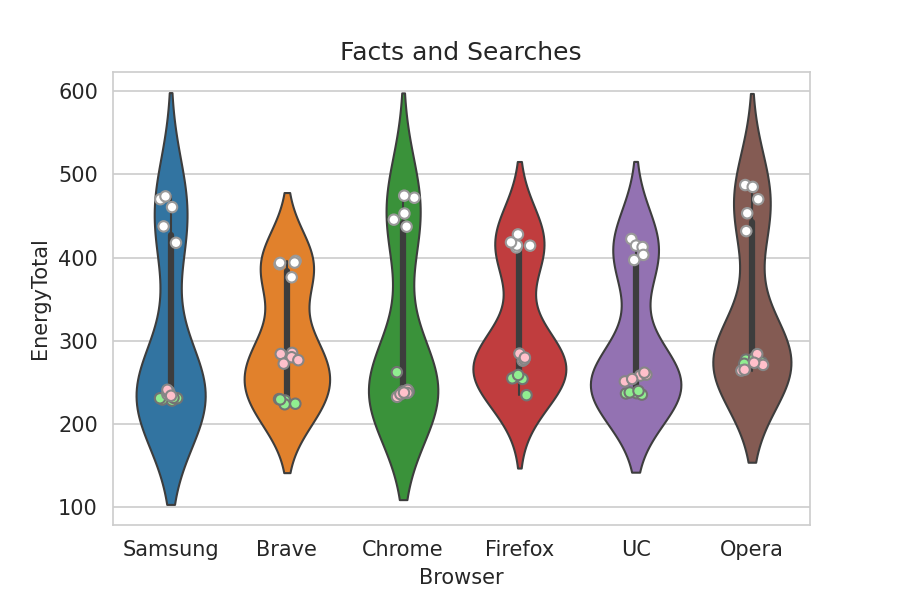
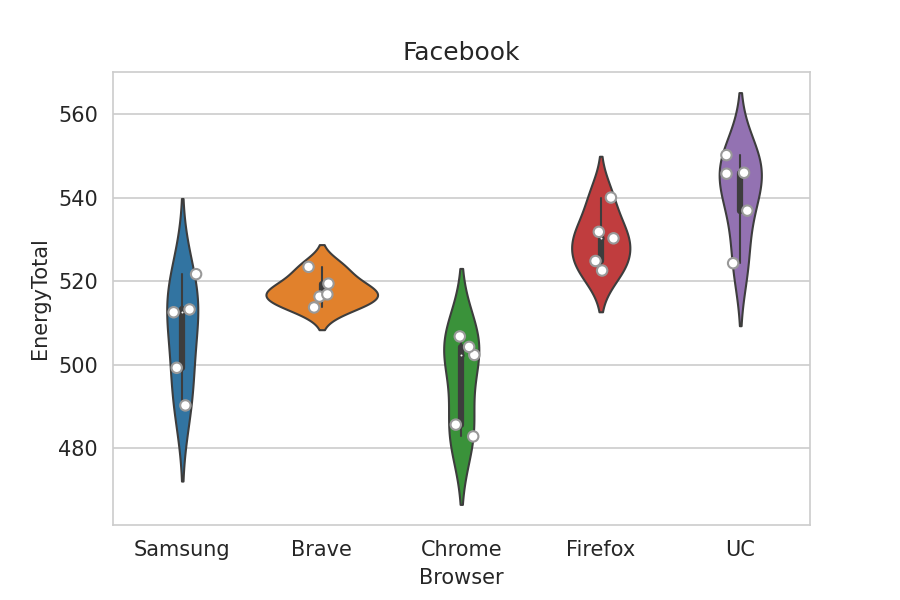
To better understand the results obtained by our tests, we display the obtained results in different graphical formats, that present the energy consumed by browsers. Figure 1 shows the total energy consumption in Joules of each browser, for each scenario considered. Each browser has one bar representing the average of the energy values obtained when executing 5 times each of the 3 developed scripts for each task. We can also observe a black horizontal line in each of the plots presented in Figure 1, which represents the elapsed time of the script’s execution in each test scenario.
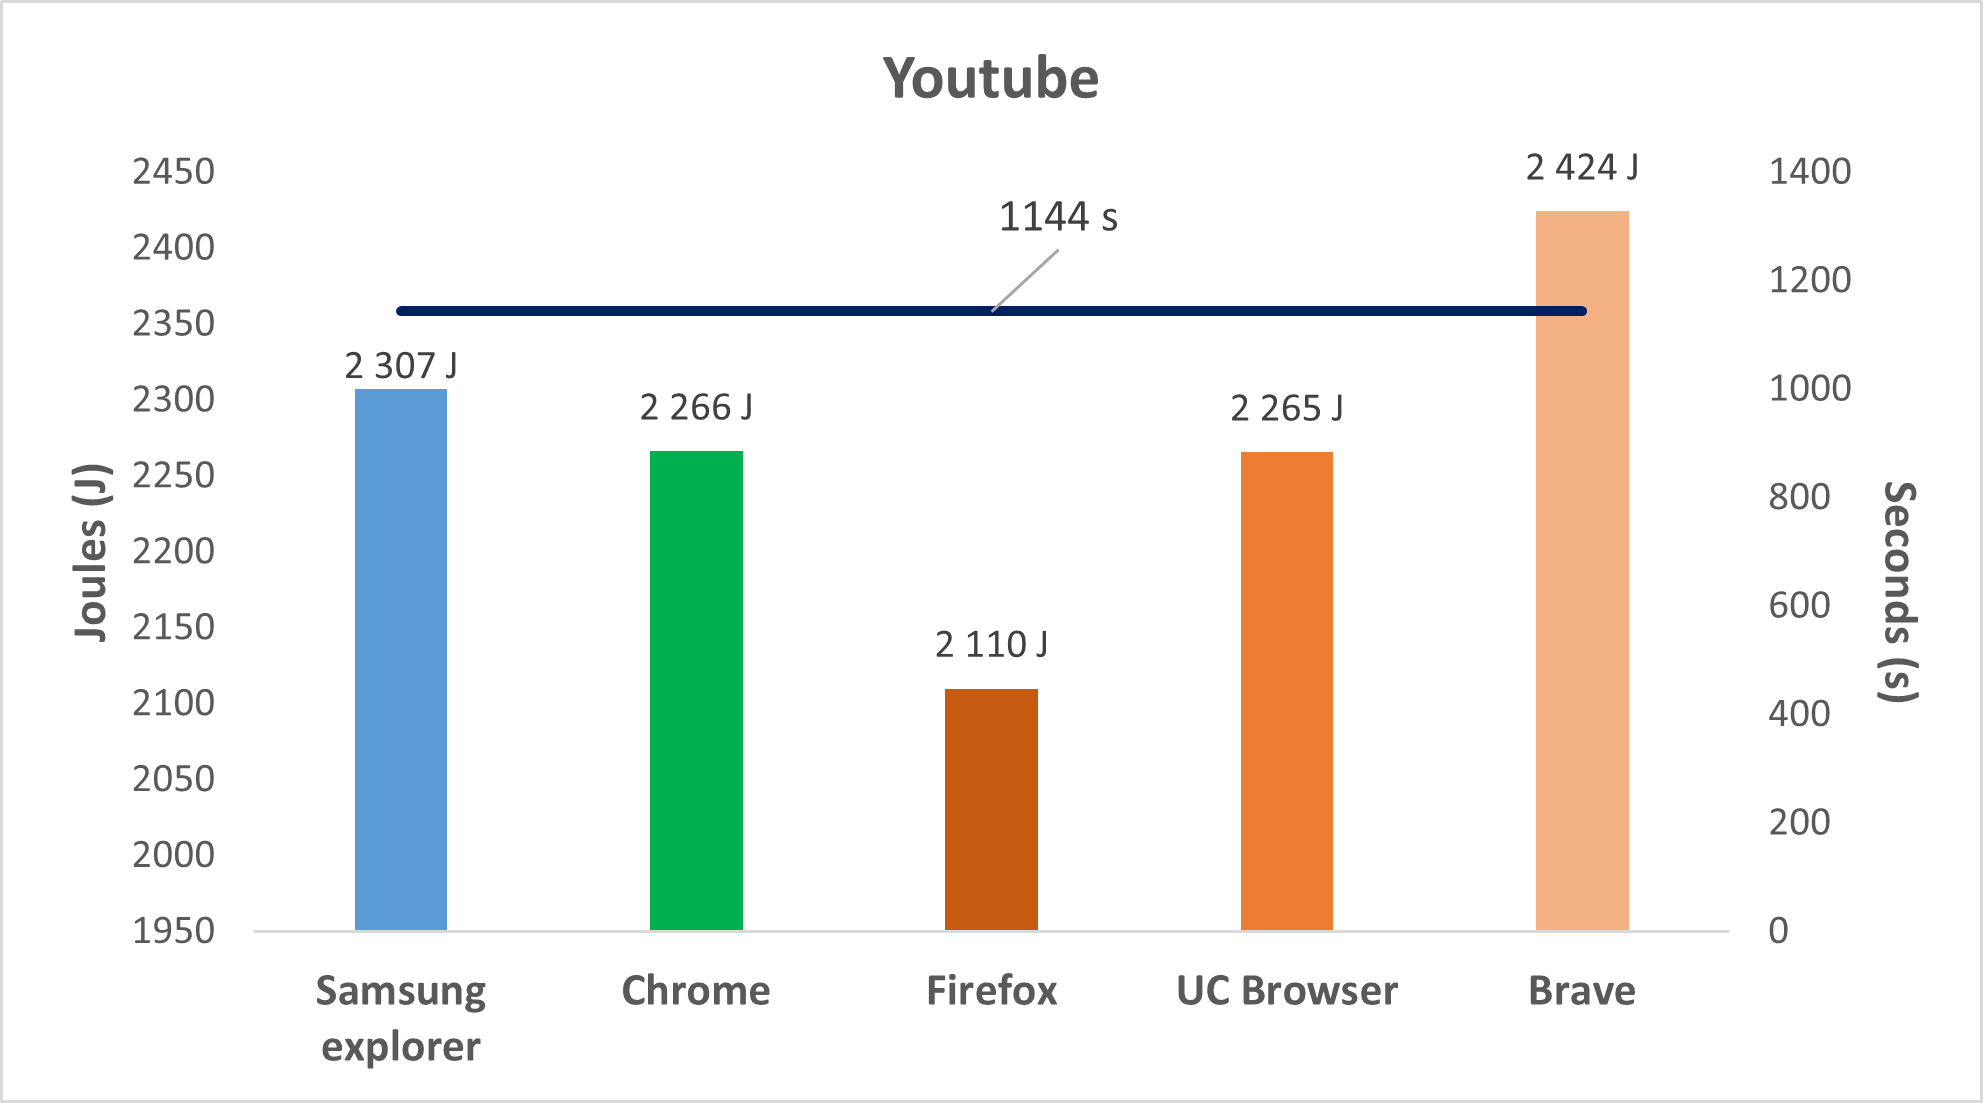
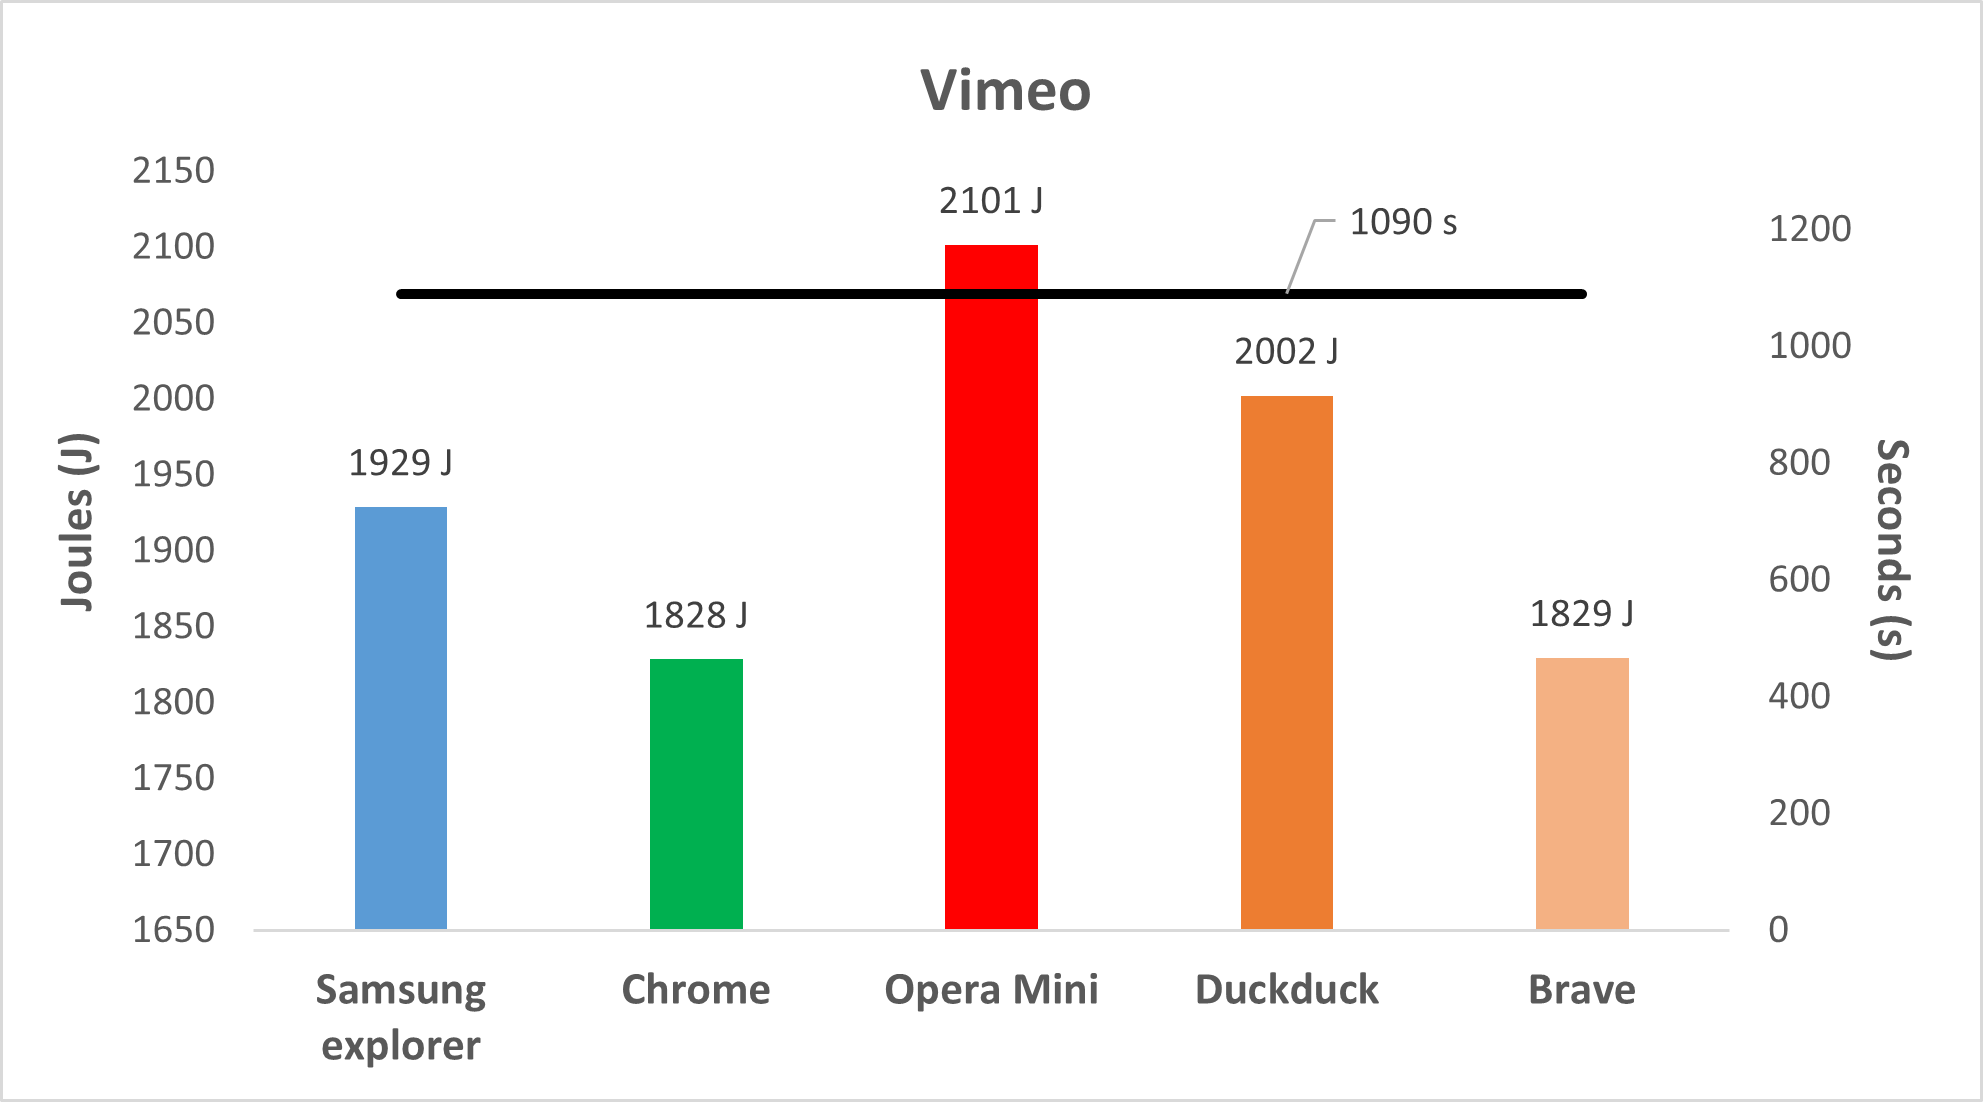
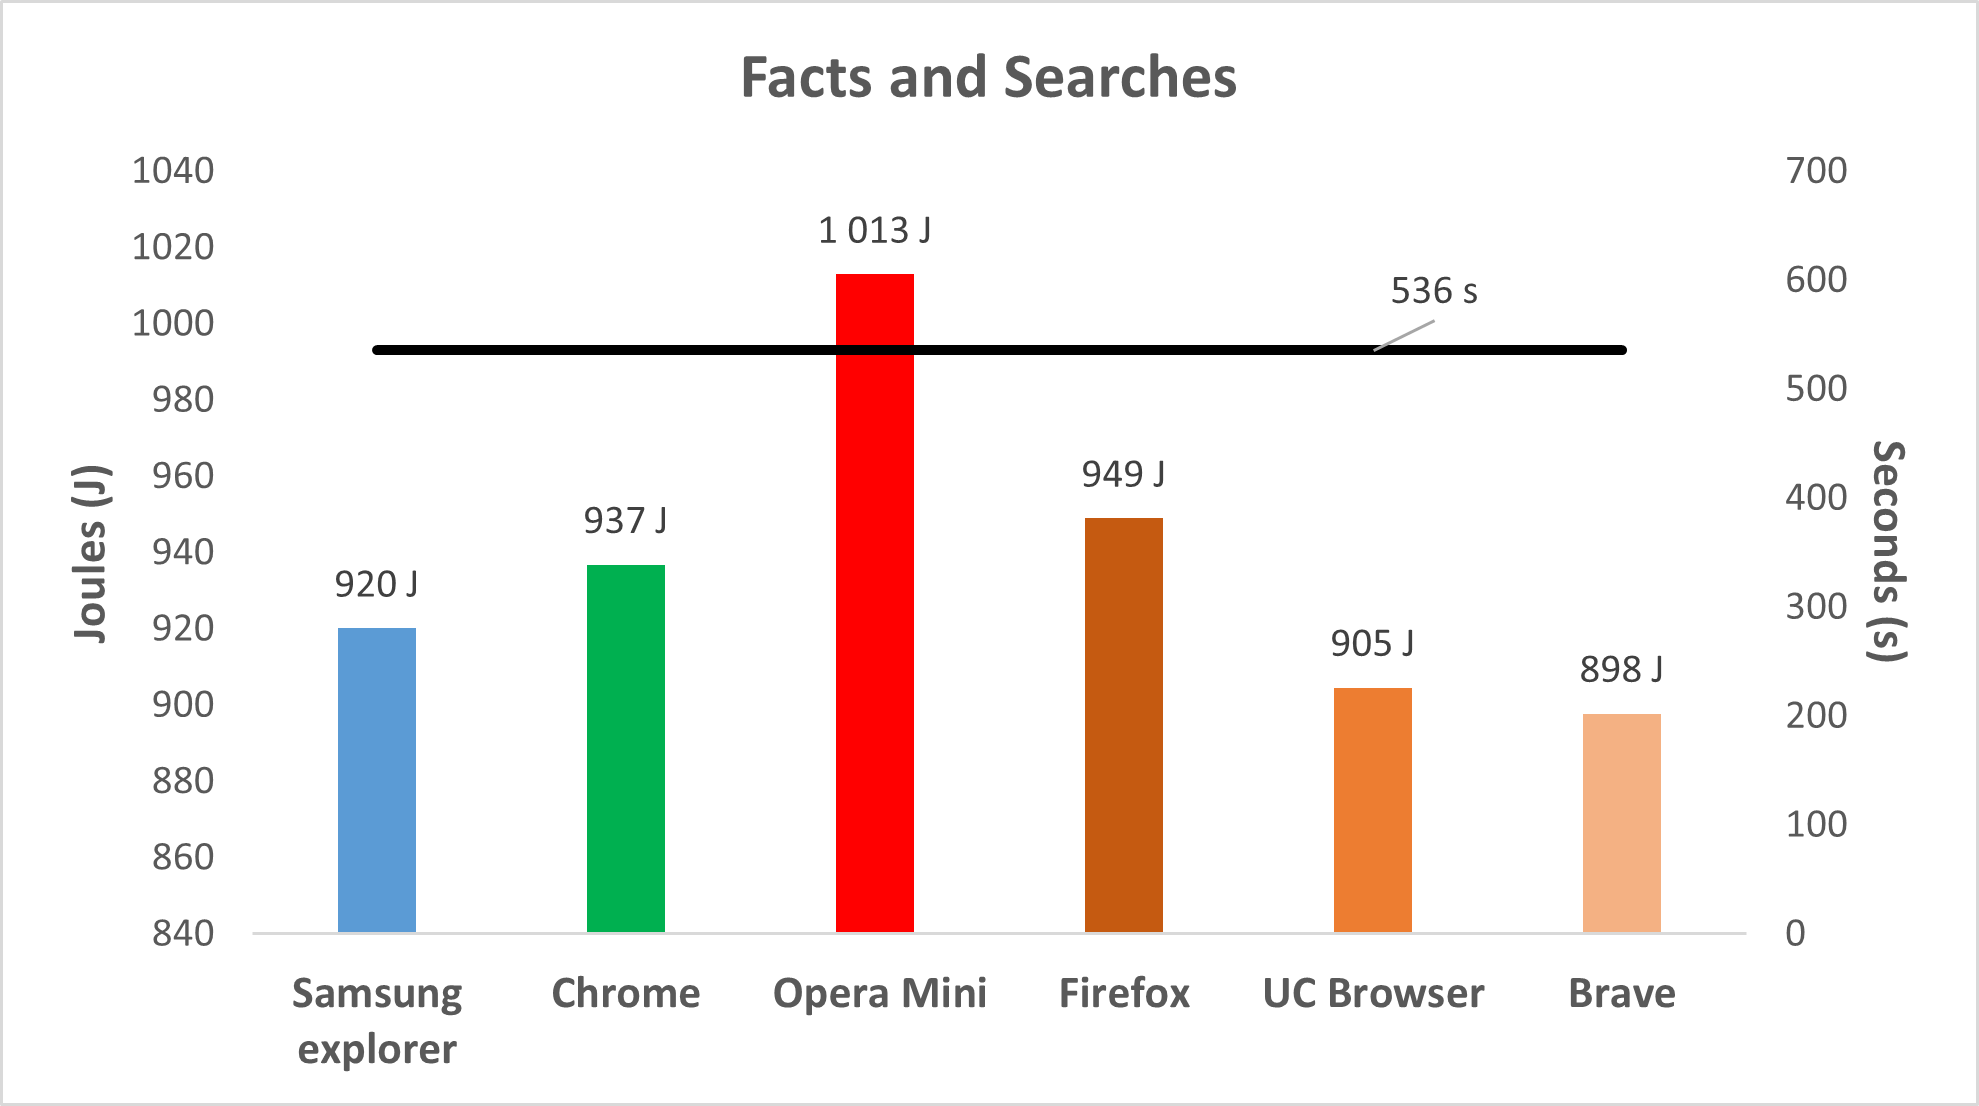
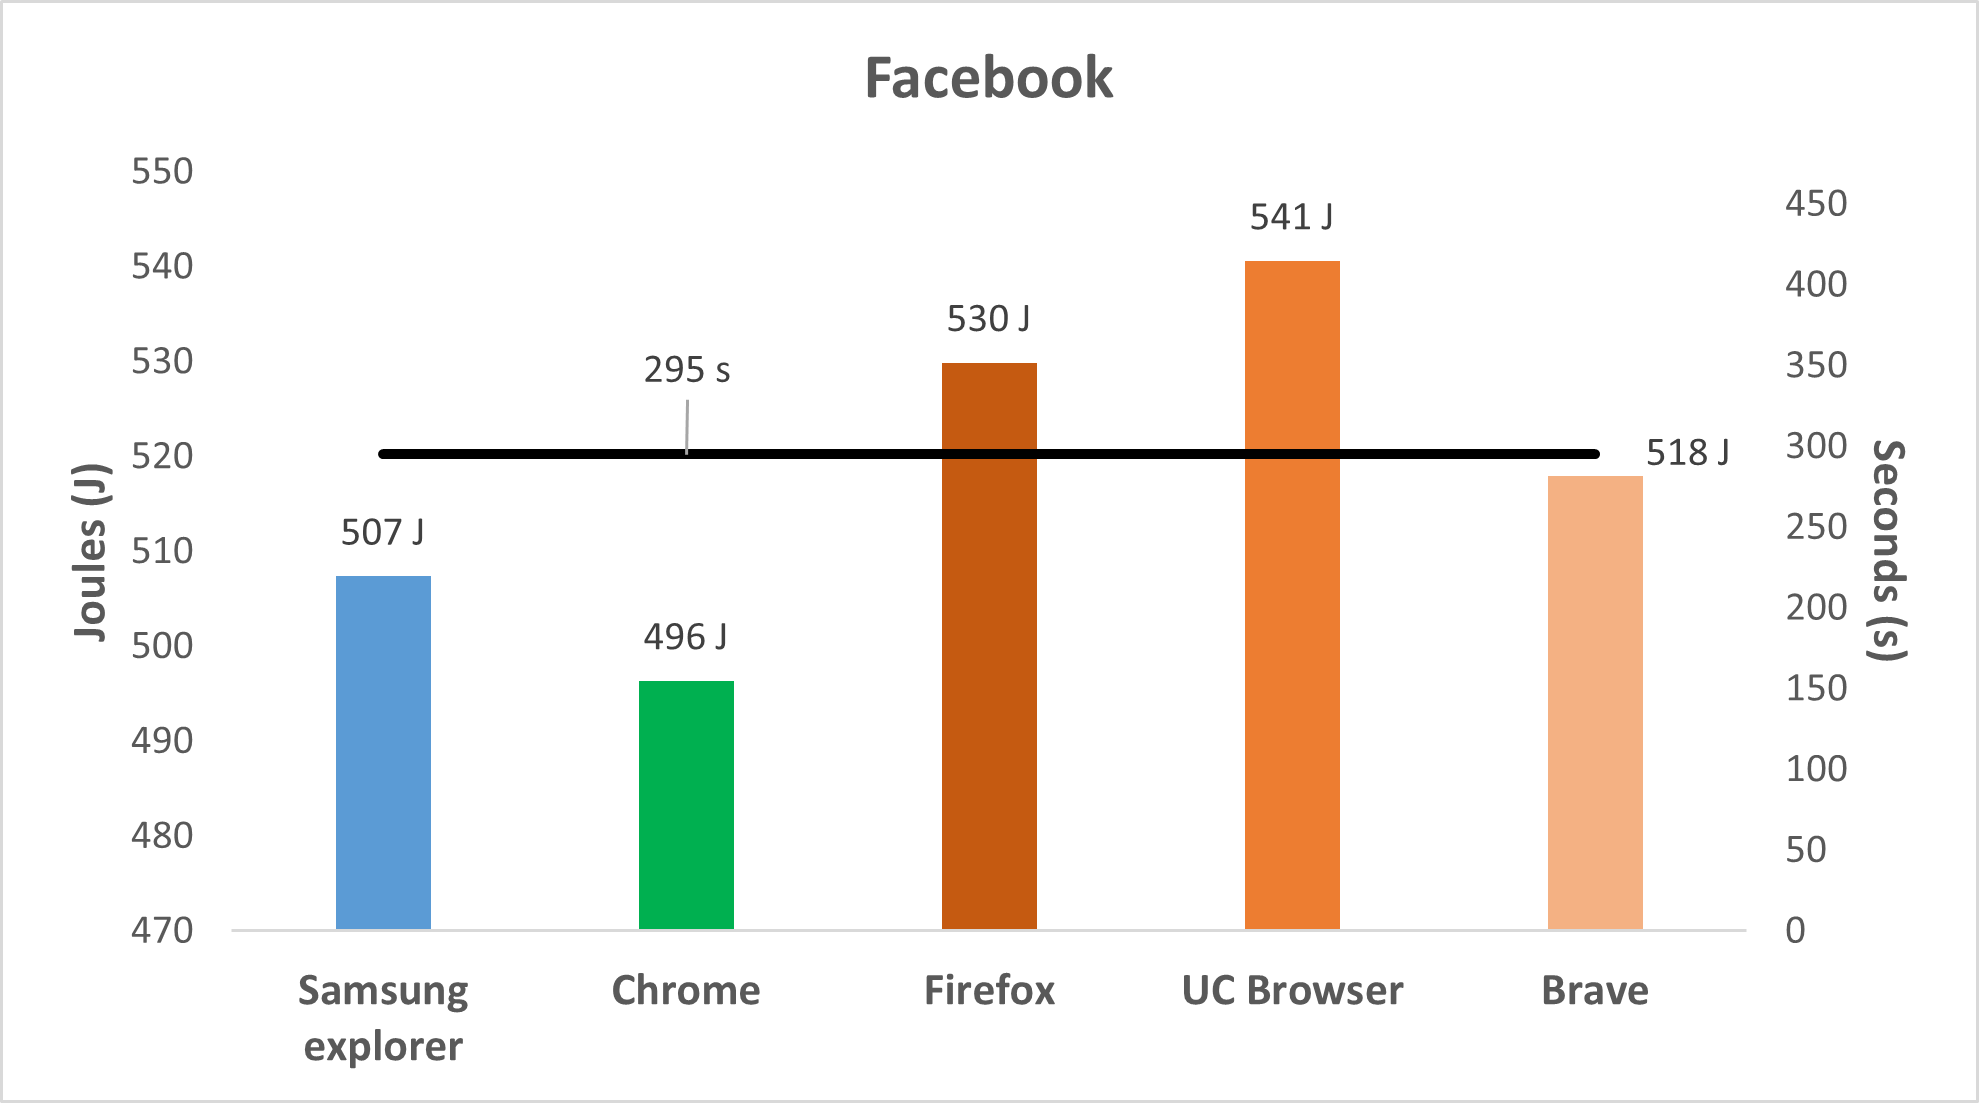
Figure 2 presents violin plots for each browser considered for each scenario. These also show the five results of the executions of each case of study in dots. The five dots of the same color represent the five executions of the same script/scenario. The different colors represent the three different scripts/scenarios. With these plots, it is possible to display the collected data for energy consumption density. Each plot allows understanding the consistency of the results for each browser is consistent through the different usage scenarios. The value of dots corresponds to the y-axis (Total Energy (Joules)). The chart allows us to see that the results of the tests performed are very consistent because the dots of the same color are quite close to each other, although the tests were replicated only five times.
IV-B Analysis
In this section we analyze the results from our experiments.
Youtube
Looking at Figure 1(a), we can see a discrepancy between the results obtained. We can see that all executions run in seconds, so the execution time is not a factor that could influence the results obtained. Firefox was the browser that consumed the least energy, Joules, while Brave consumed Joules. The difference between Chrome and UC Browser is almost none, and Joules respectively, with Samsung Explorer consuming slightly more than these, Joules. Even though Chrome and Samsung sometimes show advertisements (ads) (closed after five seconds), which could negatively influence the energy consumption, they managed to get better results than Brave, which has a built-in ad-blocker, preventing the appearance of advertisement, thus helping to get less energy consumption. In the tests performed for Firefox, no ads appeared when loading the videos, which may have influenced the lower consumption. The UC Browser, on the other hand, although no ads were shown, has other default add-ons being loaded during video loading, which consume more power than Firefox.
Vimeo
The results obtained in the Vimeo test group, Figure 1(b), show that for the duration of the seconds of the test execution, there is a significant difference between the browser that consumed the most energy and the one that consumed the least. Opera Mini consumed in total Joules while Chrome consumed only Joules. Opera Mini’s consumption is probably due to the browser’s goal, which is to ensure high performance but save on the space it takes up, and it also has an ad-block like Brave. To get this increased performance, the browser consumes more energy. Brave managed to have a very low consumption, almost equaling Chrome, Joules, not being the one that consumed less energy for a minimal difference. DuckDuck, on the other hand, is another one that consumed the most energy, being a little behind Opera Mini at Joules. DuckDuck, known for its privacy policies, which can be one of the factors why it has a higher power consumption than the others. The processes that run in the background to ensure the safety of the user’s navigation end up leading to higher consumption. Samsung Explorer consumed 100 Joules more than Chrome, that is Joules, showing, as for Youtube, consistency in its consumption, in which it is not one of the least consuming but also not one of the most consuming. All tests in this group had no ads loading, which allowed a better comparison of results.
Search engine
In Figure 1(c), we can see that the browser that consumed the most energy was Opera Mini, consuming Joules for seconds. Brave is again the least consuming browser with Joules, differing from the UC Browser by Joules, Joules. The remaining browsers have a similar consumption, with Samsung Explorer having Joules, Chrome Joules, and Firefox Joules. Since this group is about loading pages with information and videos specified above, these pages may contain ads and therefore may influence the energy consumption results. Although Opera Mini has a built-in ad-blocker, this was the browser that consumed the most, compared to Brave, which is another one with ad-blocking capabilities, consuming the least. In this respect, Brave makes its claim of minimizing energy consumption true. Another aspect that we can see is the loading of web pages. As we have seen in other works already done, they often keep their focus on performance, i.e., opening the web page in the shortest time possible, thus forgetting to reconcile energy consumption. One of the cases that we can observe is the case of Firefox, which in terms of loading videos, we saw in the Youtube group that it is the most efficient browser. Still, here in terms of loading pages, it has already become the one that consumed more, other than Opera Mini.
Social media
Finally, Figure 1(d) shows the results for the Facebook group where it can be seen that Chrome is the browser that consumed the least energy, with an energy consumption of Joules in seconds. UC Browser has a consumption of Joules, being the browser with the highest consumption in the group. Together with UC Browser is Firefox, which has little difference regarding consumption, with Joules, making it almost the browser with the highest consumption. Brave and Samsung Explorer have similar consumption, consuming and Joules, respectively. Even though Brave has an ad-blocker that sometimes appears on the Facebook web page, it cannot get better results than Chrome and Samsung Explorer. Once again, there is a test regarding page loading in this group, and Firefox gets high results compared to the other browsers. Besides page loading, there is the loading of images. UC Browser and Brave show a higher consumption derived from that, considering that the different test strands specified in design have already been dealt with in the other test groups.
IV-C Hypothesis Testing
In order to validate whether the results obtained have statistically significance, we performed statistical analysis over the collected data. As such, we tested the following hypotheses:
The null hypothesis, , represents that when one randomly draws an object from A and B, the probability of that object being from A is greater than the probability of being from B is . The probability is different from in the alternative hypothesis.
For all the data collected, pairs of browsers were made in the appropriate test groups in order to understand if there is significant relevance between the pair difference, i.e., in the Youtube group, we will get ten pairs; (Samsung, Brave), (Samsung, Chrome), (Samsung, UC), (Samsung, Firefox), (Brave, Chrome), (Brave, UC), (Brave, Firefox), (Chrome, UC), (Chrome, Firefox), (UC, Firefox). This same logic applies to the Vimeo, and search engine groups, with search engine having 15 pairs for six browsers in the test group. These three groups have independent samples, non-normal distributed and thus we ran the Wilcoxon signed-rank test with a two-tail p-value with . The social media group has a different distribution and analyze later. With this in mind, Figure 3 presents heatmaps with the appropriate comparison results for each pair.
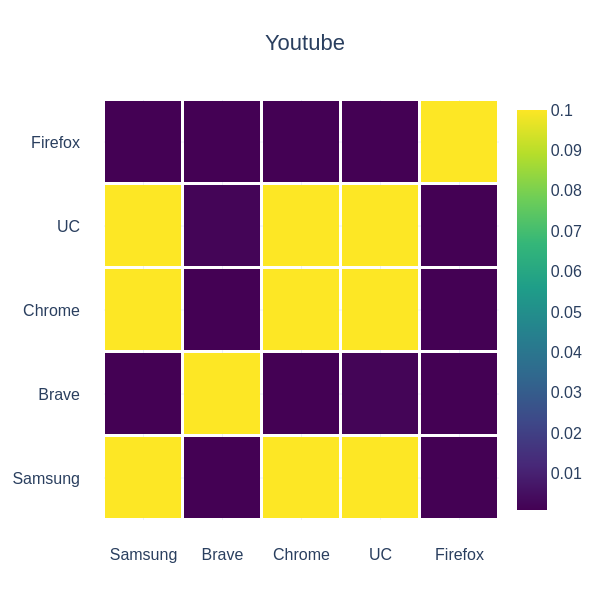

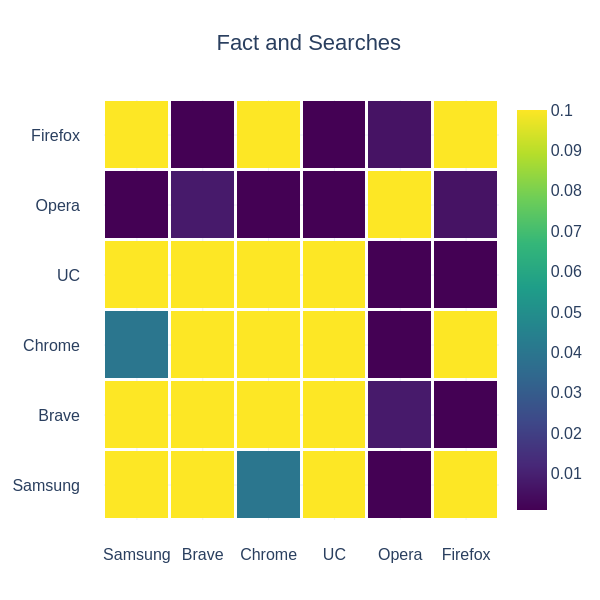
In the present heatmaps, it can be seen which pairs of browsers have a significant difference. Looking at the scale to the right of each heatmap, the color of the p-values is indicated, which is the shades of blue towards purple. In yellow we have the pairs that have no significant difference. In heatmap of Figure 3(a) one can see that all pairs have a p-values , except the pairs (Samsung, Chrome), (Samsung, UC) and (Chrome, UC). In Figure 3(b), which refers to Vimeo, the pair (Brave, Chrome) has p-value and no significant difference. All other pairs show a highly significant difference. In Figure 3(c) the pairs of Opera Mini, (Firefox, Brave) and (Firefox, UC) in the search engine group, have p-values , while the others have p-value and so the difference between them is not significant. In this group, the differences are not significant, except when compared with Opera, due to the difference in energy consumption.
To calculate a non-parametric effect size, Field [34] suggests using Rosenthal’s formula [35, 36] to compute a correlation, and compare the correlation values against Cohen’s [37] thresholds of , , and for small, medium, and large magnitudes, respectively. For all pairs that showed a significant difference, with a p-value , we calculated the effect size and all the results obtained are greater than . We can then conclude that all pairs with a significant difference has a large effect size.
In the case of the Facebook group, the data follows a normal distribution and so it was necessary to use another statistical method. We used the Analysis of Variance (ANOVA), which is a method that compares the means of more than 2 test groups, that is, in this case, it will serve to compare the means of the various pairs within the Facebook group. It is thus possible to analyze whether there is a significant variance between them. One-Way ANOVA was the type used for this case because it has only one independent variable. The ANOVA hypotheses are:
-
•
Null hypothesis: Groups means are equal (no variation in means of groups).
-
•
Alternative hypothesis: At least, one group mean is different from other groups.
After calculating the p-value by using the ANOVA analysis, a p-value of was obtained. The p-value obtained from the ANOVA analysis is significant (), and therefore, we conclude that there are significant differences among treatments. To know the pairs of significantly different treatments, we will perform multiple pairwise comparison (post hoc comparison) analyses for all unplanned comparisons using Tukey’s honestly significantly differenced (HSD) test. With this, the p-values of each pair were calculated, and these are represented in Figure 4.
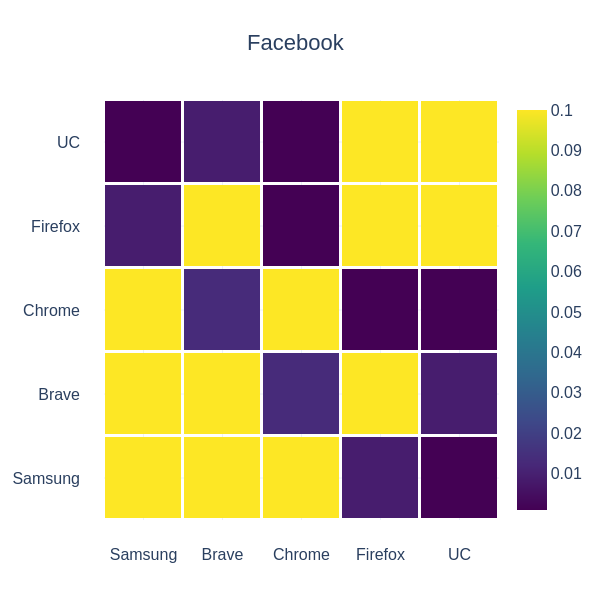
As we can see, the p-value calculated through ANOVA analysis, , is due to most of the compared pairs having a p-value , except the pairs (Samsung, Brave), (Samsung, Chrome), (Brave, Firefox) and (Firefox, UC). To understand the effect size of this analysis, Cohen’s F formula was used [37], where the basic rules of thumb are that indicates a small effect, indicates a medium effect, and indicates a large effect. The result of the formula was , which means that all pairs with a significant difference have a large effect size.
IV-D Research Questions Revisited
In Table II, we can see the summary of browsers’ rankings in each test scenario.
| Chrome | Samsung | Brave | Firefox | UC | Opera | Duck | |
|---|---|---|---|---|---|---|---|
| Youtube | 3 | 4 | 5 | 1 | 2 | ||
| Vimeo | 1 | 3 | 2 | 5 | 4 | ||
| Search Engine | 4 | 3 | 1 | 5 | 2 | 6 | |
| 1 | 2 | 3 | 4 | 5 | |||
| Mean | 2.25 | 3 | 2.75 | 3.33 | 3 | 5.5 | 4 |
After analyzing these results, it is possible to answer the five research questions presented in Section I.
RQ1: Which mobile browser is the most energy-efficient for browsing Youtube?
As we can see, in the Youtube test group, Firefox was the most energy efficient. On Youtube, ads often appear in some browsers, such as Chrome and Samsung, influencing their consumption. Nevertheless, they had a little different consumption from UC Browser, which does not have ads in its executions. Even so, Firefox presents a result of reduced energy consumption compared with the others. For this task, Brave is the most energy-greedy browser.
RQ2: Which mobile browser is the most energy-efficient for browsing Vimeo?
For this question, it is possible to affirm that Chrome is the most energy-efficient browser. As Vimeo never shows ads, Chrome, unlike Youtube, shows the best consumption results. Brave and Samsung Explorer are also viable options since they differ little from Chrome. Opera Mini occupies the last place in the ranking, being the most energy greedy option for browsing Vimeo.
RQ3: Which mobile browser is the most energy-efficient for performing searches in search engines?
In this case, we can say that Brave is the most energy-efficient browser for searching Google. In this test group, Brave does justice to one of the characteristics that it claims to have, consuming less energy than the other browsers. UC Browser is also a viable option since it presents little difference from Brave. Once again, Opera Mini has the highest consumption, being the most energy-greedy alternative for the designed tests.
RQ4: Which mobile browser is the most energy-efficient for browsing Facebook?
In this case, it is possible to state that the most energy-efficient browser is once again Chrome. In this test scenario, there is again the loading of a video and, in addition, the loading of images and the news feed. Chrome presents a better capacity than the others to manage its energy consumption, being the most viable option. Samsung Explorer is also a viable option.
RQ5: Which mobile browser is the most energy-efficient overall?
To answer this question, one needs to make an overall assessment of our four test scenarios. In Table II, each Browser’s rankings were averaged, considering which test scenarios they entered, to understand the rankings in total better. Although the browsers are not tested in all the test scenarios, it is possible to state that Chrome presents the best results throughout the four test scenarios. Right after Chorme we have Brave, whose results are highly affected by its energy-greedy behavior while browsing Youtube. We conclude that Chrome is the most energy-efficient browser, but Brave is also a viable option, presenting interesting results in several scenarios.
V Threats to Validity
This work aims to measure the energy consumption of browsers in the Android environment and compare the results to know which browser is more energy efficient. We present in this section some threats to the validity of our study, separated into four categories [38].
Conclusion Validity
In this category are the threats which may influence the capacity to draw correct conclusions. It was not possible to compare all the selected browsers in all groups, and thus there may be cases where a browser not tested in one group would show better results. Nevertheless, the results are consistent in almost all the combinations of browsers and tasks, which is also supported by the statistical analysis.
Internal Validity
This category discusses factors that may interfere with the results of our study. A possible issue relates to the measurement of the energy consumed. We have used a viable tool, Trepn, for monitoring the execution of the scripts and to get the results. This tool has been used in many other studies and shown to be reliable [11, 39, 33]. While testing, we encountered an initial problem when executing the scripts. Not all browsers have the same response time in terms of performance, and therefore, when running the scripts they had different times for the same steps. To avoid a possible influence on the results, we made individual scripts in which the execution time is the same for all. To execute the scripts we used RERAN, a state-of-the-art tool used in previous studies in the literature, whose event replication has little overhead when compared to real events triggered by actions of real users. The test script was made for each browser in each test group, giving a total of 52 scripts, each of which was run 5 times, making a total of 260 runs.
Construct Validity
This section endorses threats that involve generalizing the results to the concept or theory behind the experiment. Although we cannot generalize the results for other browsers, we analyzed seven of the most used and relevant browsers. While it was not possible in the four test groups to test all browsers together, the results obtained are consistent.
External Validity
This category is concerned with the generalization of the results to industrial practice. Measurements in different systems might produce slightly different resulting values if replicated. We believe these results can be further generalized, and other researchers can replicate our methodology for future work.
VI Conclusions
This paper presented a preliminary study regarding the energy consumption of web browsers in the Android ecosystem. We studied the energy consumed by seven of the most popular browsers available on Android, by designing and executing a semi-automatic procedure aiming to simulate real user interaction with a browser. For this purpose, we used a record and replay tool of events on the screen to record a set of interactions that intend to simulate the execution of three browser usage scenarios: browsing and viewing videos on streaming video services, performing searches in search engines and browse social networks.
Our preliminary results show that there is not a browser with the best performance for all the tasks considered. We conclude that Google Chrome was the greenest browser, according to a ranking designed for comparing the energy performance of the usage scenarios. Chrome was the most energy-friendly browser for playing videos on Vimeo and browsing Facebook. Surprisingly, Chrome does not perform well when performing searches in the Google search engine. Nevertheless, Chrome is the greenest browser in our study, with Brave close behind. Finally, we also observed that Opera Mini was the most energy greedy, presenting the worst performance for playing videos on Vimeo and searching on Google.
Acknowledgment
This work is financed by National Funds through the Portuguese funding agency, FCT - Fundação para a Ciência e a Tecnologia with references UIDB/50021/2020 and UIDB/50014/2020, and a PhD scholarship with reference SFRH/BD/146624/2019.
References
- [1] J. Nejati and A. Balasubramanian, “An in-depth study of mobile browser performance,” in Proceedings of the 25th International Conference on World Wide Web, ser. WWW ’16. Republic and Canton of Geneva, CHE: International World Wide Web Conferences Steering Committee, 2016, p. 1305–1315. [Online]. Available: https://doi.org/10.1145/2872427.2883014
- [2] K. Borgolte and N. Feamster, “Understanding the performance costs and benefits of privacy-focused browser extensions,” in Proceedings of The Web Conference 2020, ser. WWW ’20. New York, NY, USA: Association for Computing Machinery, 2020, p. 2275–2286. [Online]. Available: https://doi.org/10.1145/3366423.3380292
- [3] D. Tian and Y. Ma, “Understanding quality of experiences on different mobile browsers,” in Proceedings of the 11th Asia-Pacific Symposium on Internetware, ser. Internetware ’19. New York, NY, USA: Association for Computing Machinery, 2019. [Online]. Available: https://doi.org/10.1145/3361242.3361249
- [4] B. Pourghassemi, A. Amiri Sani, and A. Chandramowlishwaran, “What-if analysis of page load time in web browsers using causal profiling,” Proc. ACM Meas. Anal. Comput. Syst., vol. 3, no. 2, Jun. 2019. [Online]. Available: https://doi.org/10.1145/3341617.3326142
- [5] G. Pinto and F. Castor, “Energy efficiency: a new concern for application software developers,” Communications of the ACM, vol. 60, no. 12, pp. 68–75, 2017.
- [6] Qualcomm, “Trepn profiler,” https://www.mscsoftware.com/product/adams;https://www.coursehero.com/file/13499609/tire-models/, 2013, accessed: 2022-01-20.
- [7] L. Gomez, I. Neamtiu, T. Azim, and T. Millstein, “RERAN: Timing- and touch-sensitive record and replay for android,” in 2013 35th International Conference on Software Engineering (ICSE), 2013, pp. 72–81.
- [8] Statista. (2022) Youtube - statistics & facts. Accessed: 2022-05-19. [Online]. Available: https://www.statista.com/topics/2019/youtube/#dossierKeyfigures
- [9] ——. (2022) Number of vimeo mobile app downloads worldwide and in the united states from 2015 to 2021. Accessed: 2022-05-19.
- [10] ——. (2022) Most popular social networks worldwide as of january 2022, ranked by number of monthly active users. Accessed: 2022-05-19. [Online]. Available: https://www.statista.com/statistics/272014/global-social-networks-ranked-by-number-of-users/
- [11] R. Rua, T. Fraga, M. Couto, and J. Saraiva, “Greenspecting Android virtual keyboards,” Proceedings - 2020 IEEE/ACM 7th International Conference on Mobile Software Engineering and Systems, MOBILESoft 2020, pp. 98–108, 2020.
- [12] K. Borgolte and N. Feamster, “Understanding the performance costs and benefits of privacy-focused browser extensions,” in Proceedings of The Web Conference 2020, ser. WWW ’20. New York, NY, USA: Association for Computing Machinery, 2020, p. 2275–2286. [Online]. Available: https://doi.org/10.1145/3366423.3380292
- [13] J. Nejati and A. Balasubramanian, “An in-depth study of mobile browser performance,” in Proceedings of the 25th International Conference on World Wide Web, ser. WWW ’16. Republic and Canton of Geneva, CHE: International World Wide Web Conferences Steering Committee, 2016, p. 1305–1315. [Online]. Available: https://doi.org/10.1145/2872427.2883014
- [14] G. Ramesh and R. Umarani, “Performance analysis of most common encryption algorithms on different web browsers,” International Journal of Information Technology and Computer Science, vol. 4, no. 12, pp. 60–66, 2012. [Online]. Available: https://www.mecs-press.org/ijitcs/ijitcs-v4-n12/IJITCS-V4-N12-6.pdf
- [15] L. Cruz and R. Abreu, “Poster: Measuring the energy footprint of mobile testing frameworks,” in 2018 IEEE/ACM 40th International Conference on Software Engineering: Companion (ICSE-Companion), 2018, pp. 400–401.
- [16] N. Thiagarajan, G. Aggarwal, A. Nicoara, D. Boneh, and J. P. Singh, “Who killed my battery? analyzing mobile browser energy consumption.” New York, NY, USA: Association for Computing Machinery, 2012. [Online]. Available: https://doi.org/10.1145/2187836.2187843
- [17] D. Hsu, I. Kanj, and M. Trieu, “Chrome VS Firefox VS Opera on Android : Which Browser Consumes Less Energy in Android ?” no. 2614921, pp. 1–35, 2017.
- [18] F. Bouaffar, O. Le Goaer, and A. Noureddine, “Powdroid: Energy profiling of android applications,” in 2nd International Workshop on Sustainable Software Engineering (SUSTAINSE), Melbourne, Australia, Nov. 2021. [Online]. Available: https://hal.archives-ouvertes.fr/hal-03380605
- [19] J. de Macedo, J. Aloísio, N. Gonçalves, R. Pereira, and J. Saraiva, “Energy wars - chrome vs. firefox: Which browser is more energy efficient?” in 2020 35th IEEE/ACM International Conference on Automated Software Engineering Workshops (ASEW), 2020, pp. 159–165.
- [20] H. David, E. Gorbatov, U. R. Hanebutte, R. Khanna, and C. Le, “Rapl: Memory power estimation and capping,” in 2010 ACM/IEEE International Symposium on Low-Power Electronics and Design (ISLPED), 2010, pp. 189–194.
- [21] S. Pandruvada, “Intel® power governor,” https://01.org/blogs/2014/running-average-power-limit-%E2%80%93-rapl, 2014, accessed: 2020-11-26.
- [22] S. F. Conservancy. (2021) Selenium automates browsers. that’s it! [Online]. Available: https://www.selenium.dev/
- [23] S. Abdulsalam, Z. Zong, Q. Gu, and M. Qiu, “Using the greenup, powerup, and speedup metrics to evaluate software energy efficiency,” in Proc. of the 6th Int. Green and Sustainable Computing Conference. IEEE, 2015, pp. 1–8.
- [24] M. Couto, T. Car cão, J. Cunha, J. P. Fernandes, and J. Saraiva, “Detecting anomalous energy consumption in android applications,” in Programming Languages, ser. Lecture Notes in Computer Science, F. Quintão Pereira, Ed., vol. 8771. Springer Int. Publishing, 2014, pp. 77–91. [Online]. Available: https://link.springer.com/chapter/10.1007/978-3-319-11863-5_6
- [25] R. Pereira, T. Carção, M. Couto, J. Cunha, J. P. Fernandes, and J. Saraiva, “Spelling out energy leaks: Aiding developers locate energy inefficient code,” Journal of Systems and Software, vol. 161, p. 110463, 2020.
- [26] Statcounter. (2020) Mobile browser market share worldwide. Accessed: 2020-11-10. [Online]. Available: https://gs.statcounter.com/browser-market-share/mobile/worldwide/#monthly-201909-202009-bar
- [27] Wikipedia. (2021) List of most-viewed youtube videos. Accessed: 2021-08-10. [Online]. Available: https://en.wikipedia.org/wiki/List_of_most-viewed_YouTube_videos
- [28] NASA. (2008) Nasa: The first person on the moon. Accessed: 2021-08-10. [Online]. Available: https://www.nasa.gov/audience/forstudents/k-4/stories/first-person-on-moon.html
- [29] Wikipedia. (2021) Apollo 11. Accessed: 2021-08-10. [Online]. Available: https://en.Wikipedia.org/wiki/Apollo_11
- [30] ——. (2021) World war ii. Accessed: 2021-08-10. [Online]. Available: https://en.Wikipedia.org/wiki/World_War_II
- [31] Delish. (2021) Chicken weeknight dinners. Accessed: 2021-08-10. [Online]. Available: https://www.delish.com/cooking/recipe-ideas/g2972/chicken-weeknight-dinners/
- [32] J. Noticias. (2021) Jornal noticias facebook page. Accessed: 2021-08-10. [Online]. Available: https://www.facebook.com/jornalnoticias
- [33] D. Di Nucci, F. Palomba, A. Prota, A. Panichella, A. Zaidman, and A. De Lucia, “Petra: A software-based tool for estimating the energy profile of android applications,” in 2017 IEEE/ACM 39th International Conference on Software Engineering Companion (ICSE-C), 2017, pp. 3–6.
- [34] A. Field, “Discovering statistics using spss third edition,” 2009.
- [35] R. Rosenthal, “Meta-analytic procedures for social science research sage publications: Beverly hills, 1984, 148 pp.” Educational Researcher, vol. 15, no. 8, pp. 18–20, 1986.
- [36] R. Rosenthal and R. L. Rosnow, Essentials of behavioral research: Methods and data analysis, 2008.
- [37] J. Cohen, Statistical power analysis for the behavioral sciences. Academic press, 2013.
- [38] D. T. Campbell, Quasi-experimentation: Design & analysis issues for field settings. Boston, 1979.
- [39] M. Linares-Vásquez, G. Bavota, C. Bernal-Cárdenas, R. Oliveto, M. Di Penta, and D. Poshyvanyk, “Mining energy-greedy API usage patterns in android apps: An empirical study,” 11th Working Conference on Mining Software Repositories, MSR 2014 - Proceedings, pp. 2–11, 2014.