What Do Compressed Multilingual Machine Translation Models Forget?
Abstract
Recently, very large pre-trained models achieve state-of-the-art results in various natural language processing (NLP) tasks, but their size makes it more challenging to apply them in resource-constrained environments. Compression techniques allow to drastically reduce the size of the models and therefore their inference time with negligible impact on top-tier metrics. However, the general performance averaged across multiple tasks and/or languages may hide a drastic performance drop on under-represented features, which could result in the amplification of biases encoded by the models. In this work, we assess the impact of compression methods on Multilingual Neural Machine Translation models (MNMT) for various language groups, gender, and semantic biases by extensive analysis of compressed models on different machine translation benchmarks, i.e. FLORES-101, MT-Gender, and DiBiMT. We show that the performance of under-represented languages drops significantly, while the average BLEU metric only slightly decreases. Interestingly, the removal of noisy memorization with compression leads to a significant improvement for some medium-resource languages. Finally, we demonstrate that compression amplifies intrinsic gender and semantic biases, even in high-resource languages.111We release our implementation at https://github.com/alirezamshi/bias-compressedMT.
1 Introduction
Over the recent years, pre-trained Transformer Vaswani et al. (2017) models have reached a substantial improvement in a variety of Natural Language Processing (NLP) tasks. This improvement mostly comes from increasing their parameter size Devlin et al. (2019); Fan et al. (2020); Brown et al. (2020); Zhang et al. (2022) which escalates the cost of training Yang et al. (2019); Strubell et al. (2019); Patterson et al. (2021), and hurts the memory footprint and latency at inference Dai et al. (2019); Fan et al. (2020); Wang et al. (2022). Specially in Neural Machine Translation (NMT) task, massively MNMT models Aharoni et al. (2019); Fan et al. (2020); Tang et al. (2020); Zhang et al. (2020) demonstrated promising results. They have been shown particularly interesting for low-resource languages which benefit a lot from knowledge transfer. On the other hand, it has also been observed that the curse of multilinguality may hurt the performance in high-resource languages. The strategy employed to overcome this problem Aharoni et al. (2019); Fan et al. (2020); Goyal et al. (2021a) is to scale up the number of parameters, thus attaining state-of-the-art performance in both high and low-resource languages.
Consequently, efficient inference with these very large models has become a crucial problem. This challenge can be overcome through model compression, e.g. knowledge distillation Kim and Rush (2016); Sanh et al. (2019); Li et al. (2020); Wang et al. (2021), pruning Michael H. Zhu (2018); Frankle and Carbin (2019); Behnke and Heafield (2020); Zhang et al. (2021), and quantization Xu et al. (2018); Wu et al. (2020); Bondarenko et al. (2021); Kim et al. (2021a); Tao et al. (2022); Yang et al. (2022); Yao et al. (2022). These methods can be applied with a little loss in top-line metrics, while reducing the memory-footprint, and enhancing inference time. However, recent work Hooker et al. (2020); Ahia et al. (2021); Xu et al. (2021); Du et al. (2021); Renduchintala et al. (2021) has demonstrated that under-represented features can suffer from a drastic decrease in performance which is not necessarily reflected by global (aggregated) metrics. In multilingual NMT, the overall metrics are often reported as an average across all the language pairs, where the performance between individual language pairs can vary a lot. Therefore it is even more critical to understand what would be the exact impact of compression on multilingual NMT models, beyond the aggregated metrics.
In this work, we illustrate the impacts of applying compression methods to massively multilingual NMT models, that are pre-trained in a great number of languages in several domains. To the best of our knowledge, this is the first attempt to analyze how compression impacts massively multilingual models. We hope it could be a starting point to bringing a comprehensive understanding between fairness and compression in multilingual NMT models. In this study, we concentrate on light compression techniques, specifically post-training quantization and magnitude pruning without any further fine-tuning.222The reason is that fine-tuning MNMT models is extremely computationally demanding. We exploit the recent and largest MNMT model, M2M-100 Fan et al. (2020) that covers 100 languages and contains nearly 12B parameters and analyze the impact of compression on different language pairs evaluated on FLORES-101 benchmark Goyal et al. (2021b) (covering 101 languages). We also consider MT-Gender Stanovsky et al. (2019) and DiBiMT Campolungo et al. (2022) benchmarks allowing us to assess different types of biases that could be present in the data and MNMT model. To sum up, our contributions are as follows:
-
•
We conduct extensive analysis on the effects of light compression methods for massively multilingual NMT models.
-
•
On FLORES-101 Goyal et al. (2021b), we discover that while the overall performance is barely impacted by the compression, a subset of language pairs corresponding to under-represented languages during training suffers an extreme drop in performance.
-
•
Also, we observe an important improvement for some language pairs after the compression. We hypothesize that this is due to the removal of noisy memorization.
-
•
We show that the compression amplifies gender and semantic biases, hidden in MNMT models across several high-resource languages by evaluating on MT-Gender, and DiBiMT benchmarks.
2 Model and Compression Techniques
2.1 M2M-100 Model
We assume that potential biases, discovered after the compression are mostly related to the training data, than the model architecture, as previous work Hooker et al. (2020) demonstrated for the image classification task.
So, we use M2M-100 Fan et al. (2020), as it is the best performing and the largest massively multilingual MT model, which covers more than 10K language directions, including a great number of low and medium-resource language pairs. Other previous work Aharoni et al. (2019); Tang et al. (2020) cover fewer languages, especially from low and medium-resource languages, and have worse results compared to M2M-100.
M2M-100 is trained on large-scale multilingual corpora El-Kishky et al. (2020); Schwenk et al. (2021) with a novel data mining procedure, that uses language similarities. The biggest model introduced consists of 24 encoder, and 24 decoder Transformer Vaswani et al. (2017) layers. Using several scaling techniques, it is trained with nearly 12B parameters. We refer to Fan et al. (2020) for more details. In all our experiments, we exploit the largest M2M-100 model.
2.2 Light Compression Techniques
Compression techniques without any further fine-tuning are defined as light compression methods. We do not fine-tune the compressed models due to the massive computation cost, as we have to fine-tune the model for all language pairs to provide a fair comparison. 333Additionally, the exact and original training data is required to alleviate the additional bias added by fine-tuning, but M2M-100 authors do not provide the exact data e.g. back-translation. We discuss our methods in the following paragraphs.
Magnitude Pruning is a popular technique for both memory footprint reduction and inference speed-up. It reduces the model size by removing redundant nodes that do not contribute to the resulting performance. It usually achieves comparable results with state-of-the-art models with further fine-tuning Michael H. Zhu (2018); Gale et al. (2019); Menghani (2021); Ahia et al. (2021). In this work, we apply post-training magnitude pruning for each layer of Transformer (including Embedding layers). Given as the parameters of Transformer layer and as the sparsity ratio, the output of the pruning function is where percentage of weights sets to zero.444Preliminary experiments showed that pruning based on Transformer layer results in a better performance than other alternatives e.g. separate pruning of self-attention and feed-forward layers. The comparison is provided in Appendix A.
Post-Training Quantization Recent work applies post-training, and training-aware quantization to pre-trained machine translation and language models Wu et al. (2020); Menghani (2021); Liang et al. (2021); Bondarenko et al. (2021); Wei et al. (2022), and achieves promising results while lowering the inference latency, and the model size. In this work, we exploit the post-training quantization method proposed by Wu et al. (2020), converting all weights and activations from 32-bit floating-point values to an 8-bit fixed-point integer. Specifically, it quantizes linear layers input and weights, matrix multiplications, and the residual summations for Transformer Vaswani et al. (2017).
3 Experimental Setup
3.1 Evaluation Benchmarks
We analyze our compressed models on three different NMT benchmarks. We exploit FLORES-101 Goyal et al. (2021b) to study the model behavior based on the amount of available resources for each language. MT-Gender Stanovsky et al. (2019) is used to study the impact of compression on gender bias. Finally, we evaluate on DiBiMT Campolungo et al. (2022) to illustrate the compression effect on semantic biases.
FLORES-101
is a many-to-many NMT evaluation benchmark, including sentences extracted from English Wikipedia. It is translated into 101 languages by human translators, enabling 10,100 language directions to be evaluated. In this paper, we evaluate our models on devtest subset of the FLORES-101 Goyal et al. (2021b) benchmark. This benchmark provides test sets comparable across all the language pairs, and thus allows us to assess to what extent each language pair gets impacted by the compression techniques.
MT-Gender
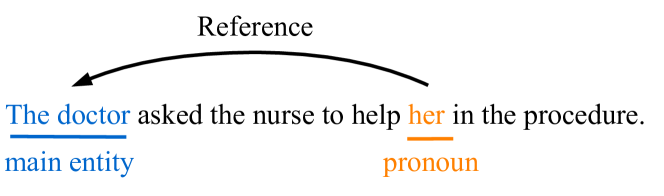
Stanovsky et al. (2019) is an English-centric multilingual NMT benchmark for evaluating gender bias in multiple target languages: Arabic, Ukrainian, Hebrew, Russian, Italian, French, Spanish, and German. The method relies on automatic alignment and morphological analysis, without the need for gold translations.555For each instance, the main entity is attached to a pronoun, and the side entity attempts to distort the translation. With the use of automatic alignment and morphological analysis, the translated gender is extracted. An example is shown in Figure 1(a). Later, Kocmi et al. (2020) extends the benchmark by adding Czech and Polish languages. We choose MT-Gender as it covers more languages compared to other existing MT gender bias benchmarks Bentivogli et al. (2020); Renduchintala et al. (2021); Savoldi et al. (2022).
DiBiMT
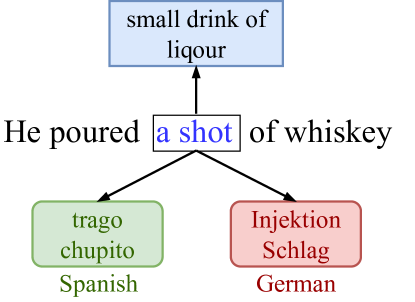
is the first fully manually-crafted NMT benchmark for evaluating word sense disambiguation on five high-resource languages: Chinese, German, Italian, Russian, and Spanish Campolungo et al. (2022), where the source language is English. Besides, they propose several bias evaluation metrics to compare different models (defined in Section 4.3). As shown in Figure 1(b), given English source sentence, specific word () with associated synset (), and language , set of GOOD, and BAD translation candidates include sentences that do and do not contain set of correct translation of in language , respectively. More details can be found in Campolungo et al. (2022).
3.2 Implementation Details
We use pre-trained M2M-100 12B model.666last_checkpoint:https://github.com/pytorch/fairseq/tree/main/examples/m2m_100 For quantization, we use Mean Squared Error (MSE) calibration. For weights, we use default per-channel calibration. In FLORES-101, we use SentencePiece BLEU (spBLEU) score777It uses SentencePiece tokenizer with 256K tokens and then BLEU is computed: https://github.com/facebookresearch/flores for the evaluation, as it is shown to be fair for the multilingual comparison Goyal et al. (2021b). Additionally, we use character n-gram F-score (ChrF) Popović (2015) 888sacrebleu 1.5.1 Post (2018) with ChrF3. metric to compare compressed models with M2M-100 model. We evaluate our compressed models on language pairs in which M2M-100 12B model Fan et al. (2020) has reasonable999Specifically, we choose language pairs, in which M2M-100 12B model has a spBLEU score higher than 12. More details are provided in Appendix B. performance. This leaves us with 3,763 language directions. All experiments are computed on 2 NVIDIA A100-40GB GPUs.
4 Results and Discussion
4.1 Compression Impact Across Languages
Resource Type Criterion No. Languages Very-Low 16 Low 40 Medium 38 High 7
Language Resource Type.
The true amount of available training data for a language is difficult to estimate, as it relies both on the quality and quantity of the data. Inspired by (Goyal et al., 2021b), we classify languages into four categories, based on the amount of available data to/from English. The distribution of language resource types is illustrated in Table 1.
Magnitude pruning: Sparsity Ratio () Selection.
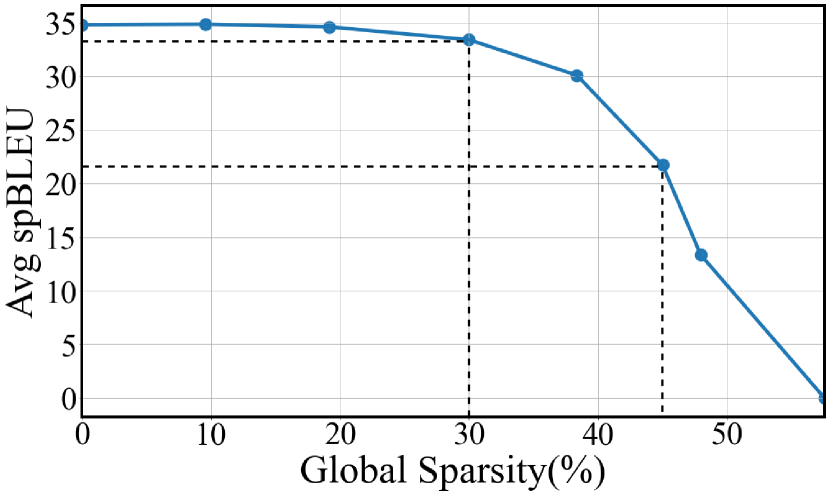
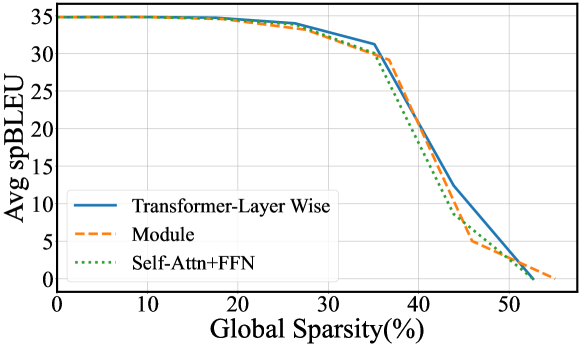
Figure 2 shows the average spBLEU score of different sparsity ratios for a subset of language pairs.101010We choose nine language pairs covering all pairwise combinations of ”low”, ”medium”, and ”high” language categories. A list of this subset is provided in Appendix C. Based on this preliminary analysis, we decide to analyze the model behavior for two sparsity ratios, which is the maximum sparsity ratio for which the compressed model mostly keeps the performance, and for which the performance starts to drop drastically. Therefore, we evaluate the pruned models on sparsity ratios of , and for further experiments.
4.1.1 Main Results
Model Memory size Avg spBLEU drop() M2M-100 1 22.44 - Pruned 30 M2M-100 0.7 20.95 6.6 Pruned 45 M2M-100 0.55 15.12 32.6 Quantized M2M-100 0.25 22.31 0.6
Table 2111111We did not report actual inference time as implementation of compression techniques is highly dependent on the device. illustrates memory footprint and spBLEU scores on FLORES-101 dataset averaged over 3.7k language pairs retained for analysis. Pruned 30 model suffers from a slight drop in performance, while quantization mostly preserves the same average spBLEU score. Both quantized and pruned 30 models reduce the memory footprint by 75 and 30, respectively. The performance of pruned model drops significantly. In what follows, we check the behavior of each language pair after compression along different criteria.
Amount of Bitext Data.
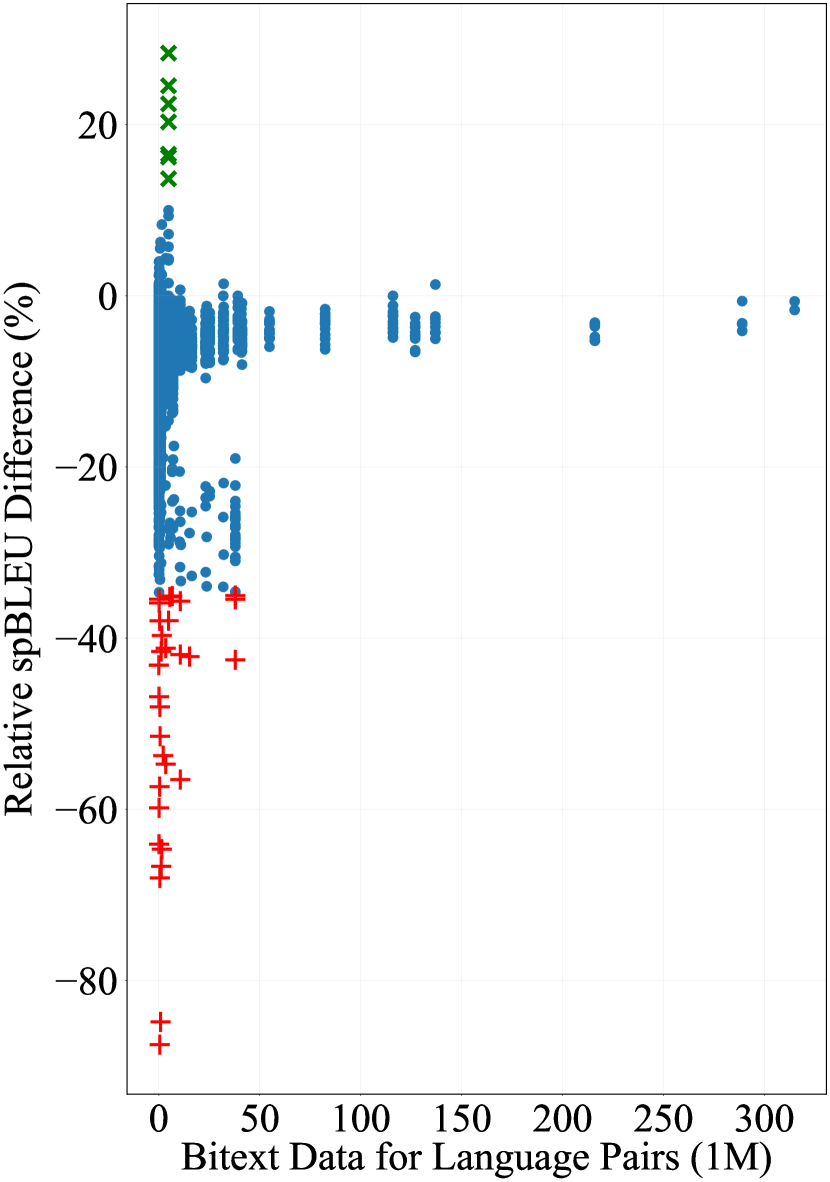
Figure 3 shows the relative spBLEU performance of compressed models for each language pair compared to the M2M-100. The X-axis corresponds to the amount of bitext data with English defined as where is the amount of Bitext data with English for language . For pruned 30 model, while the average spBLEU score drops by 6.63 (shown in Table 2), there is a subset of language pairs that drops drastically (shown as ""). Interestingly, there is a subset of language pairs that get significantly improved after compression (shown as ""). For pruned 45 model, there is also a subset of languages with more than 50 drop in performance, while the average spBLEU degradation is 32.62. For the quantized model which preserves almost the same average spBLEU, we see that there is also a set of languages suffering from a significant drop, and others being significantly improved. The behavior of compressed models in these specific language pairs is further studied in Section 4.1.2 and 4.1.3, respectively.
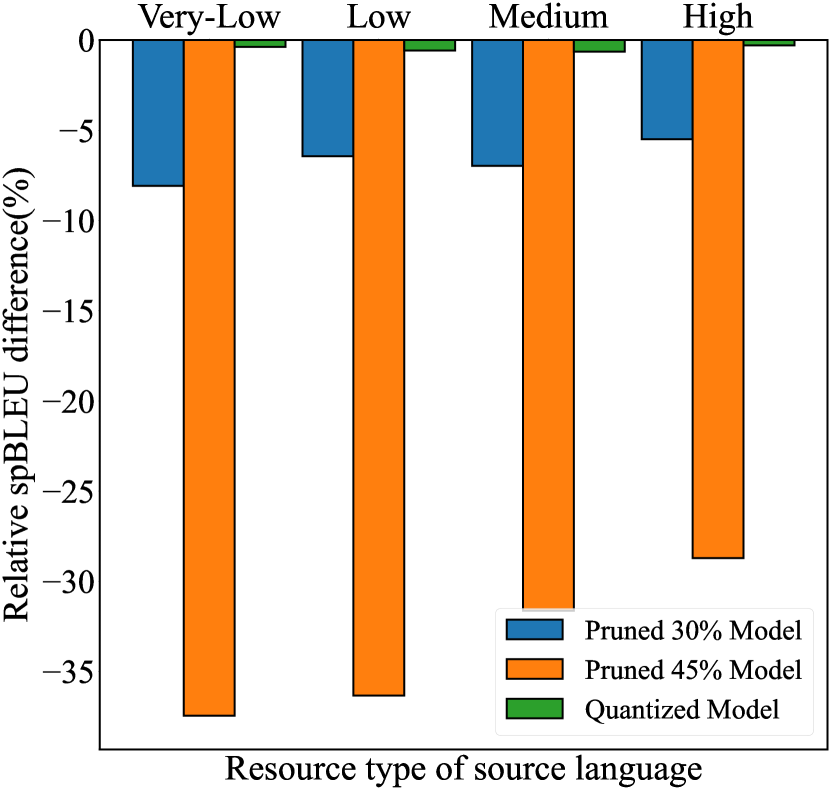
Resource Type.
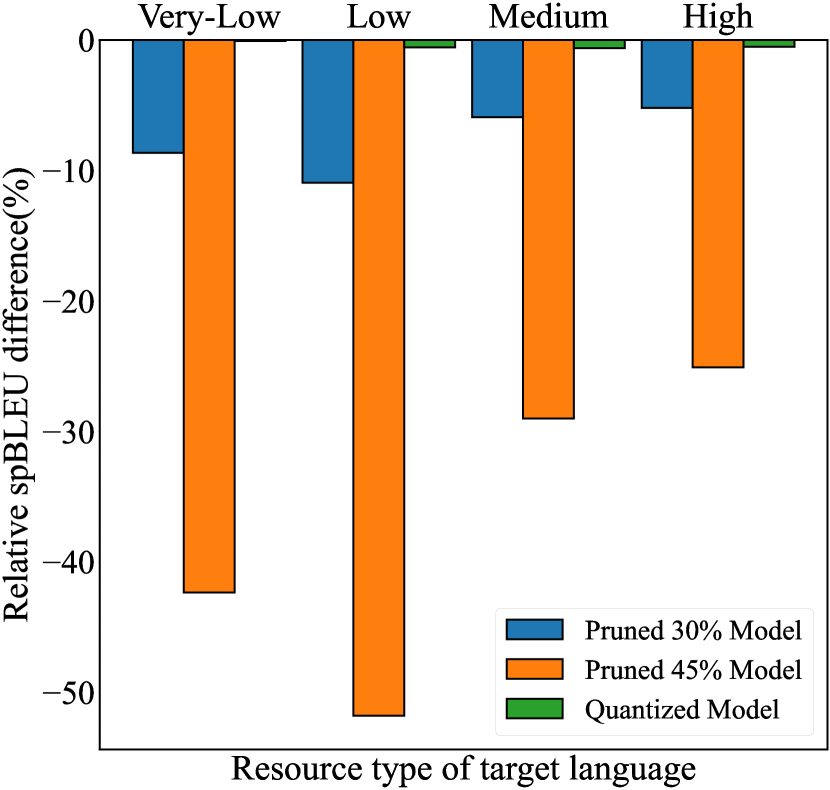
We study the performance of the compressed models based on the resource category of language pairs, which is defined as the category of for a pair . Figure 4 demonstrates the relative spBLEU drop for each category of the compressed models. For pruning 30, the relative spBLEU drop is inversely proportional to the amount of training data for different categories, which confirms that pruning disproportionately impacts the performance of under-represented language pairs, while the average performance is near to the base M2M-100 model (as shown in Table 2). For quantization, we see a much smaller decrease in all language categories. Furthermore, we show that the resource type of the target language is more crucial than the source language,121212Results are provided in Appendix D. meaning that the performance of language pairs with "low" and "very-low" target languages drops drastically after the compression.
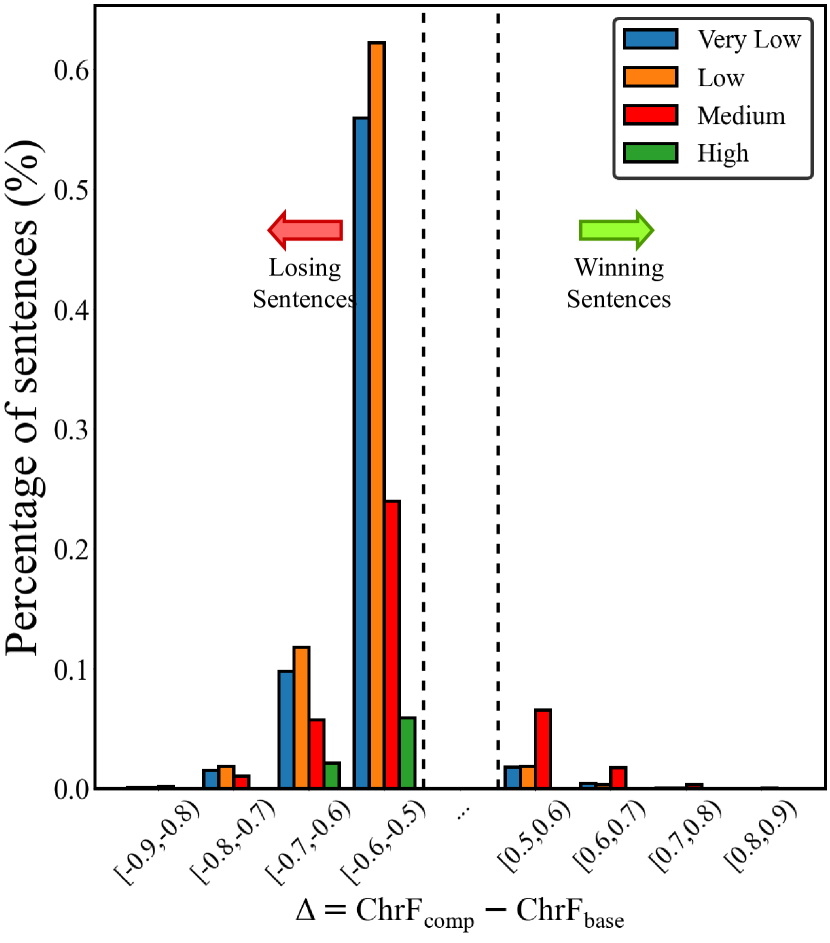
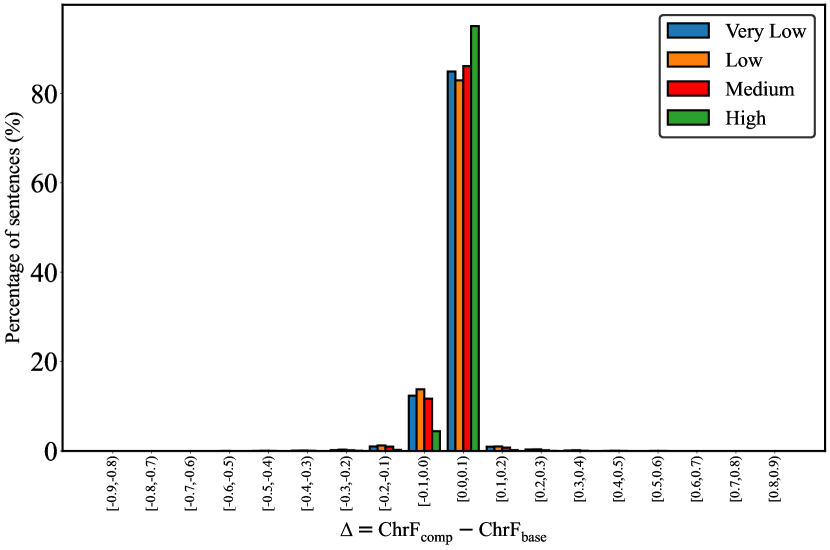
ChrF Difference.
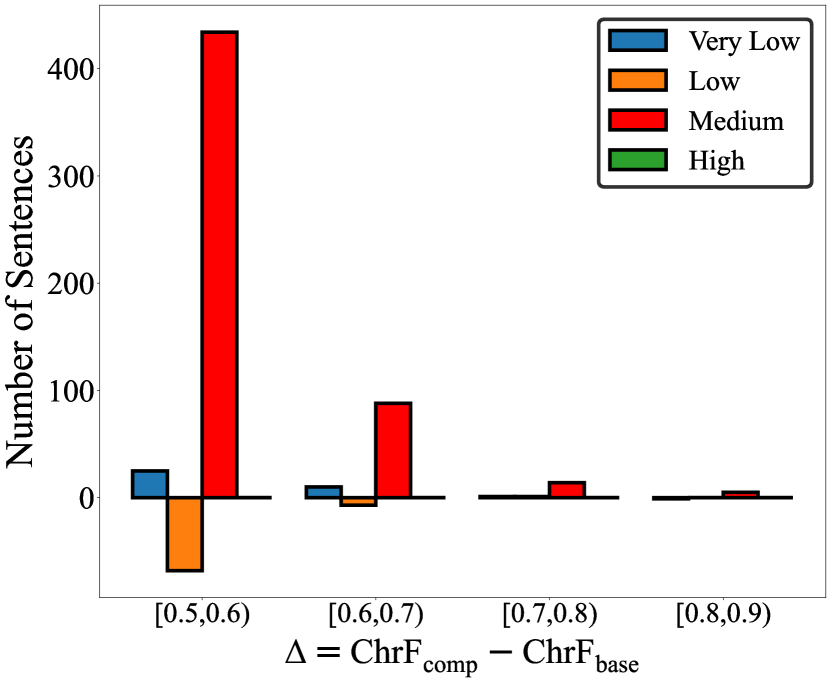
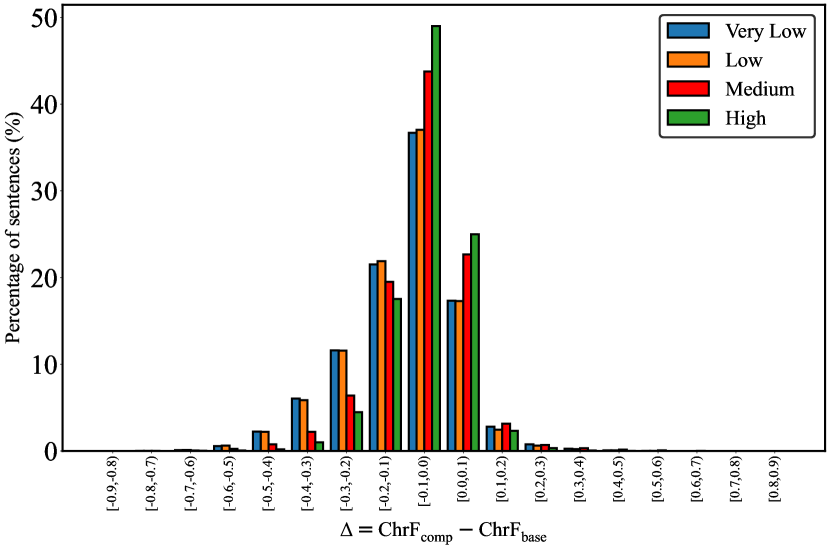
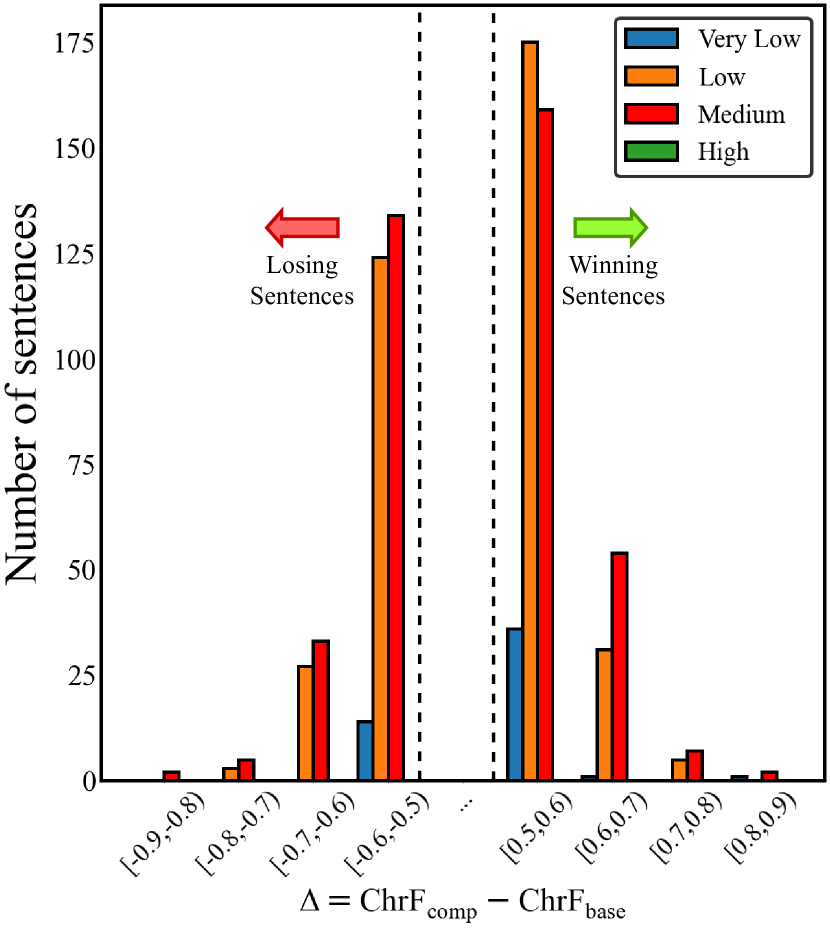
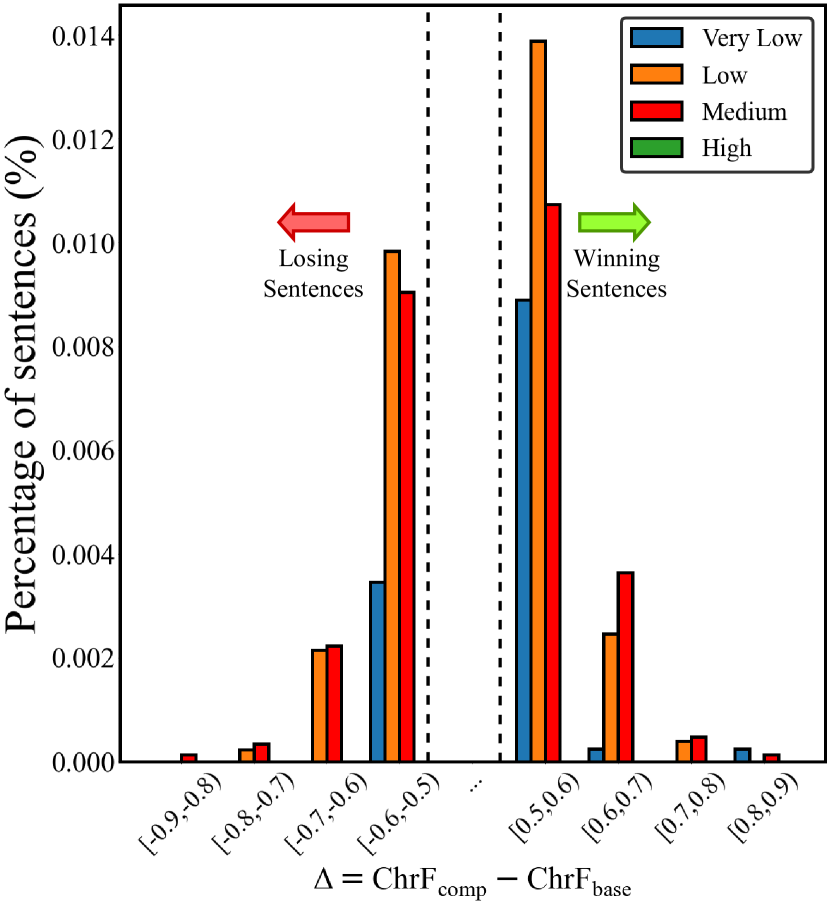
For more fine-grained analysis, we perform sentence-level ChrF Popović (2015)131313ChrF demonstrates better correlation with human judgements at sentence-level. evaluation. We define where and correspond to of compressed and baseline models, respectively. Sentences with close to zero are less impacted by compression, while those further away from zero are the most impacted (either positively or negatively) by compression. We define Losing Pairs as a set of instances where , and Winning Pairs as a set of instances where . Thus, identified samples could be seen as an adaptation of Compression-Identified Exemplars introduced by Hooker et al. (2019) for the case of translation. Figure 5141414The normalized distribution by the number of instances in each language pair category is provided in Appendix E. plots the distribution of sentences from different language pair groups along with the different bins for these two subsets. 151515Figure 5 belongs to Pruned 30 model. Complete ChrF calculation (including ) of compressed models for different bins are provided in Appendix E.
Model Off-T() base Off-T() comp Total No. Pruned 30 5.9 13.7(+7.8) 1,521 Pruned 45 6.4 30.3(+23.9) 10,314 Quantized 5.2 17.5(+12.3) 268
In the following, we comprehensively analyze the behavior of the model for Losing Pairs, and Winning Pairs.161616During the preliminary analysis we have identified languages for which M2M-100 training data contains two different scripts (e.g. Cyrillic and Latin), while FLORES-101 dataset provides one script for the evaluation. To fairly analyze the effect of compression, we exclude sentences that refer to these languages. A list of them is provided in Appendix F.
4.1.2 Analysis of Losing Pairs
As shown in Figure 5 (left side), losing pairs belong to very-low, low, and medium-resource languages, that are mostly under-represented subsets during training.171717Normalized distribution in Appendix E follows same trend. We manually inspected some of the translations from the losing pairs sets and we have identified 2 main reasons for the drop in performance which are off-target translations (translation in the wrong target language) and hallucinations. In what follows we attempt to quantify these two phenomena.
Off-Target.
We use FastText language identifier Joulin et al. (2016a, b) to predict the languages of reference and the translated sentences. Table 3 shows the total number of losing sentences and percentage of off-target translations for both baseline and compressed models.181818We exclude sentences where the predicted reference language ids are not matched with gold reference languages. As the sparsity increases, the compressed model predicts more off-target translations (7.8 and 23.9 increase from baseline). Quantization also increases the percentage of off-target translation by 12.3.
| Reference | To better represent traffic flow, relationships have been established between the three main characteristics: (1) flow, (2) density, and (3) velocity. |
| M2M-100 | To better represent the flow of traffic, relationships have been established between three main characteristics: (1) flow, (2) density, and (3) speed. |
| Compressed | It is believed to have been one of the earliest inhabitants of this place, and it is believed to be one of the oldest inhabitants of this place. |
Hallucinations.
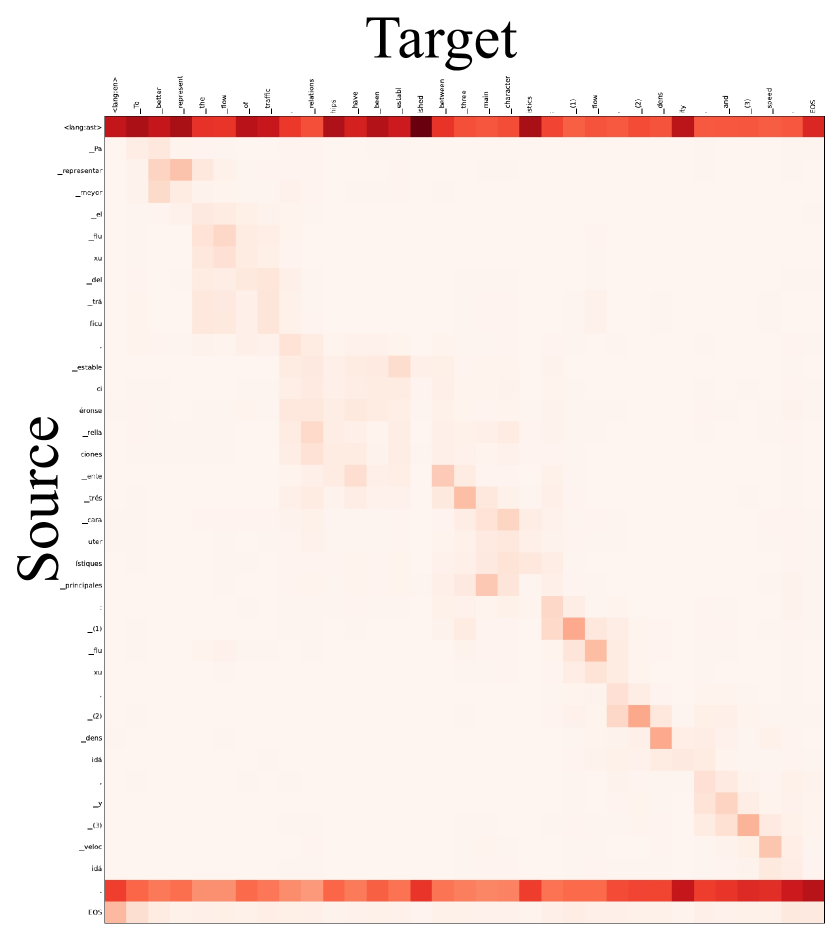
It refers to the case, in which a model generates an output unrelated to the source sentence. Lee et al. (2018) have shown that the cases of hallucinations have different cross-attention matrices. Figure 6 shows an example of cross-attention matrices for a losing sentence, where the translation of the compressed model is considered as a hallucination. As expected, translated tokens ignore the alignment with the source sequence. To quantitatively analyze the hallucination effect on all on-target losing sentences (excluding off-target translations), we define the relative alignment metric as:
| (1) | ||||
where is defined as:
| (2) |
where and correspond to sequences of source and target languages, respectively; is the attention weight, where we use the average attention over all layers and all attention heads. Inspired by Vig and Belinkov (2019); Kim et al. (2021b), the variance () is high for cases where the target sequence pays attention to a very small subset of source tokens (hallucination), while it is low when the cross-attention matrix is near to the diagonal matrix (approximation of perfect alignment matrix). Table 4 displays the relative alignment () metric for different compressed models. As the metric is higher than "1" for compressed models, it confirms that target translations of compressed models contain more hallucinated sentences. Lastly, we provide a list of the most affected language pairs in Appendix G for further studies.
Model No. On-Target sents Pruned 30 2.95 1,312 Pruned 45 3.01 7,192 Quantized 1.96 221
Model Total No. Pruned 30 M2M-100 0.42 863 Pruned 45 M2M-100 0.15 1,455 Quantized M2M-100 0.52 308
| Reference | Crossties were introduced fairly early to hold the tracks in place. Gradually, however, it was realised that tracks would be more efficient if they had a stip of iron on the top. |
| M2M-100 | Cucumbers Zucchini Summer Squash Carrots Kale Radishes Broccoli Rosemary Basil Pole Beans Peas Arugula Bibb Lettuce Cutting Lettuces Potatoes |
| Compressed | Crossbars were inserted fairly early in order to keep the tracks in place. Gradually, however, it was realized that the tracks would be more effective if there were an iron strip at the top. |
4.1.3 Analysis of Winning Pairs
When manually inspecting some examples from the translation of winning pairs, we realize that a lot of them are matching cases where the baseline model generates hallucinations, while the compressed model generates acceptable translations, as shown in Figure 7. We recall that in Figure 5, most of the winning pairs (right side) belong to medium-resource languages191919Normalized distribution in Appendix E shows the same behavior., which include a moderate amount of training instances, and could contain some poorly aligned parallel sentences. Raunak et al. (2021) connects the phenomenon of hallucination to the corpus-level noise and suggests that it could also be amplified by back-translation (used for data augmentation to training M2M-100 model). Therefore, the compression seems to remove the memorization of noisy samples, which is more important for medium-resource languages, thus fixing some of the cases of hallucination. In Table 5, we compute the total number of winning sentences, and the relative alignment metric () for compressed models and M2M-100 model. As is lower than "1", it confirms that the compression removes the noisy memorization of medium-resource languages, and benefits the generalization of the model. Ahia et al. (2021) made a similar observation in the case of bilingual MT models. Interestingly, the number of winning sentences increases as the model gets sparser (1,455 vs. 863). Figure 8 shows that new sentences mostly belong to medium-resource languages. Finally, a list of most winning language pairs is provided in Appendix G.
4.2 Gender Bias Analysis
We evaluate M2M-100 and our compressed models on MT-Gender benchmark Stanovsky et al. (2019); Kocmi et al. (2020). Inspired by Boito et al. (2022), we use a fairness metric to compare the behavior of compressed models on male and female subsets:
| (3) | ||||
where , and refer to F1 scores of male and female, respectively. if is near zero, then the model is not biased toward any gender, however, values of +1 or -1 mean that the model is highly biased toward male or female, respectively. We extend the fairness metric to pro- and anti-stereotypical subsets as follows:202020Pro-stereotypical sentences refer to samples that context and occupation match (e.g. The carpenter stopped the housekeeper and helped her.) while anti-stereotypical subset contains sentences that context and occupation do not match.:
| (4) | ||||
where , and belong to the fairness metric of pro- and anti-stereotypical sections. Intuitively, if the model has different behaviors in pro- and anti-stereotypical subsets, then it results in increasing the absolute difference of and .212121Proposed metrics are different than simple absolute score difference of Kocmi et al. (2020), more details in Appendix H.
Average fairness metrics over 10 languages are illustrated in Table 6. Increasing the sparsity ratio results in a more biased model as both and relatively increase +67.2, and +25.9. Quantization has less effect on the gender bias as both and negligibly change after applying it. Detailed results for each language are provided in Appendix I. Interestingly, pruning 30% highly increases the gender bias even for high-resource languages e.g. French and German, while spBLEU is almost the same after the compression.
Model () () Original M2M-100 17.36 16.51 Pruned 30 M2M-100 21.65 (+24.7) 19.52 (+18.25) Pruned 45 M2M-100 29.03 (+67.2) 20.8 (+25.9) Quantized M2M-100 18.24 (+5.1) 15.53 (-5.8)
4.3 Word Sense Disambiguation Benchmark
Model SFII SPDI MFS MFS+ AVG Baseline 77.6 71.6 52.8 87.6 72.4 Pruned 30 76.4 72.2 52.9 87.8 72.4 Pruned 45 80.2 74.8 53.4 87.8 74.1 Quantized 79.5 74 53.7 88.8 74
In this section, we analyze the impact of the compression on semantic biases by evaluating our models on a multilingual word sense disambiguation benchmark. We first detail metrics used in Campolungo et al. (2022) to measure semantic biases.
Notation.
Given a specific word (), is defined as (lemmatization, Part-of-Speech tag) pair. is the ordered list of synsets according to WordNet’s sense frequency Miller et al. (1990) in language . For instance, it is built as the act of firing, photograph, drink, … for noun shot in English. is the index of synset () in .
SFII
is calculated as the error rate averaged over for different positions and words . Intuitively, it measures the sensitivity of the model when predicting a sense concerning its corresponding index in .
SPDI
is computed as the average error rate based on polysemy degrees of synsets.
MFS
measures how often the model chooses more frequent senses than the correct one. Given for a synset, it is increased once the model predicts a synset () with .
MFS+.
It is similar to the MFS metric, but it increases when equals to 1.
Since metrics are based on the error rate, the lower values show that the model is less biased.
Table 7 demonstrates the semantic bias scores, averaged over all languages in DiBiMT Campolungo et al. (2022).222222Detailed results are provided in Appendix J. The last column is the average of semantic bias metrics for each model. According to the average bias score, quantized and pruned 45 models amplify the bias metric by 1.6, and 1.7 points on average, compared to M2M-100, respectively. It confirms that the compression amplifies the semantic bias while keeping almost the same BLEU performance, especially for the quantization (average BLEU scores are shown in Table 2).
5 Related Work
The first connection between compression and bias amplification has been made by Hooker et al. (2019, 2020) in the case of image classification. The same authors proposed an approach to find a subset of the dataset which contains samples that have disproportionately high errors after the compression. There is also recent work that analyzes the effect of compression on pre-trained language models Xu et al. (2021); Lauscher et al. (2021); Du et al. (2021); Ogueji et al. (2022). Notably, de Vassimon Manela et al. (2021) demonstrated a higher gender bias in compressed pre-trained language models. Concerning NMT, Renduchintala et al. (2021) demonstrated that optimization of inference speed up may result in gender bias amplification. To the best of our knowledge, this work is the first in-depth study of the impact of compression on massively multilingual models. We hope our findings would encourage further research on this topic.
6 Conclusion
We demonstrate the impacts of applying compression methods to the massively Multilingual Machine Translation models by evaluating compressed models on FLORES-101 Goyal et al. (2021b), gender bias benchmark Stanovsky et al. (2019), and word sense disambiguation benchmark Campolungo et al. (2022). We show that while average BLEU drops negligibly, the performance of under-represented language pairs drops drastically. Interestingly, sparsity improves the performance of some medium-resource language pairs by removing the noisy memorization. By evaluating our compressed models on gender bias and word sense disambiguation benchmarks, we show that the compression amplifies the intrinsic gender and semantic biases, even in high-resource language pairs. We hope our findings could be a starting point to consider the fairness aspects when compressing multilingual models.
Limitations
Our compression techniques are limited to post-training quantization, and magnitude pruning without additional fine-tuning due to the huge cost of fine-tuning these massively multilingual models, but future research could extend our analysis to compression methods with additional fine-tuning, e.g. knowledge distillation Kim and Rush (2016), training-aware pruning and quantization Behnke and Heafield (2020); Zhang et al. (2021); Yao et al. (2022). We analyze our compressed models based on the amount of available training data for each language pair, gender bias, and word sense disambiguation bias. Future research could apply our analysis to other linguistic biases in the machine translation task.
Acknowledgement
Alireza Mohammadshahi is supported by the Swiss National Science Foundation (grant number CRSII5-180320).
References
- Aharoni et al. (2019) Roee Aharoni, Melvin Johnson, and Orhan Firat. 2019. Massively multilingual neural machine translation. In Proceedings of the 2019 Conference of the North American Chapter of the Association for Computational Linguistics: Human Language Technologies, Volume 1 (Long and Short Papers), pages 3874–3884, Minneapolis, Minnesota. Association for Computational Linguistics.
- Ahia et al. (2021) Orevaoghene Ahia, Julia Kreutzer, and Sara Hooker. 2021. The low-resource double bind: An empirical study of pruning for low-resource machine translation. In Findings of the Association for Computational Linguistics: EMNLP 2021, pages 3316–3333, Punta Cana, Dominican Republic. Association for Computational Linguistics.
- Behnke and Heafield (2020) Maximiliana Behnke and Kenneth Heafield. 2020. Losing heads in the lottery: Pruning transformer attention in neural machine translation. In Proceedings of the 2020 Conference on Empirical Methods in Natural Language Processing (EMNLP), pages 2664–2674, Online. Association for Computational Linguistics.
- Bentivogli et al. (2020) Luisa Bentivogli, Beatrice Savoldi, Matteo Negri, Mattia A. Di Gangi, Roldano Cattoni, and Marco Turchi. 2020. Gender in danger? evaluating speech translation technology on the MuST-SHE corpus. In Proceedings of the 58th Annual Meeting of the Association for Computational Linguistics, pages 6923–6933, Online. Association for Computational Linguistics.
- Boito et al. (2022) Marcely Zanon Boito, Laurent Besacier, Natalia Tomashenko, and Yannick Estève. 2022. A study of gender impact in self-supervised models for speech-to-text systems.
- Bondarenko et al. (2021) Yelysei Bondarenko, Markus Nagel, and Tijmen Blankevoort. 2021. Understanding and overcoming the challenges of efficient transformer quantization. In Proceedings of the 2021 Conference on Empirical Methods in Natural Language Processing, pages 7947–7969, Online and Punta Cana, Dominican Republic. Association for Computational Linguistics.
- Brown et al. (2020) Tom Brown, Benjamin Mann, Nick Ryder, Melanie Subbiah, Jared D Kaplan, Prafulla Dhariwal, Arvind Neelakantan, Pranav Shyam, Girish Sastry, Amanda Askell, Sandhini Agarwal, Ariel Herbert-Voss, Gretchen Krueger, Tom Henighan, Rewon Child, Aditya Ramesh, Daniel Ziegler, Jeffrey Wu, Clemens Winter, Chris Hesse, Mark Chen, Eric Sigler, Mateusz Litwin, Scott Gray, Benjamin Chess, Jack Clark, Christopher Berner, Sam McCandlish, Alec Radford, Ilya Sutskever, and Dario Amodei. 2020. Language models are few-shot learners. In Advances in Neural Information Processing Systems, volume 33, pages 1877–1901. Curran Associates, Inc.
- Campolungo et al. (2022) Niccolò Campolungo, Federico Martelli, Francesco Saina, and Roberto Navigli. 2022. DiBiMT: A novel benchmark for measuring Word Sense Disambiguation biases in Machine Translation. In Proceedings of the 60th Annual Meeting of the Association for Computational Linguistics (Volume 1: Long Papers), pages 4331–4352, Dublin, Ireland. Association for Computational Linguistics.
- Dai et al. (2019) Zihang Dai, Zhilin Yang, Yiming Yang, Jaime Carbonell, Quoc Le, and Ruslan Salakhutdinov. 2019. Transformer-XL: Attentive language models beyond a fixed-length context. In Proceedings of the 57th Annual Meeting of the Association for Computational Linguistics, pages 2978–2988, Florence, Italy. Association for Computational Linguistics.
- de Vassimon Manela et al. (2021) Daniel de Vassimon Manela, David Errington, Thomas Fisher, Boris van Breugel, and Pasquale Minervini. 2021. Stereotype and skew: Quantifying gender bias in pre-trained and fine-tuned language models. In Proceedings of the 16th Conference of the European Chapter of the Association for Computational Linguistics: Main Volume, pages 2232–2242, Online. Association for Computational Linguistics.
- Devlin et al. (2019) Jacob Devlin, Ming-Wei Chang, Kenton Lee, and Kristina Toutanova. 2019. BERT: Pre-training of deep bidirectional transformers for language understanding. In Proceedings of the 2019 Conference of the North American Chapter of the Association for Computational Linguistics: Human Language Technologies, Volume 1 (Long and Short Papers), pages 4171–4186, Minneapolis, Minnesota. Association for Computational Linguistics.
- Du et al. (2021) Mengnan Du, Subhabrata Mukherjee, Yu Cheng, Milad Shokouhi, Xia Hu, and Ahmed Hassan Awadallah. 2021. What do compressed large language models forget? robustness challenges in model compression.
- El-Kishky et al. (2020) Ahmed El-Kishky, Vishrav Chaudhary, Francisco Guzmán, and Philipp Koehn. 2020. CCAligned: A massive collection of cross-lingual web-document pairs. In Proceedings of the 2020 Conference on Empirical Methods in Natural Language Processing (EMNLP), pages 5960–5969, Online. Association for Computational Linguistics.
- Fan et al. (2020) Angela Fan, Shruti Bhosale, Holger Schwenk, Zhiyi Ma, Ahmed El-Kishky, Siddharth Goyal, Mandeep Baines, Onur Celebi, Guillaume Wenzek, Vishrav Chaudhary, Naman Goyal, Tom Birch, Vitaliy Liptchinsky, Sergey Edunov, Edouard Grave, Michael Auli, and Armand Joulin. 2020. Beyond english-centric multilingual machine translation.
- Frankle and Carbin (2019) Jonathan Frankle and Michael Carbin. 2019. The lottery ticket hypothesis: Finding sparse, trainable neural networks. In International Conference on Learning Representations.
- Gale et al. (2019) Trevor Gale, Erich Elsen, and Sara Hooker. 2019. The state of sparsity in deep neural networks.
- Goyal et al. (2021a) Naman Goyal, Jingfei Du, Myle Ott, Giri Anantharaman, and Alexis Conneau. 2021a. Larger-scale transformers for multilingual masked language modeling.
- Goyal et al. (2021b) Naman Goyal, Cynthia Gao, Vishrav Chaudhary, Peng-Jen Chen, Guillaume Wenzek, Da Ju, Sanjana Krishnan, Marc’Aurelio Ranzato, Francisco Guzman, and Angela Fan. 2021b. The flores-101 evaluation benchmark for low-resource and multilingual machine translation.
- Hooker et al. (2019) Sara Hooker, Aaron Courville, Gregory Clark, Yann Dauphin, and Andrea Frome. 2019. What do compressed deep neural networks forget?
- Hooker et al. (2020) Sara Hooker, Nyalleng Moorosi, Gregory Clark, Samy Bengio, and Emily Denton. 2020. Characterising bias in compressed models.
- Joulin et al. (2016a) Armand Joulin, Edouard Grave, Piotr Bojanowski, Matthijs Douze, Hérve Jégou, and Tomas Mikolov. 2016a. Fasttext.zip: Compressing text classification models. arXiv preprint arXiv:1612.03651.
- Joulin et al. (2016b) Armand Joulin, Edouard Grave, Piotr Bojanowski, and Tomas Mikolov. 2016b. Bag of tricks for efficient text classification. arXiv preprint arXiv:1607.01759.
- Kim et al. (2021a) Sehoon Kim, Amir Gholami, Zhewei Yao, Michael W. Mahoney, and Kurt Keutzer. 2021a. I-bert: Integer-only bert quantization. In Proceedings of the 38th International Conference on Machine Learning, volume 139 of Proceedings of Machine Learning Research, pages 5506–5518. PMLR.
- Kim and Rush (2016) Yoon Kim and Alexander M. Rush. 2016. Sequence-level knowledge distillation. In Proceedings of the 2016 Conference on Empirical Methods in Natural Language Processing, pages 1317–1327, Austin, Texas. Association for Computational Linguistics.
- Kim et al. (2021b) Zae Myung Kim, Laurent Besacier, Vassilina Nikoulina, and Didier Schwab. 2021b. Do multilingual neural machine translation models contain language pair specific attention heads? In Findings of the Association for Computational Linguistics: ACL-IJCNLP 2021, pages 2832–2841, Online. Association for Computational Linguistics.
- Kocmi et al. (2020) Tom Kocmi, Tomasz Limisiewicz, and Gabriel Stanovsky. 2020. Gender coreference and bias evaluation at WMT 2020. In Proceedings of the Fifth Conference on Machine Translation, pages 357–364, Online. Association for Computational Linguistics.
- Lauscher et al. (2021) Anne Lauscher, Tobias Lueken, and Goran Glavaš. 2021. Sustainable modular debiasing of language models. In Findings of the Association for Computational Linguistics: EMNLP 2021, pages 4782–4797, Punta Cana, Dominican Republic. Association for Computational Linguistics.
- Lee et al. (2018) Chanhee Lee, Young-Bum Kim, Dongyub Lee, and Heuiseok Lim. 2018. Character-level feature extraction with densely connected networks. In Proceedings of the 27th International Conference on Computational Linguistics, pages 3228–3239, Santa Fe, New Mexico, USA. Association for Computational Linguistics.
- Li et al. (2020) Bei Li, Ziyang Wang, Hui Liu, Quan Du, Tong Xiao, Chunliang Zhang, and Jingbo Zhu. 2020. Learning light-weight translation models from deep transformer.
- Liang et al. (2021) Tailin Liang, John Glossner, Lei Wang, Shaobo Shi, and Xiaotong Zhang. 2021. Pruning and quantization for deep neural network acceleration: A survey.
- Menghani (2021) Gaurav Menghani. 2021. Efficient deep learning: A survey on making deep learning models smaller, faster, and better.
- Michael H. Zhu (2018) Suyog Gupta Michael H. Zhu. 2018. To prune, or not to prune: Exploring the efficacy of pruning for model compression.
- Miller et al. (1990) George A. Miller, Richard Beckwith, Christiane Fellbaum, Derek Gross, and Katherine J. Miller. 1990. Introduction to WordNet: An On-line Lexical Database*. International Journal of Lexicography, 3(4):235–244.
- Ogueji et al. (2022) Kelechi Ogueji, Orevaoghene Ahia, Gbemileke Onilude, Sebastian Gehrmann, Sara Hooker, and Julia Kreutzer. 2022. Intriguing properties of compression on multilingual models.
- Patterson et al. (2021) David Patterson, Joseph Gonzalez, Quoc Le, Chen Liang, Lluis-Miquel Munguia, Daniel Rothchild, David So, Maud Texier, and Jeff Dean. 2021. Carbon emissions and large neural network training.
- Popović (2015) Maja Popović. 2015. chrF: character n-gram f-score for automatic MT evaluation. In Proceedings of the Tenth Workshop on Statistical Machine Translation, pages 392–395, Lisbon, Portugal. Association for Computational Linguistics.
- Post (2018) Matt Post. 2018. A call for clarity in reporting BLEU scores. In Proceedings of the Third Conference on Machine Translation: Research Papers, pages 186–191, Belgium, Brussels. Association for Computational Linguistics.
- Raunak et al. (2021) Vikas Raunak, Arul Menezes, and Marcin Junczys-Dowmunt. 2021. The curious case of hallucinations in neural machine translation. In Proceedings of the 2021 Conference of the North American Chapter of the Association for Computational Linguistics: Human Language Technologies, pages 1172–1183, Online. Association for Computational Linguistics.
- Renduchintala et al. (2021) Adithya Renduchintala, Denise Diaz, Kenneth Heafield, Xian Li, and Mona Diab. 2021. Gender bias amplification during speed-quality optimization in neural machine translation. In Proceedings of the 59th Annual Meeting of the Association for Computational Linguistics and the 11th International Joint Conference on Natural Language Processing (Volume 2: Short Papers), pages 99–109, Online. Association for Computational Linguistics.
- Sanh et al. (2019) Victor Sanh, Lysandre Debut, Julien Chaumond, and Thomas Wolf. 2019. Distilbert, a distilled version of bert: smaller, faster, cheaper and lighter.
- Savoldi et al. (2022) Beatrice Savoldi, Marco Gaido, Luisa Bentivogli, Matteo Negri, and Marco Turchi. 2022. Under the morphosyntactic lens: A multifaceted evaluation of gender bias in speech translation. In Proceedings of the 60th Annual Meeting of the Association for Computational Linguistics (Volume 1: Long Papers), pages 1807–1824, Dublin, Ireland. Association for Computational Linguistics.
- Schwenk et al. (2021) Holger Schwenk, Guillaume Wenzek, Sergey Edunov, Edouard Grave, Armand Joulin, and Angela Fan. 2021. CCMatrix: Mining billions of high-quality parallel sentences on the web. In Proceedings of the 59th Annual Meeting of the Association for Computational Linguistics and the 11th International Joint Conference on Natural Language Processing (Volume 1: Long Papers), pages 6490–6500, Online. Association for Computational Linguistics.
- Stanovsky et al. (2019) Gabriel Stanovsky, Noah A. Smith, and Luke Zettlemoyer. 2019. Evaluating gender bias in machine translation. In Proceedings of the 57th Annual Meeting of the Association for Computational Linguistics, pages 1679–1684, Florence, Italy. Association for Computational Linguistics.
- Strubell et al. (2019) Emma Strubell, Ananya Ganesh, and Andrew McCallum. 2019. Energy and policy considerations for deep learning in NLP. In Proceedings of the 57th Annual Meeting of the Association for Computational Linguistics, pages 3645–3650, Florence, Italy. Association for Computational Linguistics.
- Tang et al. (2020) Yuqing Tang, Chau Tran, Xian Li, Peng-Jen Chen, Naman Goyal, Vishrav Chaudhary, Jiatao Gu, and Angela Fan. 2020. Multilingual translation with extensible multilingual pretraining and finetuning.
- Tao et al. (2022) Chaofan Tao, Lu Hou, Wei Zhang, Lifeng Shang, Xin Jiang, Qun Liu, Ping Luo, and Ngai Wong. 2022. Compression of generative pre-trained language models via quantization.
- Vaswani et al. (2017) Ashish Vaswani, Noam Shazeer, Niki Parmar, Jakob Uszkoreit, Llion Jones, Aidan N Gomez, Ł ukasz Kaiser, and Illia Polosukhin. 2017. Attention is all you need. In Advances in Neural Information Processing Systems, volume 30. Curran Associates, Inc.
- Vig and Belinkov (2019) Jesse Vig and Yonatan Belinkov. 2019. Analyzing the structure of attention in a transformer language model. In Proceedings of the 2019 ACL Workshop BlackboxNLP: Analyzing and Interpreting Neural Networks for NLP, pages 63–76, Florence, Italy. Association for Computational Linguistics.
- Wang et al. (2021) Fusheng Wang, Jianhao Yan, Fandong Meng, and Jie Zhou. 2021. Selective knowledge distillation for neural machine translation. In Proceedings of the 59th Annual Meeting of the Association for Computational Linguistics and the 11th International Joint Conference on Natural Language Processing (Volume 1: Long Papers), pages 6456–6466, Online. Association for Computational Linguistics.
- Wang et al. (2022) Hongyu Wang, Shuming Ma, Li Dong, Shaohan Huang, Dongdong Zhang, and Furu Wei. 2022. Deepnet: Scaling transformers to 1,000 layers.
- Wei et al. (2022) Xiuying Wei, Ruihao Gong, Yuhang Li, Xianglong Liu, and Fengwei Yu. 2022. Qdrop: Randomly dropping quantization for extremely low-bit post-training quantization.
- Wu et al. (2020) Hao Wu, Patrick Judd, Xiaojie Zhang, Mikhail Isaev, and Paulius Micikevicius. 2020. Integer quantization for deep learning inference: Principles and empirical evaluation.
- Xu et al. (2021) Canwen Xu, Wangchunshu Zhou, Tao Ge, Ke Xu, Julian McAuley, and Furu Wei. 2021. Beyond preserved accuracy: Evaluating loyalty and robustness of BERT compression. In Proceedings of the 2021 Conference on Empirical Methods in Natural Language Processing, pages 10653–10659, Online and Punta Cana, Dominican Republic. Association for Computational Linguistics.
- Xu et al. (2018) Chen Xu, Jianqiang Yao, Zhouchen Lin, Wenwu Ou, Yuanbin Cao, Zhirong Wang, and Hongbin Zha. 2018. Alternating multi-bit quantization for recurrent neural networks.
- Yang et al. (2019) Zhilin Yang, Zihang Dai, Yiming Yang, Jaime Carbonell, Russ R Salakhutdinov, and Quoc V Le. 2019. Xlnet: Generalized autoregressive pretraining for language understanding. In Advances in Neural Information Processing Systems, volume 32. Curran Associates, Inc.
- Yang et al. (2022) Ziqing Yang, Yiming Cui, and Zhigang Chen. 2022. Textpruner: A model pruning toolkit for pre-trained language models.
- Yao et al. (2022) Zhewei Yao, Reza Yazdani Aminabadi, Minjia Zhang, Xiaoxia Wu, Conglong Li, and Yuxiong He. 2022. Zeroquant: Efficient and affordable post-training quantization for large-scale transformers.
- Zhang et al. (2020) Biao Zhang, Philip Williams, Ivan Titov, and Rico Sennrich. 2020. Improving massively multilingual neural machine translation and zero-shot translation. In Proceedings of the 58th Annual Meeting of the Association for Computational Linguistics, pages 1628–1639, Online. Association for Computational Linguistics.
- Zhang et al. (2022) Susan Zhang, Stephen Roller, Naman Goyal, Mikel Artetxe, Moya Chen, Shuohui Chen, Christopher Dewan, Mona Diab, Xian Li, Xi Victoria Lin, Todor Mihaylov, Myle Ott, Sam Shleifer, Kurt Shuster, Daniel Simig, Punit Singh Koura, Anjali Sridhar, Tianlu Wang, and Luke Zettlemoyer. 2022. Opt: Open pre-trained transformer language models.
- Zhang et al. (2021) Tianfu Zhang, Heyan Huang, Chong Feng, and Longbing Cao. 2021. Enlivening redundant heads in multi-head self-attention for machine translation. In Proceedings of the 2021 Conference on Empirical Methods in Natural Language Processing, pages 3238–3248, Online and Punta Cana, Dominican Republic. Association for Computational Linguistics.
Appendix A Magnitude Pruning Strategy
Figure 9 shows the performance of pruned models with different pruning strategies. Results illustrate that pruning based on Transformer-layer is slightly better than pruning based on each module of the model, and separate pruning for self-attention and feed-forward Transformer layers.
Appendix B Selection of Language Pairs in FLORES-101
Figure 10 shows the distribution of different language pair categories (defined in Table 1) based on spBLEU score of M2M-100 12B model Fan et al. (2020). We use 12 spBLEU as the threshold, which is approximately the average score over the median of different language pair categories.
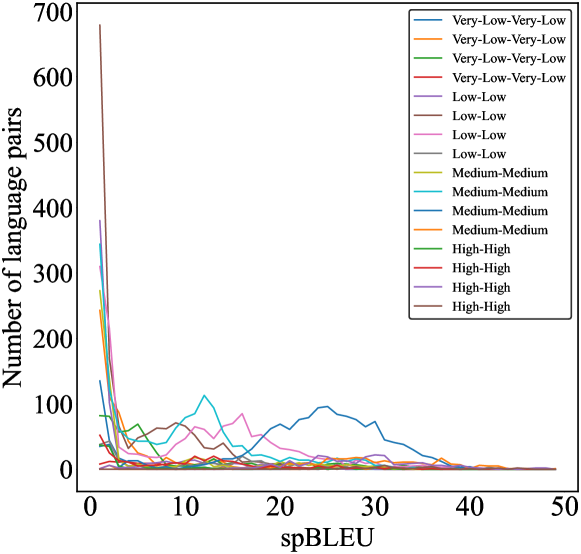
Table 8 illustrates the number of language pairs in each category after the filtering.
Very-Low Low Medium High Very-Low 10 51 157 33 Low 58 164 643 143 Medium 108 440 1,277 257 High 23 103 252 39
Appendix C Language Pairs for Selection of Sparsity Ratio
Language Pair Resource-Type M2M-100 spBLEU Bosnian-Afrikaans low-to-low 29.9 Afrikaans-Bulgarian low-to-medium 37.3 Afrikaans-French low-to-high 41.5 Catalan-Asturian medium-to-low 29.7 Danish-Bulgarian medium-to-medium 37.8 Swedish-Spanish medium-to-high 27.5 French-Afrikaans high-to-low 30.9 Spanish-Swedish high-to-medium 27.5 English-French high-to-high 51.3
Appendix D Relative spBLEU based on Resource Type of Target and Source
Appendix E ChrF Difference Analysis
E.A Pruned 30 Model
E.B Pruned 45 Model
E.C Quantized Model
Appendix F Languages with Two Scripts in M2M-100 Training
ISO Language sr Serbian cy Welsh az Azerbaijani uz Uzbek ja Japanese bn Bengali lo Lao zh Chinese
Appendix G Most Affected Language Pairs After Compression
Language pairs are selected, if both quantization and pruning have significant effect on them (based on spBLEU performance shown in Figure 3).
Source Target Catalan Cebuano Latvian Igbo Arabic Igbo Danish Xhosa French Zulu
Source Target Latvian Vietnamese Bulgarian Latvian Arabic Urdu Thai Vietnamese Latvian Italian
Appendix H Proposed Metrics for MT-Gender Benchmark
Equation 3 considers the range of F1 scores for female and male subsets, while the simple difference between F1 scores does not reflect the range of F1 scores. The range is crucial since a model with the same F1 score difference but higher individual F1 scores should have a lower fairness score, as lied in Equation 3.
We also believe equation 4 is a better metric than the simple difference between accuracies of the model in pro-stereotypical and anti-stereotypical subsets since it again considers the range of scores, and ignores missed translations and wrongly aligned genders. Additionally, it exactly reflects the difference in the behavior of the model in these two subsets. If the compressed model has a contrary performance in pro- and anti-stereotypical subsets, e.g. amplifying the bias in the anti-stereotypical subset more than the pro-stereotypical one or decreasing the bias more in one subset, then becomes higher. We suggest using Equation 3 and Equation 4 for comparing models on MT-Gender benchmark Stanovsky et al. (2019); Kocmi et al. (2020).
Appendix I MT-Gender Results per Language
Model () () Original M2M-100 21.01 15.09 Pruned 30 M2M-100 20.71 16.87 Pruned 45 M2M-100 28.58 17.33 Quantized M2M-100 18.07 12.55
Model () () Original M2M-100 39.02 11.39 Pruned 30 M2M-100 45.19 7.15 Pruned 45 M2M-100 45.56 18.54 Quantized M2M-100 40.93 2.54
Model () () Original M2M-100 7.98 20.09 Pruned 30 M2M-100 10.38 16.30 Pruned 45 M2M-100 8.89 2.75 Quantized M2M-100 10.39 21.26
Model () () Original M2M-100 29.06 3.93 Pruned 30 M2M-100 29.10 2.30 Pruned 45 M2M-100 30.28 8.08 Quantized M2M-100 32.65 8.74
Model () () Original M2M-100 22.46 2.03 Pruned 30 M2M-100 30.17 13.81 Pruned 45 M2M-100 48.59 4.61 Quantized M2M-100 24.71 2.6
Model () () Original M2M-100 13.86 28.71 Pruned 30 M2M-100 29.03 40.20 Pruned 45 M2M-100 38.44 32.83 Quantized M2M-100 15.43 25.86
Model () () Original M2M-100 5.77 15.72 Pruned 30 M2M-100 4.89 14.62 Pruned 45 M2M-100 22.53 34.01 Quantized M2M-100 6.01 15.11
Model () () Original M2M-100 6.48 16.93 Pruned 30 M2M-100 13.16 26.83 Pruned 45 M2M-100 22.14 18.12 Quantized M2M-100 6.23 14.96
Model () () Original M2M-100 18.20 39.01 Pruned 30 M2M-100 21.82 42.60 Pruned 45 M2M-100 25.95 45.01 Quantized M2M-100 18.24 38.42
Model () () Original M2M-100 7.91 12.14 Pruned 30 M2M-100 11.65 14.43 Pruned 45 M2M-100 19.31 27.23 Quantized M2M-100 9.78 13.26
Appendix J Detailed DiBiMT Results
Model SFII SPDI MFS MFS+ Avg Original M2M-100 89.14 80.59 41.8 92.59 76.03 Pruned 30 M2M-100 87.32 80.56 39.55 93.04 75.11 Pruned 45 M2M-100 86.78 82.9 39.93 92.41 75.50 Quantized M2M-100 88.86 81.26 43.32 92.51 76.48
Model SFII SPDI MFS MFS+ Avg Original M2M-100 80 71.61 60.63 89.76 75.5 Pruned 30 M2M-100 78.96 73.79 61.44 88.56 75.68 Pruned 45 M2M-100 81.28 77.05 62.5 91.67 78.12 Quantized M2M-100 82.32 74.42 61.07 91.22 77.25
Model SFII SPDI MFS MFS+ Avg Original M2M-100 75.99 70.53 61.23 88.41 74.04 Pruned 30 M2M-100 75.91 71.86 60.92 87.74 74.10 Pruned 45 M2M-100 83.38 75.08 62.22 86.67 76.83 Quantized M2M-100 81.73 75.81 63.33 88.33 77.3
Model SFII SPDI MFS MFS+ Avg Original M2M-100 68.16 66.42 47.06 83.82 66.36 Pruned 30 M2M-100 68.2 64.73 48.21 87.18 67.08 Pruned 45 M2M-100 70.92 66.41 50 85.29 68.15 Quantized M2M-100 68.16 69.03 44.19 86.51 66.97
Model SFII SPDI MFS MFS+ Avg Original M2M-100 75.08 68.92 53.44 83.61 70.26 Pruned 30 M2M-100 71.58 70.26 54.58 82.71 69.78 Pruned 45 M2M-100 78.39 72.46 52.33 83.15 71.58 Quantized M2M-100 76.45 69.72 56.88 85.63 72.17