Formation of Mass-gap Black Holes from Neutron Star X-ray Binaries with Super-Eddington Accretion
Abstract
Electromagnetic and gravitational wave observations indicate that there is dearth of compact objects with mass . This so-called “mass gap” may be linked to the supernova explosion mechanisms that produce neutron stars (NSs) and black holes (BHs). However, the existence of a few mass-gap compact objects, some of which have been confirmed to be BHs, poses a challenge to the traditional theory of black hole formation. In this work we investigate the possible formation channel of BHs from accretion-induced collapse (AIC) of NSs in X-ray binaries. In particular, we consider the influence of super-Eddington accretion of NSs. Recent observations of ultraluminous X-ray pulsars suggest that their apparent luminosities may reflect the true accretion luminosities of the accreting NSs, even exceeding the Eddington limit by a factor of . Thus, NSs accreting at a super-Eddington accretion rate may rapidly grow into BHs in intermediate/low-mass X-ray binaries. Based on the super-Eddington accretion disk models, we have investigated the evolution of NSs in intermediate/low-mass X-ray binaries by combining binary population synthesis and detailed stellar evolutionary calculations. We show that super-Eddington accretion plays a critical role in mass growth of NSs, and the final masses of the descendant BHs are heavily dependent on the NS magnetic fields, the metallicity of the donor star, and the bifurcation period of the binaries. AIC of NSs may account for some of the observed mass-gap BHs like GRO J0422+32. We also present the parameter distributions of the potential mass-gap BHs in a Milky Way-like galaxy, and point out that future space-based gravitational wave observations may provide important test of or constraints on the formation of mass-gap BHs from the AIC channel.
keywords:
X-rays: binaries – stars: black holes – stars: formation – stars: evolution – gravitational waves1 Introduction
Compact objects (COs) including white dwarfs (WDs), neutron stars (NSs) and black holes (BHs) are the end products of stellar evolution. Considering the initial mass function of stars in the Galaxy, it was traditionally expected a continuous mass function covering all types of COs. However, this intuition seems to be inconsistent with the fact that there is dearth of observed COs with mass (Bailyn et al., 1998; Özel et al., 2010; Farr et al., 2011). Recent electromagnetic observations of Galactic NSs suggest a likely maximum mass of . For example, Cromartie et al. (2020) measured the mass of the millisecond pulsar J0740+6620 to be using relativistic Shapiro delay observations, which was later updated to be (Farr & Chatziioannou, 2020). Kandel & Romani (2020) reported a black widow binary system PSR J1959+2048 with the NS mass , and a redback binary system PSR J2215+5135 with the NS mass (see also Linares et al. 2018). On the other hand, the minimal mass of BHs in X-ray binaries (XRBs) was inferred to be (Casares & Jonker, 2014).
The origin of the mass gap111Here the ‘mass gap’ refers to the lower mass gap () between the most massive NSs and the lightest BHs rather than the (upper) pair-instability mass gap for BHs (, e.g., Woosley & Heger 2021). may be related to the supernova (SN) explosion mechanisms. For example, the rapid and delayed SN models in Fryer et al. (2012) differ in the growth timescales of the instabilities driving the explosion of massive stars. While the rapid SN model can reproduce the mass gap, the delayed model predicts the mass gap to be populated (Belczynski et al., 2012).
However, recent multi-messenger observations indicate that the mass gap is at least partly populated. According to Kreidberg et al. (2012), the BHs in two XRBs (4U1543-47 and GRO J0422+32) may be less massive than , suggesting that the absence of low-mass BHs could be due to a potential observational artifact caused by the systematic uncertainties affecting ellipsoidal fits and hence inclination measurements. Microlensing observations also suggest that the mass distribution of dark lenses is consistent with a continuous distribution of stellar-remnants, and a mass gap between the NS and BH masses is not favored (Wyrzykowski & Mandel 2020, see however Mróz & Wyrzykowski 2021). Using the radial velocity and photometric variability data, Thompson et al. (2019) reported the discovery of a non-interacting low-mass BH (or an unexpectedly massive NS) with mass accompanied by a giant star (2MASS J05215658+4359220). Observations of the gravitational wave (GW) event GW190814 revealed a mass-gap CO of mass and a BH of mass (Abbott et al., 2020). Most recently, The LIGO Scientific Collaboration et al. (2021) reported another mass-gap CO with mass in GW200210_092254 during the third observing run of the advanced LIGO and the advanced Virgo. Although the existence of the mass gap is still controversial, it is commonly accepted that there are relatively few low-mass () BHs.
In addition to the stellar collapse channel, NSs and BHs can form from accretion-induced collapse (AIC) and merger-induced collapse in interacting binaries (e.g., Ivanova et al., 2008; Ablimit et al., 2021). In the AIC channel, a WD/NS accretes material from its donor star and grows in mass until a critical mass is reached, when the degenerate pressure cannot support the star against gravity, and the WD/NS collapses to be an NS/BH (Nomoto & Kondo, 1991; Timmes et al., 1996; Ivanova & Taam, 2004; Wang & Liu, 2020). Similar processes may take place in the active galactic nucleus disks where NSs/WDs embed (e.g., Perna et al., 2021; Zhu et al., 2021). In this work, we focus on the evolution of isolated interacting binaries consisting of an NS and the related AIC process. Since a NS needs to accrete at least to collapse to a be BH, AIC can only take place in intermediate/low-mass X-ray binaries (I/LMXBs), in which the donor mass and mass transfer proceeds via Roche-lobe overflow (RLOF) on a timescale . In high-mass X-ray binaries (HMXBs) in which the donor mass , the mass transfer is dynamically unstable with a duration too short to allow efficient mass accretion (Tauris & van den Heuvel, 2006).
There are LMXBs in the Galaxy and their orbital periods are relatively short, typically (Liu et al., 2007). This means that most LMXBs have experienced common envelope evolution (CEE, Paczynski, 1976; Ivanova et al., 2013). A more massive secondary star (i.e., the donor star) usually has more kinetic energy to expel the envelope of the primary star (i.e., the progenitor of the NS) during the spiral-in process, and is more likely to survive CEE. Thus, IMXBs have a much higher birthrate than LMXBs, and they will become LMXBs when the donor mass decreases to be . This has led to the suggestion that most LMXBs have actually evolved from IMXBs (Pfahl et al., 2003).
The accretion rate for an NS in I/LMXBs is conventionally thought to be limited by the Eddington accretion rate ( for a NS). However, super-Eddington accretion has been suggested both observationally and theoretically. Ultraluminous X-ray sources (ULXs; for recent reviews, see Kaaret et al., 2017; Fabrika et al., 2021) are off-nuclear point-like X-ray sources with inferred isotropic luminosities , which significantly exceed the Eddington limit luminosity () for a NS. The discovery of pulsations in ULX M82 X-2 indicates that it is powered by an accreting NS rather than a BH (Bachetti et al., 2014), and its X-ray luminosity can reach . Subsequently, quite a few ULX pulsars have been discovered, including NGC5907 ULX-1 (Israel et al., 2017a), M51 ULX-7 (Rodríguez Castillo et al., 2020), NGC7793 P13 (Fürst et al., 2016, 2018; Israel et al., 2017b), NGC300 ULX-1 (Carpano et al., 2018), SMC X-3 (Tsygankov et al., 2016; Townsend et al., 2017), NGC2403 ULX (Trudolyubov et al., 2007), Swift J0234.6+6124 (Doroshenko et al., 2018; van den Eijnden et al., 2018) and RX J0209.6-7427 (Chandra et al., 2020). The reasons why an NS can produce such a high luminosity are still under debate. Some authors (King et al., 2017; Middleton & King, 2017; King & Lasota, 2019, 2020) suggest that the ULX radiation is strongly anisotropic and the apparent luminosity is amplified with a beaming factor , while others (Dall’Osso et al., 2015; Eksi et al., 2015; Mushtukov et al., 2015, 2017, 2019; Chashkina et al., 2019) argue that the apparent luminosity of the ULX pulsars should be close to their true luminosity (i.e., ), because the observed sinusoidal pulse profiles in M82 X-2, NGC5907 ULX-1 and NGC77893 P13 do not favor a strong beaming. Mushtukov et al. (2021) used Monte–Carlo simulations to trace the photon emission from the NS ULXs and pointed out that strong beaming is inconsistent with the observations of a large pulsed fraction.
Kuranov et al. (2020) investigated the properties of NS ULXs with a binary population synthesis (BPS) method, and showed that the observed populations of NS ULXs in spiral galaxies can be explained without assuming any strong beaming effects. In this work, we explore under what circumstance can super-Eddington accretion produce mass-gap BHs in I/LMXBs and the properties of the descending BH binaries. This paper is organized as follows. We describe our method of BPS and detailed evolutionary calculations of I/LMXBs in Section 2. In Section 3, we demonstrate the properties of the BH binaries from the combination of BPS and evolutionary tracks. Finally, we discuss the uncertainties in our work and give a brief summary in Section 4.
2 Methods and Calculations
We use the BPS code BSE developed by Hurley et al. (2002) and modified by Kiel & Hurley (2006) and Shao & Li (2014) to follow the formation of incipient NS I/LMXBs. We briefly list the input parameters and the key factors in our model as follows.
We use a Monte–Carlo method to evolve primordial binaries, assuming a constant star formation rate (Smith et al., 1978) in the past . For the initial parameters of the binaries, we randomly draw them from their independent probability distribution functions. The initial mass of the primary is distributed in the range of , following the initial mass function of Kroupa et al. (1993). We assume a uniform distribution of the mass ratio between the secondary and primary masses in the range of . For the metallicity we consider both (case 1) and (case 2). The initial orbital separation is assumed to follow a logarithmically uniform distribution in the range of . We assume the eccentricity of all the primordial binaries to be zero, as its effect on the evolution of I/LMXBs is minor (Hurley et al. 2002).
We use the numerically calculated critical mass ratio in Shao & Li (2014) to determine whether the mass transfer in the primordial binaries is dynamically stable, and adopt the values of in the rotation-dependent model which can reproduce the observed properties of Be/XRBs (for a review of Be/XRBs, see Reig, 2011). In this model mass transfer becomes highly non-conservative when the accreting secondary reaches critical rotation.
If the mass transfer is unstable, we use the energy conversation equation (Webbink, 1984) to treat the CEE. We take , where is the CEE efficiency defined as the fraction of the available orbital energy that can be used to eject the common envelope. For the binding energy parameter of the primary’s envelope, we use the values calculated by Xu & Li (2010) and modified by Wang et al. (2016) for a range of massive and intermediate-mass stars under different evolutionary stages.
We adopt the criterion in Fryer et al. (2012) to discriminate core-collapse supernovae (CCSNe) from electron-capture supernovae (ECSNe), and their rapid supernova mechanism for the NS formation. The natal kick velocity of newborn NSs obeys a Maxwellian distribution with the dispersion (Hobbs et al., 2005) and (Dessart et al., 2006) for CCSNe and ECSNe, respectively.
2.1 Formation of incipient NS I/LMXBs
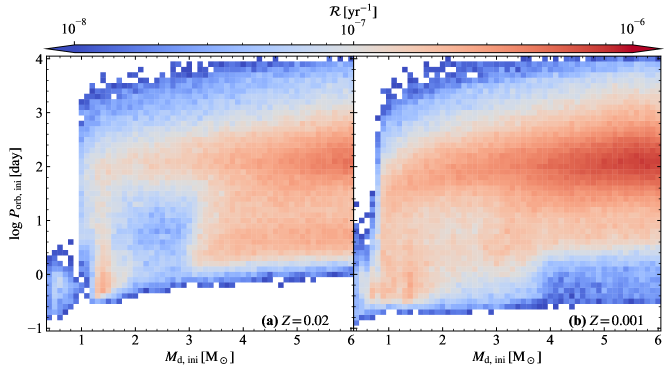
We select the incipient NS I/LMXBs with the periods and the donor/companion mass at the birth of the NS. The total birthrates of the incipient NS I/LMXBs are estimated to be and for cases 1 and 2, respectively. Low metallicity stars have shorter nuclear lifetime which allows them to have more chances to interact with their companions in a relatively wide orbit (Hurley et al., 2002). In addition, they suffer less wind mass loss, leading to less increase in orbital separation previous to CEE, which also makes the binaries more likely to interact in a closer orbit (Kiel & Hurley, 2006). Thus, the birthrate of the NS I/LMXBs in case 2 is slightly higher than in case 1. In Figure 1, we use different colors to represent the birthrate of incipient I/LMXBs in the the donor mass-orbital period (-) plane. There is almost no binary with and for the reason that neither magnetic braking nor the stellar evolution can trigger RLOF within .
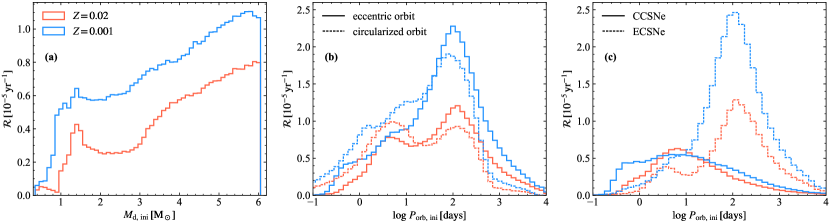
Figure 2 demonstrates the birthrate of the incipient I/LMXBs as a function of the donor mass (panel a) and the orbital period (panels b and c). The red and blue curves correspond to cases 1 and 2, respectively. Panel (a) shows that the birthrate of incipient I/LMXBs generally increases with the donor mass, because binaries with lower-mass companions are more likely to merge during the CEE (Pfahl et al., 2003). After the SN explosions the binary orbits become eccentric because of mass loss and the kicks imparted on the NSs. We assume that orbits are quickly circularized due to tidal torques and in this process the orbital angular moment is conserved. The circularized orbital period , where and are the orbital period and eccentricity after the SN explosion, respectively. In panel (b), the solid and dashed lines represent the eccentric and circularized orbits, respectively. The majority of incipient NS I/LMXBs are distributed in the range of . Panel (b) demonstrates that the birthrate in case 1 reveals a bimodal distribution peaked at and . The origin of this bimodal feature comes from the fact that NSs formed from CCSNe and ECSNe are distributed in relatively short and long orbital period binaries222Otherwise the mass transfer would occur at the early evolutionary stage and lead to the formation of WDs instead of NSs., respectively (see panel c). In case 2, the bimodal feature is not as clear as in case 1, because the birthrate distribution is dominated by NSs from ECSNe in wide binaries.
2.2 Evolution of NS I/LMXBs
It is traditionally thought that the accretion rate of a CO is limited by the Eddington limit, namely,
| (1) |
where is the accretor’s mass; is the hydrogen abundance of the accreting material; is the radiation efficiency to correct the accreted mass for the energy lost by radiation and we set for NSs and for BHs (Podsiadlowski et al., 2003). For a super-Eddington BH accretion disk, Shakura & Sunyaev (1973) suggested that the local Eddington-limited accretion is enabled and there is mass loss from the disk starting at the spherization radius
| (2) |
where is the mass accretion rate at the outer edge of the accretion disk (which is equal to the mass transfer rate via RLOF), the speed of light in vacuum, and the gravitational constant.
The accretion behaviour of NSs is more complicated than that of BHs due to the interaction between the NS magnetic field and the accretion disk. When the NS magnetic field is sufficiently strong, the inner part of the disk is disrupted at a radius (Frank et al., 2002)
| (3) |
where is the magnetic moment of the NS (with and being the surface magnetic field and the radius respectively), the mass of the NS, the accretion rate at , and a factor of order unity (Ghosh & Lamb, 1979; Wang, 1996; Long et al., 2005; Kulkarni & Romanova, 2013). If , then ; otherwise . This limits to a critical accretion rate by equating with (e.g., Kuranov et al., 2020),
| (4) |
The Shakura & Sunyaev (1973) model is based on the assumption of a standard thin disk. More recently, Chashkina et al. (2017) considered geometrically thick disk accretion onto a magnetized NS and pointed out that, in the case of the local Eddington limit is reached when the half-thickness of the disk is comparable with the inner radius of the disk. This gives
| (5) |
At a even higher accretion rate, advection becomes important (Lipunova, 1999) and the critical accretion rate can be enhanced to be (Chashkina et al., 2019)333Note that the magnitude of also depends on other parameters including the viscosity parameter, the vertical effective polytropic index of the accretion disk, and the energy fraction for launching the disk winds.
| (6) |
Based on Chashkina et al. (2017, 2019) we assume that the upper limit of is
| (7) |
We let the NS accretion rate equal to . As mentioned in last section, observations of ULX pulsars suggest that the NSs in ULXs may accrete at an accretion rate up to . Super-Eddington luminosities have also been reported in RLOF NS HMXBs like SMC X-1 (Price et al., 1971) and LMC X-4 (Moon et al., 2003). This could be related to the strong magnetic fields of the NSs, which reduce the electron scattering cross section (Canuto et al. 1971; Herold 1979; Paczynski 1992) and enhance the Eddington luminosity. Indeed, recent studies on the magnetic fields of ULX pulsars indicate that they may possess magnetic fields (Dall’Osso et al., 2015; Xu & Li, 2017; Erkut et al., 2020; Gao & Li, 2021). In that case the accretion flow is collimated by the field lines, and radiation escapes from the side of the accretion column above the polar regions (e.g., Basko & Sunyaev, 1976a, b; Mushtukov et al., 2015). Recent numerical simulations (e.g., Kawashima et al., 2016; Takahashi & Ohsuga, 2017; Kawashima & Ohsuga, 2020) also confirm that magnetized NSs can accrete at a rate much higher than the Eddington limit accretion rate.
We tentatively ignore possible magnetic field decay in our calculations, because it is still unclear whether it is caused by spindown-induced flux expulsion, Ohmic evolution of crustal field and diamagnetic screening of the field by accreted plasma (see Bhattacharya, 2002, for a review). In the latter cases, we note that some LMXBs like 4U162667 possess an very old NS that has experienced extensive mass accretion, but the NS magnetic field is still as strong as a few (Verbunt et al., 1990; Orlandini et al., 1998; Camero-Arranz et al., 2012; Sasano et al., 2014). We will discuss the influence of magnetic field decay in Section 4.
Another issue needed to address is the spin evolution of accreting NSs. Stable accretion requires that the inner disk radius should be less than the corotation radius
| (8) |
where is the spin period. When , the NS enters the propeller regime with most of the accreting material being ejected. This means that efficient accretion can take place if
| (9) |
In our calculation, the NS mass growth generally satisfies this requirement. We can also check this condition by examining the spin evolution of the NSs. The timescale of the spin evolution of accreting NSs can be roughly estimated from the torque equilibrium equation
| (10) |
where is the moment of inertia and is the spin period derivation of the NS. So, it follows that
| (11) |
The measured spin evolution timescales for the ULX pulsars M82 X-2 (Bachetti et al., 2014, 2020), NGC5907 ULX-1 (Israel et al., 2017a), M51 ULX-7 (Rodríguez Castillo et al., 2020) and NGC7793 P13 (Fürst et al., 2016, 2018; Israel et al., 2017b) are , , and , respectively. Since the mass transfer timescale (where is the donor’s mass) is much longer than , we expect that the spin equilibrium can be quickly established once the mass transfer starts and the NS is always close to the spin equilibrium state during most of its X-ray lifetime (e.g., Kuranov et al., 2020). The observed alternation between spin-up and spin-down of M82 X-2 is consistent with this picture (Bachetti et al., 2020).
We assume the maximum mass of an NS to be , slightly higher than estimated by Farr & Chatziioannou (2020) for Galactic NSs. Once the NS accretes enough material and collapses into a BH444We neglect any kick caused by the collapse of an NS into a BH., the magnetic field effect stops working. As a result, the critical accretion rate recovers to the traditional Eddington limit, i.e., 555As shown below, the descendant BHs mostly accrete at a sub-Eddington rate, so the definition of does not considerably affect the properties of BHs..
A significant part of LMXBs are transient sources, likely caused by thermal and viscous instability in the accretion disks (Lasota, 2001; Hameury, 2020). The condition for the disk instability (DI) is that the mass transfer rate in the disks is lower than a critical value , which depends on the masses of the accretor and the donor, the orbital period, and the chemical compositions of the disk material. Additionally, X-ray irradiations from the accreting NS/BHs can help stabilize the accretion disk to some extent by increasing the surface temperature of the disk (van Paradijs, 1996; King et al., 1997; Lasota, 2001; Ritter, 2008). Here we use the prescription of given by Dubus et al. (1999) (see also Lasota et al., 2008; Coriat et al., 2012), i.e.,
| (12) |
where is the binary orbital period. The accretion disk becomes unstable when , that is, the disk undergoes rapid mass transfer during short outbursts separated by long quiescent intervals. Hameury & Lasota (2020) calculated the time evolution of transient BH accretion disks, and found that the ratio of the accreted mass to the disk mass during outbursts is generally . In the case of transient NS accretion disks, it is usually thought that the disk is passive during quiescence and the NSs are in the propeller or ejector regime, so almost all of the transferred material is likely to be ejected. During outbursts, the mass flow rate is enhanced by a factor of (Tanaka & Shibazaki, 1996; King et al., 2003), and some of the disk material may be accreted by the NS. However, the accretion efficiency is sensitively dependent on the properties of the NS and the accretion disk. Fortunately, since we are only concerned with DI at the very beginning of the mass transfer of IMXBs666NSs in transient LMXBs can hardly evolve to be BHs due to the low mass of the donor stars. and the initial rising stage occupies a small part in the total mass transfer lifetime (see Figure 4), the contribution of mass accretion during outbursts to the NS mass growth is limited. For simplicity, we assume that mass accretion of the CO is fairly inefficient from an unstable disk, and set the ratio of the lost mass to the transferred mass in unit time as follows,
| (13) |
Hence, the accretion rate of the CO is . (Note that in Equation 13 is different for NSs and BHs.) In Section 4 we will check this assumption by taking for NSs.
Mass loss also takes away orbital angular momentum from the binary system (Soberman et al., 1997). We assume that mss loss occurs in the vicinity of the accretor in I/LMXBs, so the rate of angular momentum loss can be written as
| (14) |
where is the orbital separation. Our assumption of non-conservative mass transfer in transient LMXBs obviously influence the angular momentum loss from the binary compared with the case of conservative mass transfer. However, as shown by Ma & Li (2009), the strength of magnetic braking (see below) is the dominant factor in determining the value of the bifurcation periods compared with mass loss. Thus, the amount and form of the ejected mass does not considerably affect the evolution of BH LMXBs.
For wind mass loss from the low-mass donor, we consider angular momentum loss caused by braking of the magnetized wind. We use the convection-boosted magnetic braking model suggested by Van et al. (2019), i.e.,
| (15) |
where is the magnetic braking parameter (in our calculations we take the default value ); is the orbital angular velocity, is the radius of the donor star; is the turnover time of the convective eddies of the donor star and is the turnover time of the Sun; is the convection-boosted power low index and we take (Van et al. 2019; Deng et al. 2021). The convection-boosted magnetic braking model is based on the widely-used traditional magnetic braking model (Rappaport et al., 1983) by adding a boosting factor . Van et al. (2019) found that this model is able to reproduce some particular NS LMXBs. Deng et al. (2021) systematically compared five types of magnetic braking prescriptions in the literature, and found that the convection-boosted model seems to be more suitable to account for the overall properties of LMXBs, compared with other magnetic braking prescriptions.
Finally we also take into account angular momentum loss caused by GW emissions (Landau & Lifshitz, 1959; Faulkner, 1971), i.e.,
| (16) |
We then use the one-dimension stellar evolution code MESA (version 12778, Paxton et al., 2011; Paxton et al., 2013, 2015, 2018, 2019) to trace the detailed evolutions of I/LMXBs. For the incipient I/LMXBs, we consider the initial mass of the NS to be , and assume that the donor evolves from zero-age main sequence, since the lifetime () of the NS progenitor is much shorter than that of a low-mass star. The initial mass of the donor is distributed over the range of in linear steps of , and the orbital period over the range of in logarithmic steps of , consistent with the matrix elements in Figure 1. We terminate the calculation when the age of the donor star reaches . We exclude those binaries without mass transfer, with RLOF at the birth of the NS, and with the donor star overflowing from the Lagrange point.
We use a simple criteria, that is, whether the mass transfer rate is less than or not, to discriminate the dynamically stable or unstable mass transfer in I/LMXBs. To explore the possible influence of the magnetic field, metallicity, and critical mass transfer rate on the mass growth of NSs, we construct the following six models:
-
•
Model LB: , (case 1), and follows Equation 4 ().
-
•
Model HB: , (case 1), and follows Equation 4 ().
-
•
Model LZ: , (case 2), and follows Equation 4 ().
-
•
Model LBCh: , (case 1), and follows Equation 7.
-
•
Model HBCh: , (case 1), and follows Equation 7.
-
•
Model LZCh: , (case 2), and follows Equation 7.
The input parameters of the six models are summarized in Table 1.
| Models | |||
|---|---|---|---|
| LB | (case 1) | Equation 4 | |
| HB | (case 1) | Equation 4 | |
| LZ | (case 2) | Equation 4 | |
| LBCh | (case 1) | Equation 7 | |
| HBCh | (case 1) | Equation 7 | |
| LZCh | (case 2) | Equation 7 |
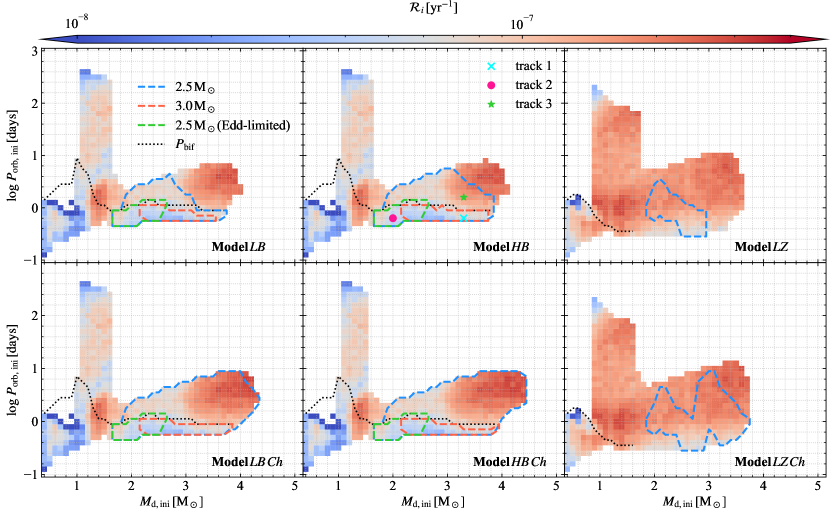
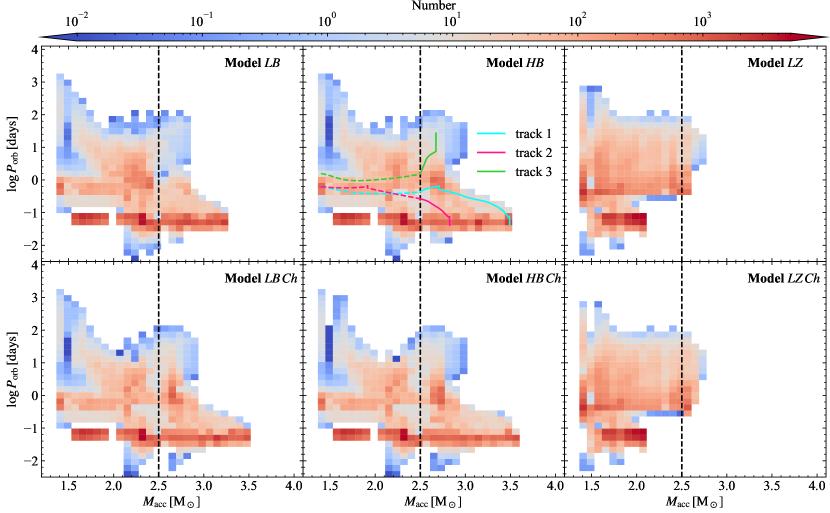
Figure 3 shows the allowed parameter space for stable mass transfer in different models. The colors in each pixel indicate the birthrates of specific I/LMXBs inferred from the BPS results. We use the blue and red dashed contours in each panel of Figure 3 to indicate the final masses of the accretors and , respectively, and the green dashed contours to indicate with the Eddington-limited accretion prescription for comparison. Since the critical transfer rate increase with increasing magnetic field, NSs with a higher magnetic field have more opportunities to collapse into BHs, so the parameter space for the formation of mass-gap BHs enlarges with increasing magnetic field. It is also clear that mass-gap BHs can be more likely formed in the thick disk model (Equation 7) than in the thin disk model (Equation 4) for the critical mass transfer rate. Our results in case 1 are generally in accordance with Tauris et al. (2000) and Shao & Li (2012, 2015). This means that allowing supper-Eddington accretion does not strongly influence the conditions for stable mass transfer in I/LMXBs.
Lower metallicity leads to smaller radius of the donor star with a given mass. As a result, the maximum orbital periods with which RLOF can occur in Model LZ are shorter than in Model LB. This explains why the maximum mass of the donor in Model LZ is smaller than in Model LB for stable mass transfer. The black dotted lines in Figure 3 represent the bifurcation period which divides diverging binaries from contracting binaries (Pylyser & Savonije, 1988), as a function of the initial donor mass . Note that the reduction of the metallicity results in a smaller radius of stars and shorter nuclear timescales which leads to a shorter (see e.g., Jia & Li, 2014). We find that an NS in Models LB and HM can grow to be a BH if the initial orbital periods and the initial donor masses , while in Model LZ the formation of a BH requires a higher initial donor mass. BHs with masses mostly originate from converging binaries in case 1 with the initial donor mass . No BH with mass can form in case 2.
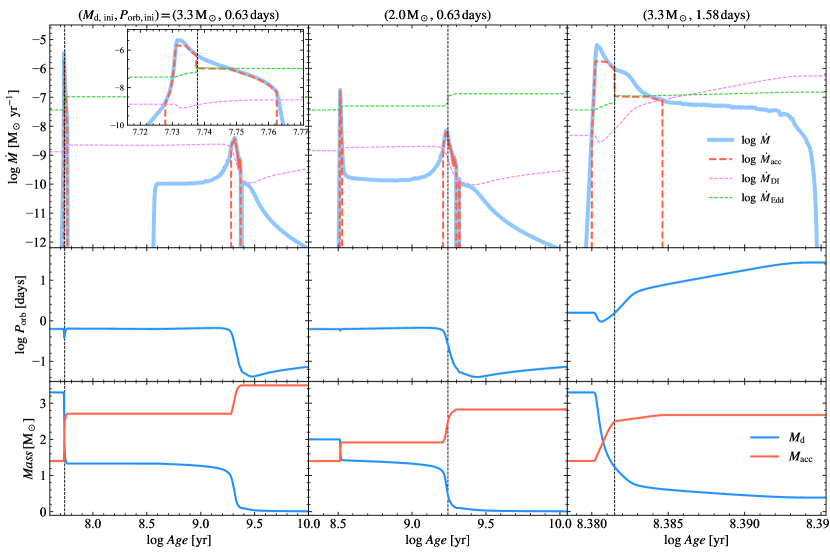
Figure 4 shows three typical binary evolutionary tracks in Model HB with the initial parameters (, , ), (, ) and (, ), corresponding to the left (track 1), middle (track 2) and right (track 3) panels, respectively. The initial states of the three tracks are shown in the upper middle panel of Figure 3. The upper, middle and lower panels depict the evolution of the mass transfer rate/mass accretion rate, the orbital period and the donor/accretor mass against the age, respectively. The left panels of Figure 4 demonstrate the evolution of a converging binary. The donor starts to fill its RL and initiates mass transfer at the age of . The mass transfer rate goes up rapidly and exceeds the Eddington limit at . At , the NS collapses to be a BH. At this moment, the donor mass is and the orbital period is . After the formation of the BH, the orbit slightly expands due to the mass redistribution between the donor and the accretor, and the binary becomes detached. When the donor re-fills its RL at , a BH XRB emerges. The subsequent mass transfer rate varies in the range of . Ultimately, the donor star evolves to be a brown dwarf (with mass ), accompanied by a BH in a orbit. If we take the Eddington-limited accretion prescription for the NS instead, the final NS mass in the binary can only reach .
In the middle panels of Figure 4, the donor overflows its RL at . The mass accretion rate of the NS varies in the range of and the mass accretion process lasts about . When the NS mass increases to , the mass growth ceases because the disk becomes unstable. Subsequently, magnetic braking drives the mass transfer at an increasing rate and the NS begins to accrete material again. At , the NS collapses to be a BH. At , the donor becomes fully convective and magnetic braking switches off, so the donor detaches from its RL. About later, the donor fills its RL again driven by GW emissions, but the BH mass hardly increases. In the end, the binary consists of a BH and a brown dwarf in a orbit.
The right panels of Figure 4 reflect the evolution of a diverging binary. The donor fills its RL at . After less than - rapid accretion, the NS collapses into a BH. After the reversion of the component masses, the orbit period continually increases caused by the nuclear expansion of the donor star. The final orbital period is , and the donor ultimately becomes a hybrid (Helium and Carbon) WD. However, the NS hardly accretes any material () with the Eddington-limited accretion prescription.
3 Population results of mass-gap BH binaries
Combining the detailed evolutionary sequences and the birthrate from the BPS, we can calculate the number distribution of I/LMXBs in parameter plane. The number in a parameter space bin can be obtained with the following equation
| (17) |
where and are the time span and the birthrate for the th evolutionary track passing through a specific parameter space element , respectively; is the total number of the evolutionary tracks calculated with MESA that pass through the specific element . Here and can be any parameters we are interested in, such as the donor mass , the orbital period , and the mass transfer rate . Based on this method, one can derive the number distribution of binaries in different evolutionary phases and in different parameter space.
We plot the number distributions of I/LMXBs in the accretor mass-orbital period (-) plane in Figure 5. The cyan, pink and green solid (dashed) lines in the upper left panel show the evolutionary tracks 1, 2 and 3 in the - plane, respectively, when they are in the BH(NS) XRB phase. The black dashed line in Figure 5 represents the dividing line between the NS and BH accretors. We can see that the accretor masses are distributed in the range of , and a considerable fraction of them are regarded to be mass-gap BHs. The maximum mass that the accretor can reach increases with increasing magnetic field. We list the predicted birthrate and the total number of NS/BH XRBs in Tables 2 and 3, respectively. In case 1, most of the BH binaries evolve from converging systems. In case 2 (Models LZ and LZCh), both the maximum accretor mass and the number of the BH XRBs are significantly smaller than in case 1.
| Models | NS I/LMXBs | NS binaries | BH binaries |
|---|---|---|---|
| LB | |||
| HB | |||
| LZ | |||
| LBCh | |||
| HBCh | |||
| LZCh |
| Models | Total XRBs | NS XRBs | NS ULXs | BH XRBs | BH ULXs | Detached BH binaries | LISA BH binaries () |
|---|---|---|---|---|---|---|---|
| LB | |||||||
| HB | |||||||
| LZ | |||||||
| LBCh | |||||||
| HBCh | |||||||
| LZCh |
In the following, we demonstrate the statistical characteristics of these BH binaries and their possible contribution to the GW sources. We may put useful constraints on the mass accretion efficiency in I/LMXBs by comparing their properties with multi-messenger observations.
3.1 Orbital periods, donor masses, and mass transfer rates of BH I/LMXBs
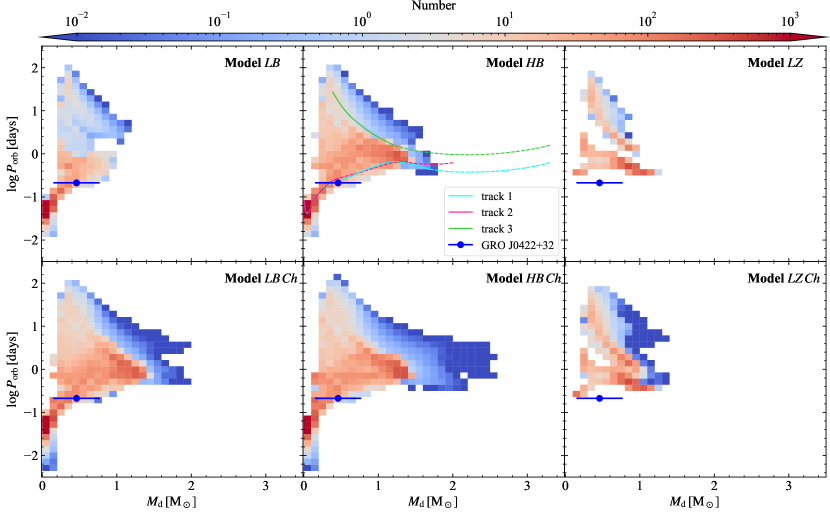
In Figure 6, we show the number distribution of BH I/LMXBs in the donor mass-orbital period (-) plane. The orbital periods of BH I/LMXBs are distributed in the range of and there are some ultracompact binaries with very short orbital periods and low-mass () donors. These binaries originate from the track 1/2 evolution and the donors are degenerated hydrogen/helium dwarf stars. They will evolve into the GW sources to be probably detected by future space-based GW detectors. The blue dot with error bar denotes the mass-gap BH LMXB GRO J0422+32 (a BH accompanied by a star in a orbit, Webb et al. 2000; Gelino & Harrison 2003; Kreidberg et al. 2012). Our results of case 1 evolution can properly match the donor mass and orbital period of GRO J0422+32.
Metallicity can significantly influence the total number and number distribution of BH I/LMXBs. From Table 3 we find that, although the birthrate of I/LMXBs in case 1 is about half of that in case 2, the total number of BH I/LMXBs in case 1 is an order of magnitude more than that in case 2. This difference results from the lower bifurcation period in case 2, which helps produce more converging systems in case 1. For comparison, Figure 5 shows that there are few BH I/LMXBs with orbital periods in case 2. Hence, the DI is less likely to occur in case 1, so the NS can accrete more material than in case 2.

Figure 7 shows the number distribution of BH I/LMXBs in the orbital period-mass transfer rate (-) plane. Combining the number distribution of BH I/LMXBs and the three evolutionary tracks in the upper middle panel of Figure 7, we find that the mass transfer in BH I/LMXBs maintains at a rate , which is dominated by the track 2 evolution and the late track 1 evolution. BH I/LXMBs with a relatively high mass transfer rate () are usually in a relatively wide orbit (), mainly contributed by the early track 1 and track 3 evolutions. BH I/LMXBs with orbital period and mass transfer rate experience the later track 1/2 evolution driven by GW radiation. The green belt in each panel of Figure 7 indicates the dividing line between the transient and persistent XRBs. We find that most of the mass-gap BH XRBs are expected to be transient X-ray sources.
3.2 Luminosities of I/LMXBs and their contribution to ULXs
We use the following equation to calculate the isotropic accretion luminosities of I/LMXBs (Shakura & Sunyaev 1973, see also King et al. 2017; King & Lasota 2020), i.e.,
| (18) |
Note that is different in the cases of accreting NSs and BHs.


We plot the number distributions of NS and BH I/LMXBs in the orbital period-accretion luminosity (-) plane in Figures 8 and 9, respectively. The luminosities of NS I/LMXBs are mostly in the range of and a fraction of them can reach , significantly exceeding the Eddington luminosity for an NS accretor. The luminosities of BH I/LMXBs are in the range of . Metallicity does not significantly influence the number distribution of NS I/LMXBs in the - plane, but the total number of NS/BH I/LMXBs heavily depends on metallicity. From Table 3, we find that the number of NS I/LMXBs in case 2 is greater than that in case 1, because the birthrate of incipient NS I/LMXBs in case 2 is twice that in case 1.
Assuming that I/LMXBs with isotropic luminosities (depicted with the dashed line in each panel of Figures 8 and 9) are ULXs, we plot the number distribution of NS and BH ULXs as a function of the orbital period with red histograms in Figures 8 and 9, respectively. In Table 3, we also list the number of NS and BH ULXs. In our results, there are NS ULXs and only BH ULXs in the Galaxy. The orbital periods of the NS and BH ULXs are in the range of and , respectively. The majority of NS ULXs originate from the early track 1/3 evolution in a relatively close orbit. They will finally evolve into BH XRBs. Other NS ULXs have relatively low-mass () donors and long ( days) orbital periods, and it is hard for them to accrete enough material to collapse to be BHs.
M82 X-2 is a ULX pulsar with a donor in a orbit (Bachetti et al., 2014). The extremely high luminosity (up to ) implies that the NS in M82 X-2 is undergoing rapid mass accretion. NGC5907 ULX-1 (Israel et al., 2017a) is another pulsar accompanied by a donor in a orbit. Its peak luminosity can reach . Considering the high mass ratio, it is traditionally believed that these binary systems will undergo unstable mass transfer followed by CEE. However, if the NS can accrete at a super-Eddington rate and gains mass rapidly, the mass transfer can be stabilized to some extent, especially when the NSs are born massive. We plot the two ULX pulsars in the - plane in Figure 8 with cyan (M82 X-2) and red (NGC5907 ULX-1) circles. Our results of the six models can roughly reproduce the observed accretion luminosities and orbital periods of M82 X-2, but only Models LBCh, HBCh and LZCh can match the observational characteristics of NGC5907 ULX-1.
3.3 Detection of detached mass-gap BH binaries
It is impossible to detect BH binaries in X-ray before and after the mass transfer process. To discover BHs in detached binaries, a promising method is based on the radial velocity searches of the optical companions (e.g., Giesers et al. 2018; Khokhlov et al. 2018; Thompson et al. 2019; Giesers et al. 2019). Following previous studies (Breivik et al., 2017; Mashian & Loeb, 2017; Yalinewich et al., 2018; Yamaguchi et al., 2018; Shao & Li, 2019), we evaluate the detectability of detached mass-gap BH binaries.
The apparent magnitude of the optical companion in the -band can be obtained by
| (19) |
where is the absolute magnitude of the companion star, is the distance of the binary from the Sun, and is the interstellar extinction in the -band, taken to be (e.g., Yamaguchi et al. 2018). The distribution of the distance for each sample is assumed to follow the stellar distribution in the Milky Way (see Lau et al., 2020). According to Bahcall & Soneira (1980), we use the following number density as a function of the distance from the Galactic center in the Galactic plane and the distance perpendicular to the Galactic plane , i.e.,
| (20) |
where is the distance from the Galactic center to the Sun, and are the Galactic latitude and longitude, and are the scale lengths for the exponential stellar distributions perpendicular and parallel to the Galactic plane, respectively. In our calculations, we use the Markov chain Monte–Carlo sampler emcee (Foreman-Mackey et al., 2013) to draw the 3-dimensional number density distribution.
The radial velocity semi-amplitude of the optical companions is
| (21) |
where and are the masses of the companion and the BH, and are the eccentricity and the orbital inclination of the binaries, respectively. In our calculations we take and assume that follows a uniform distribution in the range of . The astrometric signature (Mashian & Loeb 2017) is
| (22) |
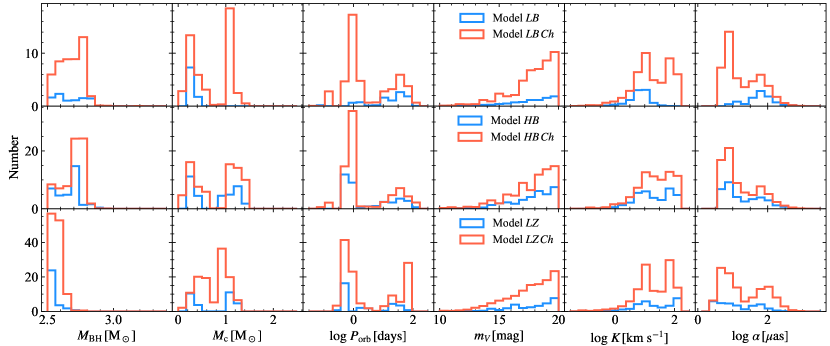
In Figure 10, we show the number distribution of detached mass-gap BH binaries with the optical companions brighter than in the Galaxy as a function of the BH mass , the companion mass , the orbital period , the absolute magnitude , the radial velocity semi-amplitude , and the astrometric signature . We find that up to dozens to hundreds of detached mass-gap BH binaries may be detected with optical observations. The total number of detached mass-gap BH binaries in each model is summary in Table 3. The companion mass distribution is peaked at and can extend to . The orbital periods display a bimodal distribution peaked at and , which likely originate from the temporary detachment during the XRB phase and the permanent detachment after the mass transfer, respectively. In addition, the distribution of is roughly peaked at and is distributed in the range of , peaked at .
Shao & Li (2019) investigated the formation and evolution of BH binaries born from core collapses of massive stars, and found that the birthrate of incipient BH binaries in the Galaxy is , and there are several hundred detached BH binaries with an optical companion brighter than . The birthrate of mass-gap BH binaries is , implying that BH binaries descended from NS I/LMXBs might make non-negligible contribution to the whole detached BH binary population in the Galaxy.
3.4 Contribution to GW sources

Short-period BH binaries are potential targets of future space-based GW observatories like LISA (Amaro-Seoane et al., 2017). We use the following equation to calculate the characteristic strain at the th harmonic (Barack & Cutler 2004, see also Kremer et al. 2019; Shao & Li 2021), that is,
| (23) |
where is the chirp mass of the binary, the luminosity distance, the th harmonics frequency of GWs, the rest-frame orbital frequency, a function of the orbital eccentricity (Peters & Mathews, 1963), and . We also assume that the BH binaries follow the stellar distribution in the Galaxy and the binary orbits are circular. The peak frequency of the GW is given by (Wen, 2003), and we take and . We only select binaries with the signal-to-noise ratio larger than unity for the LISA mission duration of and use the sensitivity curves constructed and fitted by Robson et al. (2019). We note that the characteristic strain is reduced by a factor to account for the frequency band swept by each source during the observation time (e.g., Kremer et al., 2019, 2020), where is the derivative of with respect to time.
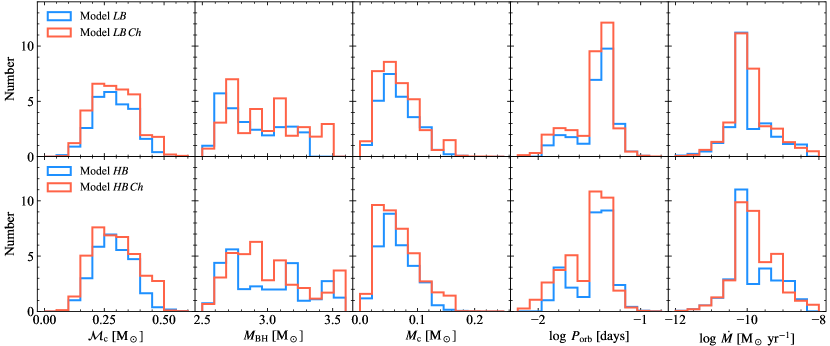
Figure 11 shows the number distribution of BH binaries that can be detected by LISA with in the GW frequency-characteristic strain (-) plane. The LISA sensitivity curve (Robson et al., 2019) is illustrated by the black solid line. The characteristic strain of the detectable sources can reach with the frequencies . The cyan and red solid lines in the upper-left panel demonstrate the evolutionary paths of tracks 1 and 2, respectively, assuming that the BH binaries are away from the Sun. Binaries like them contribute to almost all of the LISA sources. The number of the detectable mass-gap BH binaries for a specific is listed in each panel of Figure 11 followed by the number () of GW-detectable BH XRBs. For , there are mass-gap BH binaries that can be detected by LISA in case 1, while there is no mass-gap BH binaries in case 2. However, the corresponding numbers decrease to and with . The initial orbital periods of the incipient NS I/LMXBs that can evolve into mass-gap BH LISA sources are in a narrow range of , depending on the bifurcation period.
Figure 12 shows the number distribution of the mass-gap BH binaries that can be detected by LISA with as a function of the chirp mass , the BH mass , the companion mass , the orbital period and the mass transfer rate (from left to right panels). There is no detectable BH binary with in Models LZ and LZCh with metallicity . The BH masses and orbital periods cover the range of , , respectively. Almost all of the LISA-detectable BH binaries are transient X-ray sources with mass transfer rate and orbital period (see also Figure 7). The chirp mass of the mass-gap BH sources varies in the range of and is peaked at . In this respect, mass-gap BH binaries may be discriminated from BH binaries formed from core-collapse SNe, in which , , and for BH+WD binaries, BH+NS binaries, and BH+BH binaries (Shao & Li, 2021).
4 Discussion and Summary

In this work, we explore the possible formation of mass-gap BHs from super-Eddington accreting NSs. In the traditional picture, the growth of the NS mass is limited by the Eddington accretion rate. Our work is motivated by two facts. (1) In the observational aspect, the luminosities of some ULX pulsars have been inferred to be , and their sinusoidal pulse profiles imply that strong beaming of the X-ray radiation is not favored. Thus, the observed (isotropic) luminosities are likely close to their true accretion luminosities and the NSs are accreting at a super-Eddington rate. (2) In the theoretical aspect, it is difficult for a single SN mechanism account for both the mass gap and the existence of a few low-mass BHs. Thus, AIC of NSs in I/LMXBs may provide an alternative formation channel of mass-gap BHs like GRO J0422+32.
Our calculations show that mass-gap BHs descending from NS I/LMXBs generally experience the evolutionary stages of detached, mass transferring, and merging binaries, and can be potentially detected with optical, X-ray and GW methods, respectively. The majority of mass-gap BH LMXBs are transient sources (see Figure 7), similar to traditional BH LMXBs. Our calculations show that there might be tens to hundreds of detached mass-gap BH binaries with optical companions brighter than , which can be observed by future optical observations. GW radiation presents another useful way to detect the mass-gap BHs. We predict that there might be up to 3 BH binaries to be detected by LISA with . Their chirp mass distribution may provide unique feature to test the AIC formations channel for mass-gap BHs.
Our results are subject to the uncertainties related to accretion physics, like accretion-induced magnetic field decay and the accretion efficiency of transient NS XRBs. Below we discuss their influence separately.
The apparent correlation between the mass transferred mass and the magnetic field strength in LMXBs suggests that NS magnetic fields may decrease due to accretion, so the critical mass accretion rate in Equation 7 would change with time accordingly. Here we follow Osłowski et al. (2011) to adopt an empirical form of accretion-induced magnetic field decay,
| (24) |
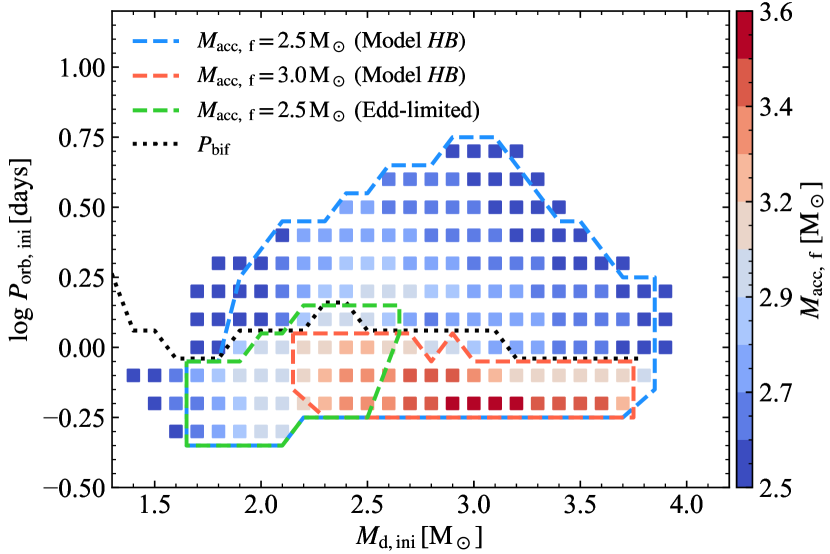
where is the initial magnetic field, the minimal (bottom) magnetic field of the NS, the acrreted mass of the NS, and is a constant. To quantify the effect of magnetic field decay, we consider a model with and , and other parameters are the same as in Model HB. When the magnetic field becomes sufficiently low, decreases to be comparable with . So we take the critical accretion rate to be . In Figure 13, the final masses of the accretors are depicted with the colored squares in the - plane. For comparison, the blue and the red dashed curves demonstrate the binary distribution with and in Model HB respectively, and the green dashed curve indicates with the Eddington-limited accretion prescription. When magnetic field decay is considered, the allowed parameter space for the formation mass-gap BHs is significantly smaller than that in Model HB, and the BH binaries are mainly formed from relatively compact (and converging) systems ( days). In this case, the maximum mass of the BHs is about . The birth rate of the BH binaries and the total number of BH XRBs in the Galaxy reduce from to and from to , respectively. However, the number of the detectable LISA sources with remains unchanged (), because they result from converging binaries. If we take smaller value for , the parameter space will get further smaller and be close to the Eddington-limited accretion case (the green dashed curve in Figure 13).
Next we consider the accretion efficiency from an unstable disk. Here the main uncertainty is how much mass an NS can accrete during outbursts, which depends on the maximum mass transfer rate and the profile during the outbursts, as well as the spin period and magnetic field of the NS. Bhattacharyya & Chakrabarty (2017) computed the evolution of accreting NSs in transient LMXBs through a series of outburst and quiescent phases, assuming a simplified, linear profile during both outburst rise and decay. They found that the ratio of the equilibrium spin periods of persistent to transient NSs with the same is around (see also, Bhattacharyya, 2021). From this we can infer a rough estimate of the accretion efficiency . We then calculate a model similar to Model HB but with for transient NS XRBs. Figure 14 shows the distribution in the - plane, and the final masses of the BHs are depicted with colored squares. Compared with Model HB (the blue dashed curve), the allowed parameter space for the formation mass-gap BHs varies slightly. The birth rate of BH binaries and the number of BH XRBs increase by a factor . The number of detectable LISA sources with is almost unchanged and is still . The reason is that DI usually occurs when the mass transfer rate is for NS accretors, so its influence on angular momentum loss and mass growth of the accretor is insignificant.
We conclude that our results shown in Figures 5–12 represent the optimistic case for the formation of mass-gap BH from AIC of NSs, and the predicted birthrate and total number of BH binaries in Tables 2 and 3 should be regarded as the upper limits. Nevertheless, our study shows that super-Eddington accretion may have non-negligible influence on the evolution of NS I/LMXBs.
Acknowledgments
We are grateful to an anonymous referee for helpful comments. This work was supported by the National Key Research and Development Program of China (2021YFA0718500), the Natural Science Foundation of China under grant No. 12041301, 12121003, and Project U1838201 supported by NSFC and CAS. The computation was made by using the facilities at the High-Performance Computing Center of Collaborative Innovation Center of Advanced Microstructures (Nanjing University).
Data Availability
All data underlying this article will be shared on reasonable request to the corresponding author.
References
- Abbott et al. (2020) Abbott R., et al., 2020, ApJ, 896, L44
- Ablimit et al. (2021) Ablimit I., Podsiadlowski P., Hirai R., Wicker J., 2021, arXiv e-prints, p. arXiv:2108.08430
- Amaro-Seoane et al. (2017) Amaro-Seoane P., et al., 2017, arXiv e-prints, p. arXiv:1702.00786
- Bachetti et al. (2014) Bachetti M., et al., 2014, Nature, 514, 202
- Bachetti et al. (2020) Bachetti M., et al., 2020, ApJ, 891, 44
- Bahcall & Soneira (1980) Bahcall J. N., Soneira R. M., 1980, ApJS, 44, 73
- Bailyn et al. (1998) Bailyn C. D., Jain R. K., Coppi P., Orosz J. A., 1998, ApJ, 499, 367
- Barack & Cutler (2004) Barack L., Cutler C., 2004, Phys. Rev. D, 70, 122002
- Basko & Sunyaev (1976a) Basko M. M., Sunyaev R. A., 1976a, Soviet Ast., 20, 537
- Basko & Sunyaev (1976b) Basko M. M., Sunyaev R. A., 1976b, MNRAS, 175, 395
- Belczynski et al. (2012) Belczynski K., Wiktorowicz G., Fryer C. L., Holz D. E., Kalogera V., 2012, ApJ, 757, 91
- Bhattacharya (2002) Bhattacharya D., 2002, Journal of Astrophysics and Astronomy, 23, 67
- Bhattacharyya (2021) Bhattacharyya S., 2021, MNRAS, 502, L45
- Bhattacharyya & Chakrabarty (2017) Bhattacharyya S., Chakrabarty D., 2017, ApJ, 835, 4
- Breivik et al. (2017) Breivik K., Chatterjee S., Larson S. L., 2017, ApJ, 850, L13
- Camero-Arranz et al. (2012) Camero-Arranz A., Pottschmidt K., Finger M. H., Ikhsanov N. R., Wilson-Hodge C. A., Marcu D. M., 2012, A&A, 546, A40
- Canuto et al. (1971) Canuto V., Lodenquai J., Ruderman M., 1971, Phys. Rev. D, 3, 2303
- Carpano et al. (2018) Carpano S., Haberl F., Maitra C., Vasilopoulos G., 2018, MNRAS, 476, L45
- Casares & Jonker (2014) Casares J., Jonker P. G., 2014, Space Sci. Rev., 183, 223
- Chandra et al. (2020) Chandra A. D., Roy J., Agrawal P. C., Choudhury M., 2020, MNRAS, 495, 2664
- Chashkina et al. (2017) Chashkina A., Abolmasov P., Poutanen J., 2017, MNRAS, 470, 2799
- Chashkina et al. (2019) Chashkina A., Lipunova G., Abolmasov P., Poutanen J., 2019, A&A, 626, A18
- Coriat et al. (2012) Coriat M., Fender R. P., Dubus G., 2012, MNRAS, 424, 1991
- Cromartie et al. (2020) Cromartie H. T., et al., 2020, Nature Astronomy, 4, 72
- Dall’Osso et al. (2015) Dall’Osso S., Perna R., Stella L., 2015, MNRAS, 449, 2144
- Deng et al. (2021) Deng Z.-L., Li X.-D., Gao Z.-F., Shao Y., 2021, ApJ, 909, 174
- Dessart et al. (2006) Dessart L., Burrows A., Ott C. D., Livne E., Yoon S. C., Langer N., 2006, ApJ, 644, 1063
- Doroshenko et al. (2018) Doroshenko V., Tsygankov S., Santangelo A., 2018, A&A, 613, A19
- Dubus et al. (1999) Dubus G., Lasota J.-P., Hameury J.-M., Charles P., 1999, MNRAS, 303, 139
- Eksi et al. (2015) Eksi K. Y., Andac I. C., Cikintoglu S., Gencali A. A., Gungor C., Oztekin F., 2015, MNRAS, 448, L40
- Erkut et al. (2020) Erkut M. H., Türkoğlu M. M., Ek\textcommabelowsi K. Y., Alpar M. A., 2020, ApJ, 899, 97
- Fabrika et al. (2021) Fabrika S. N., Atapin K. E., Vinokurov A. S., Sholukhova O. N., 2021, Astrophysical Bulletin, 76, 6
- Farr & Chatziioannou (2020) Farr W. M., Chatziioannou K., 2020, Research Notes of the American Astronomical Society, 4, 65
- Farr et al. (2011) Farr W. M., Sravan N., Cantrell A., Kreidberg L., Bailyn C. D., Mandel I., Kalogera V., 2011, ApJ, 741, 103
- Faulkner (1971) Faulkner J., 1971, ApJ, 170, L99
- Foreman-Mackey et al. (2013) Foreman-Mackey D., Hogg D. W., Lang D., Goodman J., 2013, PASP, 125, 306
- Frank et al. (2002) Frank J., King A., Raine D. J., 2002, Accretion Power in Astrophysics: Third Edition. Cambridge University Press
- Fryer et al. (2012) Fryer C. L., Belczynski K., Wiktorowicz G., Dominik M., Kalogera V., Holz D. E., 2012, ApJ, 749, 91
- Fürst et al. (2016) Fürst F., et al., 2016, ApJ, 831, L14
- Fürst et al. (2018) Fürst F., et al., 2018, A&A, 616, A186
- Gao & Li (2021) Gao S.-J., Li X.-D., 2021, Research in Astronomy and Astrophysics, 21, 196
- Gelino & Harrison (2003) Gelino D. M., Harrison T. E., 2003, ApJ, 599, 1254
- Ghosh & Lamb (1979) Ghosh P., Lamb F. K., 1979, ApJ, 234, 296
- Giesers et al. (2018) Giesers B., et al., 2018, MNRAS, 475, L15
- Giesers et al. (2019) Giesers B., et al., 2019, A&A, 632, A3
- Hameury (2020) Hameury J. M., 2020, Advances in Space Research, 66, 1004
- Hameury & Lasota (2020) Hameury J. M., Lasota J. P., 2020, A&A, 643, A171
- Herold (1979) Herold H., 1979, Phys. Rev. D, 19, 2868
- Hobbs et al. (2005) Hobbs G., Lorimer D. R., Lyne A. G., Kramer M., 2005, MNRAS, 360, 974
- Hurley et al. (2002) Hurley J. R., Tout C. A., Pols O. R., 2002, MNRAS, 329, 897
- Israel et al. (2017a) Israel G. L., et al., 2017a, Science, 355, 817
- Israel et al. (2017b) Israel G. L., et al., 2017b, MNRAS, 466, L48
- Ivanova & Taam (2004) Ivanova N., Taam R. E., 2004, ApJ, 601, 1058
- Ivanova et al. (2008) Ivanova N., Heinke C. O., Rasio F. A., Belczynski K., Fregeau J. M., 2008, MNRAS, 386, 553
- Ivanova et al. (2013) Ivanova N., et al., 2013, A&ARv, 21, 59
- Jia & Li (2014) Jia K., Li X. D., 2014, ApJ, 791, 127
- Kaaret et al. (2017) Kaaret P., Feng H., Roberts T. P., 2017, ARA&A, 55, 303
- Kandel & Romani (2020) Kandel D., Romani R. W., 2020, ApJ, 892, 101
- Kawashima & Ohsuga (2020) Kawashima T., Ohsuga K., 2020, PASJ, 72, 15
- Kawashima et al. (2016) Kawashima T., Mineshige S., Ohsuga K., Ogawa T., 2016, PASJ, 68, 83
- Khokhlov et al. (2018) Khokhlov S. A., et al., 2018, ApJ, 856, 158
- Kiel & Hurley (2006) Kiel P. D., Hurley J. R., 2006, MNRAS, 369, 1152
- King & Lasota (2019) King A., Lasota J.-P., 2019, MNRAS, 485, 3588
- King & Lasota (2020) King A., Lasota J.-P., 2020, MNRAS, 494, 3611
- King et al. (1997) King A. R., Kolb U., Szuszkiewicz E., 1997, ApJ, 488, 89
- King et al. (2003) King A. R., Rolfe D. J., Schenker K., 2003, MNRAS, 341, L35
- King et al. (2017) King A., Lasota J.-P., Kluźniak W., 2017, MNRAS, 468, L59
- Kreidberg et al. (2012) Kreidberg L., Bailyn C. D., Farr W. M., Kalogera V., 2012, ApJ, 757, 36
- Kremer et al. (2019) Kremer K., et al., 2019, Phys. Rev. D, 99, 063003
- Kremer et al. (2020) Kremer K., et al., 2020, ApJS, 247, 48
- Kroupa et al. (1993) Kroupa P., Tout C. A., Gilmore G., 1993, MNRAS, 262, 545
- Kulkarni & Romanova (2013) Kulkarni A. K., Romanova M. M., 2013, MNRAS, 433, 3048
- Kuranov et al. (2020) Kuranov A. G., Postnov K. A., Yungelson L. R., 2020, Astronomy Letters, 46, 658
- Landau & Lifshitz (1959) Landau L. D., Lifshitz E. M., 1959, Fluid mechanics. Pergamon Press, Oxford
- Lasota (2001) Lasota J.-P., 2001, New Astron. Rev., 45, 449
- Lasota et al. (2008) Lasota J. P., Dubus G., Kruk K., 2008, A&A, 486, 523
- Lau et al. (2020) Lau M. Y. M., Mandel I., Vigna-Gómez A., Neijssel C. J., Stevenson S., Sesana A., 2020, MNRAS, 492, 3061
- Linares et al. (2018) Linares M., Shahbaz T., Casares J., 2018, ApJ, 859, 54
- Lipunova (1999) Lipunova G. V., 1999, Astronomy Letters, 25, 508
- Liu et al. (2007) Liu Q. Z., van Paradijs J., van den Heuvel E. P. J., 2007, A&A, 469, 807
- Long et al. (2005) Long M., Romanova M. M., Lovelace R. V. E., 2005, ApJ, 634, 1214
- Ma & Li (2009) Ma B., Li X.-D., 2009, ApJ, 691, 1611
- Mashian & Loeb (2017) Mashian N., Loeb A., 2017, MNRAS, 470, 2611
- Middleton & King (2017) Middleton M. J., King A., 2017, MNRAS, 470, L69
- Moon et al. (2003) Moon D.-S., Eikenberry S. S., Wasserman I. M., 2003, ApJ, 586, 1280
- Mróz & Wyrzykowski (2021) Mróz P., Wyrzykowski Ł., 2021, Acta Astron., 71, 89
- Mushtukov et al. (2015) Mushtukov A. A., Suleimanov V. F., Tsygankov S. S., Poutanen J., 2015, MNRAS, 454, 2539
- Mushtukov et al. (2017) Mushtukov A. A., Suleimanov V. F., Tsygankov S. S., Ingram A., 2017, MNRAS, 467, 1202
- Mushtukov et al. (2019) Mushtukov A. A., Ingram A., Middleton M., Nagirner D. I., van der Klis M., 2019, MNRAS, 484, 687
- Mushtukov et al. (2021) Mushtukov A. A., Portegies Zwart S., Tsygankov S. S., Nagirner D. I., Poutanen J., 2021, MNRAS, 501, 2424
- Nomoto & Kondo (1991) Nomoto K., Kondo Y., 1991, ApJ, 367, L19
- Orlandini et al. (1998) Orlandini M., et al., 1998, ApJ, 500, L163
- Osłowski et al. (2011) Osłowski S., Bulik T., Gondek-Rosińska D., Belczyński K., 2011, MNRAS, 413, 461
- Özel et al. (2010) Özel F., Psaltis D., Narayan R., McClintock J. E., 2010, ApJ, 725, 1918
- Paczynski (1976) Paczynski B., 1976, in Eggleton P., Mitton S., Whelan J., eds, Vol. 73, Structure and Evolution of Close Binary Systems. p. 75
- Paczynski (1992) Paczynski B., 1992, Acta Astron., 42, 145
- Paxton et al. (2011) Paxton B., Bildsten L., Dotter A., Herwig F., Lesaffre P., Timmes F., 2011, ApJS, 192, 3
- Paxton et al. (2013) Paxton B., et al., 2013, ApJS, 208, 4
- Paxton et al. (2015) Paxton B., et al., 2015, ApJS, 220, 15
- Paxton et al. (2018) Paxton B., et al., 2018, ApJS, 234, 34
- Paxton et al. (2019) Paxton B., et al., 2019, ApJS, 243, 10
- Perna et al. (2021) Perna R., Tagawa H., Haiman Z., Bartos I., 2021, ApJ, 915, 10
- Peters & Mathews (1963) Peters P. C., Mathews J., 1963, Physical Review, 131, 435
- Pfahl et al. (2003) Pfahl E., Rappaport S., Podsiadlowski P., 2003, ApJ, 597, 1036
- Podsiadlowski et al. (2003) Podsiadlowski P., Rappaport S., Han Z., 2003, MNRAS, 341, 385
- Price et al. (1971) Price R. E., Groves D. J., Rodrigues R. M., Seward F. D., Swift C. D., Toor A., 1971, ApJ, 168, L7
- Pylyser & Savonije (1988) Pylyser E., Savonije G. J., 1988, A&A, 191, 57
- Rappaport et al. (1983) Rappaport S., Verbunt F., Joss P. C., 1983, ApJ, 275, 713
- Reig (2011) Reig P., 2011, Ap&SS, 332, 1
- Ritter (2008) Ritter H., 2008, New Astron. Rev., 51, 869
- Robson et al. (2019) Robson T., Cornish N. J., Liu C., 2019, Classical and Quantum Gravity, 36, 105011
- Rodríguez Castillo et al. (2020) Rodríguez Castillo G. A., et al., 2020, ApJ, 895, 60
- Sasano et al. (2014) Sasano M., Makishima K., Sakurai S., Zhang Z., Enoto T., 2014, PASJ, 66, 35
- Shakura & Sunyaev (1973) Shakura N. I., Sunyaev R. A., 1973, A&A, 500, 33
- Shao & Li (2012) Shao Y., Li X.-D., 2012, ApJ, 756, 85
- Shao & Li (2014) Shao Y., Li X.-D., 2014, ApJ, 796, 37
- Shao & Li (2015) Shao Y., Li X.-D., 2015, ApJ, 809, 99
- Shao & Li (2019) Shao Y., Li X.-D., 2019, ApJ, 885, 151
- Shao & Li (2021) Shao Y., Li X.-D., 2021, ApJ, 920, 81
- Smith et al. (1978) Smith L. F., Biermann P., Mezger P. G., 1978, A&A, 66, 65
- Soberman et al. (1997) Soberman G. E., Phinney E. S., van den Heuvel E. P. J., 1997, A&A, 327, 620
- Takahashi & Ohsuga (2017) Takahashi H. R., Ohsuga K., 2017, ApJ, 845, L9
- Tanaka & Shibazaki (1996) Tanaka Y., Shibazaki N., 1996, ARA&A, 34, 607
- Tauris & van den Heuvel (2006) Tauris T. M., van den Heuvel E. P. J., 2006, Formation and evolution of compact stellar X-ray sources. Cambridge University Press, Cambridge, UK, pp 623–665
- Tauris et al. (2000) Tauris T. M., van den Heuvel E. P. J., Savonije G. J., 2000, ApJ, 530, L93
- The LIGO Scientific Collaboration et al. (2021) The LIGO Scientific Collaboration et al., 2021, arXiv e-prints, p. arXiv:2111.03606
- Thompson et al. (2019) Thompson T. A., et al., 2019, Science, 366, 637
- Timmes et al. (1996) Timmes F. X., Woosley S. E., Weaver T. A., 1996, ApJ, 457, 834
- Townsend et al. (2017) Townsend L. J., Kennea J. A., Coe M. J., McBride V. A., Buckley D. A. H., Evans P. A., Udalski A., 2017, MNRAS, 471, 3878
- Trudolyubov et al. (2007) Trudolyubov S. P., Priedhorsky W. C., Córdova F. A., 2007, ApJ, 663, 487
- Tsygankov et al. (2016) Tsygankov S. S., Mushtukov A. A., Suleimanov V. F., Poutanen J., 2016, MNRAS, 457, 1101
- Van et al. (2019) Van K. X., Ivanova N., Heinke C. O., 2019, MNRAS, 483, 5595
- Verbunt et al. (1990) Verbunt F., Wijers R. A. M. J., Burm H. M. G., 1990, A&A, 234, 195
- Wang (1996) Wang Y. M., 1996, ApJ, 465, L111
- Wang & Liu (2020) Wang B., Liu D., 2020, Research in Astronomy and Astrophysics, 20, 135
- Wang et al. (2016) Wang C., Jia K., Li X.-D., 2016, Research in Astronomy and Astrophysics, 16, 126
- Webb et al. (2000) Webb N. A., Naylor T., Ioannou Z., Charles P. A., Shahbaz T., 2000, MNRAS, 317, 528
- Webbink (1984) Webbink R. F., 1984, ApJ, 277, 355
- Wen (2003) Wen L., 2003, ApJ, 598, 419
- Woosley & Heger (2021) Woosley S. E., Heger A., 2021, ApJ, 912, L31
- Wyrzykowski & Mandel (2020) Wyrzykowski Ł., Mandel I., 2020, A&A, 636, A20
- Xu & Li (2010) Xu X.-J., Li X.-D., 2010, ApJ, 716, 114
- Xu & Li (2017) Xu K., Li X.-D., 2017, ApJ, 838, 98
- Yalinewich et al. (2018) Yalinewich A., Beniamini P., Hotokezaka K., Zhu W., 2018, MNRAS, 481, 930
- Yamaguchi et al. (2018) Yamaguchi M. S., Kawanaka N., Bulik T., Piran T., 2018, ApJ, 861, 21
- Zhu et al. (2021) Zhu J.-P., Yang Y.-P., Zhang B., Liu L.-D., Yu Y.-W., Gao H., 2021, ApJ, 914, L19
- van Paradijs (1996) van Paradijs J., 1996, ApJ, 464, L139
- van den Eijnden et al. (2018) van den Eijnden J., Degenaar N., Russell T. D., Wijnand s R., Miller-Jones J. C. A., Sivakoff G. R., Hernández Santisteban J. V., 2018, Nature, 562, 233