Laboratory measurements of stretching band strengths of deuterated Quenched Carbonaceous Composites (D-QCC)
Abstract
The observed large variation in the abundance of deuterium (D) in the interstellar medium (ISM) suggests that a significant fraction of D may be depleted into polycyclic aromatic hydrocarbons (PAHs). Signatures of the deuteration of PAHs are expected to appear most clearly through the C−D stretching modes at 4.4–4.7 m, whose strengths in emission spectra relative to those of the C−H stretching modes at 3.3–3.5 m provide the relative abundance of D to hydrogen (H) in PAHs, once we have accurate relative band strengths of both stretching modes. We report experimental results of the band strengths of the C−D stretching modes relative to the C−H stretching modes. We employ a laboratory analog of interstellar carbonaceous dust, Quenched Carbonaceous Composite (QCC), and synthesize deuterated QCC (D-QCC) by replacing the QCC starting gas of CH4 with mixtures of CH4 and CD4 with various ratios. Infrared spectra of D-QCC are taken to estimate the relative band strengths of the stretching modes, while the D/H ratios in the D-QCC samples are measured with a nanoscale secondary ion mass spectrometer. We obtain relative strength of aromatic and aliphatic C−D to C−H stretches as and per D/H, respectively. The ratio for the aromatic stretches is in good agreement with the results of theoretical calculations, while that for the aliphatic stretches is smaller than for the aromatic stretches. The present results do not significantly change the D/H ratios in the interstellar PAHs that have previously been estimated from observed spectra.
1 Introduction
Deuterium (D) is one of the elements that was created in the first minutes folllowing the Big Bang, and its primordial abundance depends sensitively on the cosmological parameters (Boesgaard & Steigman, 1985). After its creation, D has been destroyed by nuclear reactions in the stellar interior, a process that is termed as astration. Its abundance is predicted to decrease monotonically, along with the chemical evolution of the galaxy (e.g., Mazzitelli & Moretti, 1980). Therefore, the present-day abundance of D is supposed to be directly linked to the primordial nucleosynthesis and the subsequent chemical evolution of the galaxy. However, the observed ratio of D to hydrogen (H), D/H, in the galaxy shows a large scatter, with no clear correlation with the metallicity (Linsky et al., 2006), which cannot be explained solely by the chemical evolution (Tosi, 2010). Linsky et al. (2006) further show observational evidence that D may be depleted onto dust grains in the interstellar medium (ISM), as originally suggested by Jura (1982). Recent observations of distant quasars suggest that the primordial abundance of D relative to hydrogen [D/H]prim is about 25 ppm (Cooke et al., 2018; Zavarygin et al., 2018), while a Bayesian analysis of the observations of D in the ISM suggests that the maximum and minimum D/H ratios are and ppm, respectively, for a top-hat distribution (Prodanović et al., 2010). These ISM values suggest that the decrease in D abundance due to the astration is about 5 ppm, and that D/H of about 13 ppm is required to be depleted onto interstellar grains at maximum.
Draine (2006) has proposed that the major reservoir of D in the ISM could be found in polycyclic aromatic hydrocarbons (PAHs). PAHs are thought to be the species that emit in a series of the emission bands in the near- to mid-infrared (Tielens, 2008; Li, 2020), which are ubiquitously observed in the ISM (e.g., Mattila et al., 1996; Onaka et al., 1996; Tsumura et al., 2013). Small PAH molecules have been detected by recent radio observations with high sensitivity (Burkhardt et al., 2021; McGuire et al., 2021; Cernicharo et al., 2021, and references therein). D enrichment is observed in interplanetary dust particles and is thought to originate in processes in interstellar clouds (Messenger, 2000). Sandford et al. (2001) have discussed several interstellar processes for the D enrichment in PAHs (see also Wiersma et al., 2020, for recent references). Assuming that the carbon (C) to total H ratio, C/H, in interstellar grains is about 200 ppm, and that 85% of carbon atoms are in the aromatic form, with H/C = 0.35 (Pendleton & Allamandola, 2002), 60 ppm of H should reside in aromatic grains at maximum. Note that H/C = 0.35 is an upper limit, based on small PAHs. It is close to 0.25 for large PAHs, and the value of 60 ppm is thus an upper limit. Therefore, if PAHs are a major reservoir of interstellar D, then the maximum D/H in PAHs will be about 0.2–0.3 (Draine, 2006; Onaka et al., 2014).
The signatures of the deuteration of PAHs should appear as shift in the wavelengths of their vibrational modes involving C−D bonds (Bauschlicher et al., 1997). Aromatic and aliphatic C−H stretching modes at 3.3 and 3.4–3.5 m shift to around 4.4 and 4.6–4.8 m, when deuterated, respectively (e.g., Buragohain et al., 2020). These C−D stretching modes are suggested to be the most promising features for the unambiguous detection of the deuteration, since this spectral region is free from other PAH features (Hudgins et al., 2004; Allamandola et al., 2021). Verstraete et al. (1996) report the detection of an emission feature at 4.65 m with a 4.4 level in M17, based on observations with the Short Wavelength Spectrometer onboard the Infrared Space Observatory, which can be attributed to the aliphatic C−D stretching vibration. Peeters et al. (2004) present the detection of emission bands at 4.4 and 4.65 m in the Orion Bar region, with 1.9 and 4.4 levels, respectively. By comparing their intensities with the corresponding C−H stretching features at 3.3–3.5 m, they estimate the D/H ratio as being and in PAHs for the Orion Bar and M17, respectively. These ratios are close to the value predicted by D depletion into PAHs in the ISM. Onaka et al. (2014), on the other hand, report that the ratios of the features in 4.4–4.7 m compared to those in 3.3–3.5 m are smaller by an order of magnitude in the Orion Bar, M17, and the reflection nebula G18.14.0, based on observations with AKARI. They estimate D/H as being 3% at most in interstellar PAHs, assuming a factor of a 0.57 difference in the cross section between fully deuterated (perdeuterated) and fully hydrogenated PAHs, based on Density Functional Theory (DFT) calculations (Bauschlicher et al., 1997) and different excitation conditions between the 3 and 4 m bands. Doney et al. (2016) further search for features between 4.4 and 4.8 m in AKARI spectra of H II regions, finding the features in only six Galactic sources out of 41.
Since the PAHs in the ISM are supposed to be only partially deuterated, the band strengths of the C−D stretching modes of PAHs with various D/H ratios are required to correctly estimate D/H from observed spectra. DFT calculations of singly deuterated and deuteronated PAHs of various kinds have been calculated, which indicate that the band strength ratio of the C−D to C−H stretches per unit bond varies with the PAH size (Buragohain et al., 2015, 2016, 2020). Yang et al. (2020, 2021) estimate the average band strength ratio of aromatic C−D to C−H stretching modes as , based on DFT calculations of a number of monodeuterated and multideuterated neutral PAHs of relatively small size. With the average value, they estimate that the degree of deuteration of PAHs (the fraction of peripheral atoms attached to carbon atoms in the form of D) is %.
Laboratory measurements of infrared spectra have only been made for perdeuterated PAHs (Hudgins et al., 1994; Bauschlicher et al., 1997; Yang et al., 2020). In this paper, we experimentally investigate the effect on the band intensities of partial deuteration by using a laboratory organic dust analog, Quenched Carbonaceous Composite (QCC). QCC is an organic material synthesized from methane (CH4) plasma, which shows the infrared spectrum that reproduces the observed emission features from 3 to 14 m fairly well (Sakata et al., 1984, 1987, 1990). By replacing the starting gas of CH4 with mixtures of CH4 and CD4 with various ratios, we synthesize partially deuterated QCCs with different D/H contents (hereafter called D-QCCs). The actual content of D relative to H in a D-QCC is measured by a nanoscale secondary ion mass spectrometer (NanoSIMS), and the intensity ratio of the bands in 4.4–4.7 m to 3.3–3.5 m is compared with the D/H ratio in the sample.
2 Experiment method and results
The experimental method for producing D-QCC is the same as that for synthesizing QCC (Sakata et al., 1983) except that the starting gas of CH4 is replaced by mixtures of CH4 and CD4 with various ratios. A similar method has been employed to study the effect of the 13C isotope in QCC (Wada et al., 2003). The starting gas is introduced into a vacuum chamber and applied by a microwave discharge, to produce plasma. The plasma gas is quenched in the quartz tube, and the product (D-QCC) is collected on KBr and Si substrates in the tube. We use the starting gases with CD4 fractions of 0.0 (fully CH4 gas), 19.7, 38.8, 79.4, and 100.0% (fully CD4 gas). We designate the products QCC, D-QCC20, D-QCC40, D-QCC80, and D-QCC100, respectively, in the following.
2.1 Infrared band measurement
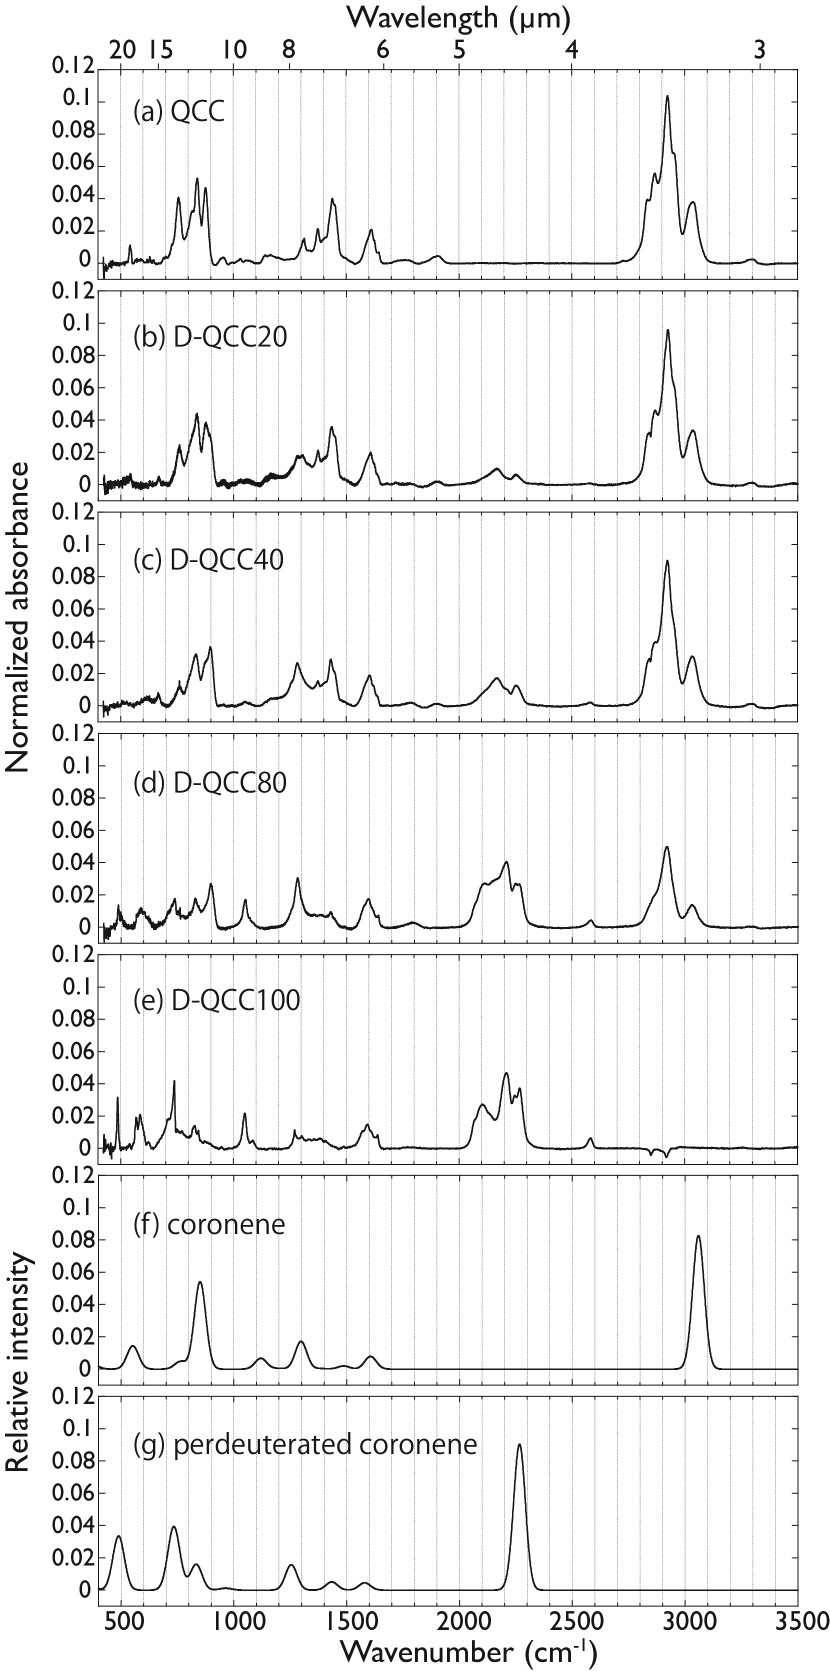
Infrared spectra of QCC and D-QCC were measured using the sample collected on the KBr substrate for the range 400–3500 cm-1 (2.9–25 m), with a resolution of 2 cm-1 by the Fourier Transform Infrared Spectroscopy (FT-IR) spectrometer IFS 125 of Bruker Optics. The infrared spectrum of a blank KBr substrate was taken for each measurement, to be used as a reference. All the measurements were carried out over an area with a diameter of 5 mm of the substrate. The transmission spectra were converted into absorbance spectra, after being divided by the reference spectra. A spline function was fit to the continuum component of each absorbance spectrum, and subtracted to extract the band features. The thickness of D-QCC was not the same for all the samples. The absorbance spectra are normalized by the integrated band strength of the feature at 1610 cm-1 (6.2 m), which is attributed to a C−C vibration and is not supposed to be affected directly by deuteration. The normalization is made only for the illustrative purposes, to indicate the relative variation of each feature. The resultant spectra are shown in Figure 1. The results of the DFT calculations for coronene (C24H12) and perdeuterated coronene (C24D12) (e.g., Buragohain et al., 2015) are also shown, as reference for the identification of the features associated with D. The DFT spectra are smoothed with a FWHM of 60 cm-1 for the illustrative purposes.
Figure 1 shows that the C−H stretching features at 2770–3110 cm-1 (3.2–3.6 m) gradually decrease with the increase of the fraction of D in D-QCC, while new features appear at 2000–2350 cm-1 (4.25–5.0 m), which are attributed to C−D stretching modes, indicated by the spectra of coronene and perdeuterated coronene. The features in the range 1200–1700 cm-1 (5.9–8.3 m) are relatively unchanged by deuteration, as expected, although their relative intensities vary with the fraction of D. For the frequency range lower than 1000 cm-1 ( m), the appearance of the features becomes complex, as suggested by theoretical calculations (e.g., Hudgins et al., 2004; Allamandola et al., 2021), making it difficult to extract reliable information regarding deuterated PAHs. There are a few features that are only seen in D-QCC80 and D-QCC100, which have corresponding features in perdeuterated coronene, e.g., at around 500 and 700 cm-1 (20 and 14 m), respectively, but they appear to be faint in D-QCCs with lower D/H.
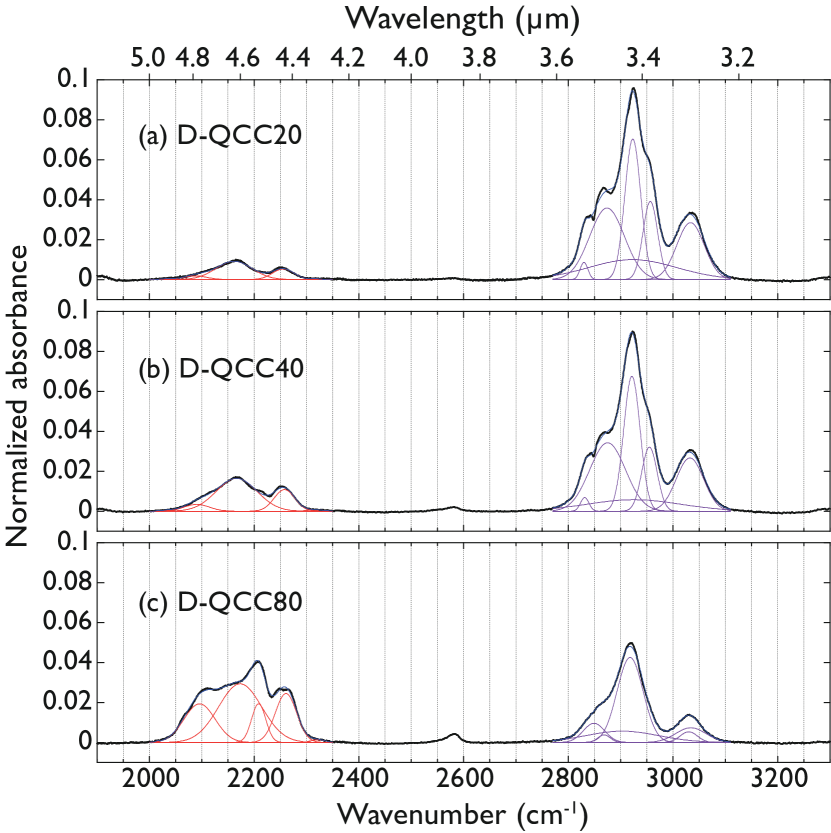
While the features around 3.3 and 4.4 m are attributed to aromatic C−H and C−D stretching modes, those at 3.4–3.5 and 4.6–4.8 m are ascribed to the stretching modes of aliphatic side-groups of C−H and C−D, respectively (e.g., Buragohain et al., 2020). Since the band ratios of the C−H and C−D stretches could be different between aromatic and aliphatic stretches, we analyze the aromatic and aliphatic stretches separately. The features in 2000–2350 cm-1 (4.25–5.0 m) and 2770–3110 cm-1 (3.2–3.6 m) in the absorbance spectra are decomposed into five to six Gaussians, as shown in Figure 2. The Gaussian components whose central frequencies are located between 2000–2250 cm-1 (4.4–5.0 m) and 2770–3000 cm-1 (3.3–3.6 m) are assigned to aliphatic bonds of C−D and C−H stretching modes, while those with the central frequencies between 2250–2350 cm-1 (4.25–4.4 m) and 3000–3110 cm-1 (3.2–3.3 m) are attributed to aromatic bonds of the C−D and C−H stretching modes, respectively. Note that only one Gaussian is used to fit the aromatic stretches for both the aromatic C−H and C−D bonds. Figure 2 shows that the decomposition is good (errors %) and that the separation of aliphatic from aromatic bonds is made unambiguously. We sum up the integrated strength of each Gaussian and estimate the band strength ratios of the C−D to C−H stretching modes for the aromatic and aliphatic bonds separately. The C−D to C−H band strengths ratios are separately summarized for aromatic and aliphatic components in Table 1. The spectrum of D-QCC80 appears to be notably different from those of D-QCC20 and D-QCC40 for wavenumbers of 2000–2250 cm-1, whose range corresponds to aliphatic C−D stretching vibrations. We surmise that the difference originates from an increase in the combinations of symmetric and asymmetric aliphatic C−D stretching vibrations, since a large fraction of H in the aliphatic bonds is replaced by D in D-QCC80.
2.2 D/H measurement
The D/H ratio of the sample on the Si substrate was measured with the Cameca NanoSIMS 50 ion microprobe at the Atmosphere and Ocean Research Institute, University of Tokyo. The radius and thickness of the Si substrate were 5 mm and 0.7 mm, respectively. We employed a coronene (C24H12) sample that had a known D/H ratio (D relative to the Vienna Standard Mean Ocean Water (VSMOW) equal to %) for the calibration. The sample and the coronene were measured under the same experimental conditions. We also measured a blank Si substrate to determine the blank level. The blank hydrogen level was less than 1% of the sample level. The sample was presputtered for a 20 20 m area, with a Cs+ beam of 200 pA, to remove contamination on the surface. Then, the measurements of H- and D- were carried out for the central area of a 5 5 m with a beam of 2.5 pA, for 200 s ,to obtain the D/H ratio. Since the size of the NanoSIMS measurement area was small compared to the infrared spectroscopy, we selected positions that produced sufficient signals over a region of a similar size to the infrared measurements, then took the average. Four positions distributed over a mm diameter region were measured for each of the D-QCC samples. The variation of D/H was less than 10% among the measured positions, suggesting that D/H is fairly uniform over the sample and that the average value represents the D/H ratio of the sample reliably. The results are also summarized in Table 1. D-QCC20 has almost the same D/H ratio as that of the starting gas, while the D/H ratios of D-QCC40 and D-QCC80 are smaller than that of the starting gas, suggesting that D is incorporated into D-QCC less efficiently than H in the present synthesis process.
| Sample | C−D to C−H Band Strength Ratio | Gas D/H | D-QCC D/H | |
|---|---|---|---|---|
| Aliphatic Stretch | Aromatic Stretch | |||
| D-QCC20 | 0.245 | |||
| D-QCC40 | 0.634 | |||
| D-QCC80 | 3.85 | |||
3 Discussion
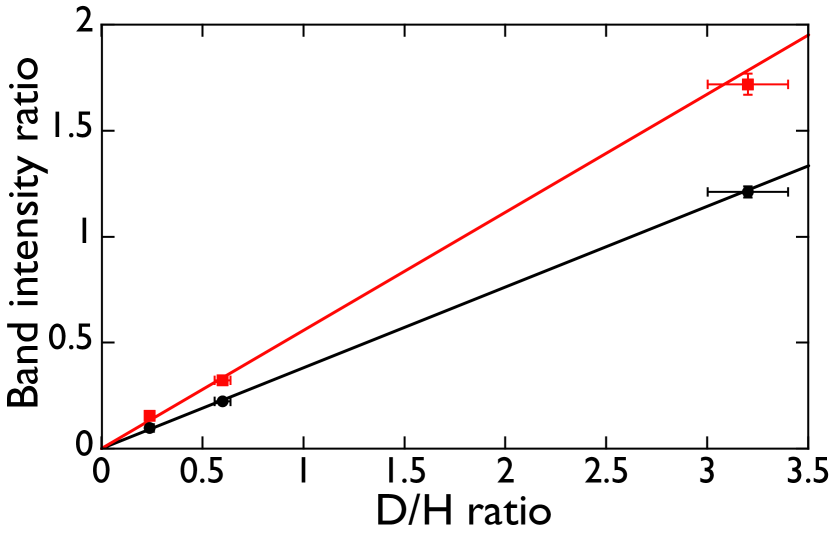
The band strength ratios of the C−D to C−H stretching modes are plotted against the D/H ratio of the sample in Figure 3. The data are well fitted with straight lines, which show the band strength per D/H as being and for the aromatic and aliphatic bonds, respectively. The value for the aromatic bonds is in good agreement with the theoretical value for perdeuterated PAHs of 0.57 (Bauschlicher et al., 1997) and the average ratios for monodeuterated and multideuterated neutral PAHs of (Yang et al., 2020, 2021). Therefore, the present experimental results will not change the conclusions of previous studies on the D fraction in the aromatic bonds. On the other hand, the present study indicates that the band strength ratios of the aliphatic bonds are about two-thirds of the ratios of the aromatic bonds. While Buragohain et al. (2020) discussed aliphatic C−D bands of several PAHs based on DFT calculations, no theoretical studies have so far been made for the band strength ratios of the aliphatic bonds. In this analysis, we simply assume that D is distributed among the aliphatic and aromatic bonds in the same fraction, i.e., the D/H ratio is the same for both bonds. The agreement of the experimental results for the aromatic bonds suggests that this assumption is not largely in error.
Astronomical observations detect larger excess emission attributable to the aliphatic C−D stretching modes at m compared to the aromatic C−D modes at m (Peeters et al., 2004; Onaka et al., 2014; Doney et al., 2016), suggesting that D may reside more in aliphatic bonds than in aromatic ones. Peeters et al. (2004) and Onaka et al. (2014) assume the same band ratio for both the aromatic and aliphatic bonds, and estimate the D/H ratio from the summation of the aromatic and aliphatic band intensities. In the following, we roughly estimate the D content in the aliphatic bonds, based on the AKARI observations of the Orion Bar, where the ratio of aliphatic C−D to C−H stretching features appears to be the largest among the three targets (Onaka et al., 2014).
Onaka et al. (2014) report that the band intensity ratios of the C−D to C−H stretching modes for the aromatic and aliphatic bonds are and , respectively, in the Orion Bar. The emission of the 3.3 m band requires higher excitation than that of the 4.4 m, the difference inf which depends on the size of the PAHs and the spectrum of the incident radiation field. Assuming that the relative band strength for the aromatic C−D to C−H stretches is 0.56, and that the difference in the excitation is about a factor of 1.75 between 4.4 and 3.3 m, as in Onaka et al. (2014), we then obtain D/H in the aromatic bonds as . A similar estimate for the aliphatic bonds results in D/H of , assuming a relative band strength of 0.38 for the aliphatic bonds, as obtained in the present study, and the same factor of the difference in the excitation efficiency as for the aromatic bonds. The number of C atoms in aliphatic units is estimated to be smaller than the number in aromatic units (e.g., Yang et al., 2016, 2017). Assuming an average ratio of the band strength of the aliphatic to aromatic C−H stretches of 1.76, estimated from various aliphatic side-groups (Yang et al., 2016), and the observed band ratio of the Orion Bar (0.36), we estimate that the H fraction in the aliphatic bonds in the Orion Bar is . The total D/H ratio of the aromatic and aliphatic bonds becomes , which is within the uncertainty of the D/H ratio of , estimated without separating the aromatic and aliphatic bonds. Therefore, the band strength ratio obtained in the present study does not change the D/H ratio estimated in previous studies. Note that these estimates do not include the uncertainties in the band strength ratios.
The present experiments were made with relatively high D/H ratios compared to those estimated from observations. The features of the C−D vibration modes become weak, and it is difficult to make an accurate experimental estimate for low-D/H samples. The good linearity seen in Figure 3 and the agreement of the numerical results with the DFT calculations for the band strength ratio of the aromatic bonds, suggest that the band strength ratios derived in the present experiments should also be valid even for low-D/H cases, and are applicable to interpretations of astronomical observations.
4 Summary
In the present study, we experimentally investigate the relative band strength ratios of the C−D to C−H stretching modes. By replacing the starting gas of CH4 with mixtures of CH4 and CD4 gas in the synthesis of QCC, which reproduces most of the observed emission features from 3 to 14 m (Sakata et al., 1984), we successfully produce partially deuterated QCC (D-QCC) with various D/H ratios. The D/H ratios of D-QCC are measured with the NanoSIMS. We estimate the band strength ratios for the aromatic and aliphatic bonds separately, both of which show a good linearlity with the D/H ratio. The band strength ratio for the aromatic bonds per D/H is found to be , which is in good agreement with numerical calculations of monodeuterated and multideuterated neutral PAHs of small sizes of 0.56–0.57 (Yang et al., 2020, 2021). The band ratio for the aliphatic bonds, on the other hand, shows a smaller ratio of . Since observed spectra suggest the dominance of aromatic bonds in the band carriers, the present results will not affect the D/H ratio in PAHs that has been previously estimated from observations. The present study confirms the conclusions of previous studies, that the D/H ratios in PAHs that emit at 3.3–3.5 m are small and that the missing D in the ISM cannot be explained by depletion into these PAHs (Onaka et al., 2014; Yang et al., 2021). The degree of deuteration of the PAHs depends on the environment (Allamandola et al., 2021). Most of the observed spectra of the 3.3–4.7 m emission features are taken toward photodissociation regions, where the gas temperature is relatively high. The missing D may be depleted into PAHs in colder regions, without a sufficient amount of ultraviolet photons, where the emission of 3.3–4.7 m is not excited efficiently. The features of deuterated PAHs at longer wavelengths may have to be investigated. However, the present study also confirms that the features of deuterated PAHs at longer wavelengths are confused with other PAH features, as predicted, and suggests that their unambiguous detection requires highly sensitive spectroscopy, because the features unique to D at 14–20 m appear to be faint for low-D/H ratios.
References
- Allamandola et al. (2021) Allamandola, L. J., Boersma, C., Lee, T. J., Bregman, J. D., & Temi, P. 2021, ApJ, 917, L35
- Bauschlicher et al. (1997) Bauschlicher, C. W., Langhoff, S. R., Sandford, S. A., & Hudgins, D. M. 1997, Journal of Physical Chemistry A, 101, 2414
- Boesgaard & Steigman (1985) Boesgaard, A. M., & Steigman, G. 1985, ARA&A, 23, 319
- Buragohain et al. (2020) Buragohain, M., Pathak, A., Sakon, I., & Onaka, T. 2020, ApJ, 892, 11
- Buragohain et al. (2015) Buragohain, M., Pathak, A., Sarre, P., Onaka, T., & Sakon, I. 2015, MNRAS, 454, 193
- Buragohain et al. (2016) —. 2016, Planet. Space Sci., 133, 97
- Burkhardt et al. (2021) Burkhardt, A. M., Loomis, R. A., Shingledecker, C. N., et al. 2021, NatAs, 5, 181
- Cernicharo et al. (2021) Cernicharo, J., Agúndez, M., Kaiser, R. I., et al. 2021, A&A, 652, L9
- Cooke et al. (2018) Cooke, R. J., Pettini, M., & Steidel, C. C. 2018, ApJ, 855, 102
- Doney et al. (2016) Doney, K. D., Candian, A., Mori, T., Onaka, T., & Tielens, A. G. G. M. 2016, A&A, 586, A65
- Draine (2006) Draine, B. T. 2006, in Astronomical Society of the Pacific Conference Series, Vol. 348, Astrophysics in the Far Ultraviolet: Five Years of Discovery with FUSE, ed. G. Sonneborn, H. W. Moos, & B. G. Andersson, 58
- Hudgins et al. (2004) Hudgins, D. M., Bauschlicher, C. W., J., & Sandford, S. A. 2004, ApJ, 614, 770
- Hudgins et al. (1994) Hudgins, D. M., Sandford, S. A., & Allamandola, L. J. 1994, JPhCh, 98, 4243
- Jura (1982) Jura, M. 1982, in NASA Conference Publication, Vol. 2238, NASA Conference Publication, ed. Y. Kondo, 54–60
- Li (2020) Li, A. 2020, NatAs, 4, 339
- Linsky et al. (2006) Linsky, J. L., Draine, B. T., Moos, H. W., et al. 2006, ApJ, 647, 1106
- Mattila et al. (1996) Mattila, K., Lemke, D., Haikala, L. K., et al. 1996, A&A, 315, L353
- Mazzitelli & Moretti (1980) Mazzitelli, I., & Moretti, M. 1980, ApJ, 235, 955
- McGuire et al. (2021) McGuire, B. A., Loomis, R. A., Burkhardt, A. M., et al. 2021, Science, 371, 1265
- Messenger (2000) Messenger, S. 2000, Nature, 404, 968
- Onaka et al. (2014) Onaka, T., Mori, T. I., Sakon, I., et al. 2014, ApJ, 780, 114
- Onaka et al. (1996) Onaka, T., Yamamura, I., Tanabe, T., Roellig, T. L., & Yuen, L. 1996, PASJ, 48, L59
- Peeters et al. (2004) Peeters, E., Allamandola, L. J., Bauschlicher, C. W., J., et al. 2004, ApJ, 604, 252
- Pendleton & Allamandola (2002) Pendleton, Y. J., & Allamandola, L. J. 2002, ApJS, 138, 75
- Prodanović et al. (2010) Prodanović, T., Steigman, G., & Fields, B. D. 2010, MNRAS, 406, 1108
- Sakata et al. (1983) Sakata, A., Wada, S., Okutsu, Y., Shintani, H., & Nakada, Y. 1983, Nature, 301, 493
- Sakata et al. (1987) Sakata, A., Wada, S., Onaka, T., & Tokunaga, A. T. 1987, ApJ, 320, L63
- Sakata et al. (1990) —. 1990, ApJ, 353, 543
- Sakata et al. (1984) Sakata, A., Wada, S., Tanabe, T., & Onaka, T. 1984, ApJ, 287, L51
- Sandford et al. (2001) Sandford, S. A., Bernstein, M. P., & Dworkin, J. P. 2001, \maps, 36, 1117
- Tielens (2008) Tielens, A. G. G. M. 2008, ARA&A, 46, 289
- Tosi (2010) Tosi, M. 2010, in Proc. IAU Symp. 268, Light Elements in the Universe, ed. C. Charbonnel, M. Tosi, F. Primas, & C. Chiappini, (Cambridge: Cambridge Univ. Press), 153
- Tsumura et al. (2013) Tsumura, K., Matsumoto, T., Matsuura, S., et al. 2013, PASJ, 65, 120
- Verstraete et al. (1996) Verstraete, L., Puget, J. L., Falgarone, E., et al. 1996, A&A, 315, L337
- Wada et al. (2003) Wada, S., Onaka, T., Yamamura, I., Murata, Y., & Tokunaga, A. T. 2003, A&A, 407, 551
- Wiersma et al. (2020) Wiersma, S. D., Candian, A., Bakker, J. M., et al. 2020, A&A, 635, A9
- Yang et al. (2017) Yang, X. J., Glaser, R., Li, A., & Zhong, J. X. 2017, New A Rev., 77, 1
- Yang et al. (2020) Yang, X. J., Li, A., & Glaser, R. 2020, ApJS, 251, 12
- Yang et al. (2016) Yang, X. J., Li, A., Glaser, R., & Zhong, J. X. 2016, ApJ, 825, 22
- Yang et al. (2021) Yang, X. J., Li, A., He, C. Y., & Glaser, R. 2021, ApJS, 255, 23
- Zavarygin et al. (2018) Zavarygin, E. O., Webb, J. K., Dumont, V., & Riemer-Sørensen, S. 2018, MNRAS, 477, 5536