Anisotropy of Halo Main Sequence Turnoff Stars Measured with New MMT Radial Velocities and Gaia Proper Motions
Abstract
We measure the anisotropy of the Milky Way stellar halo traced by a dense sample of mag F-type main sequence turnoff stars using Gaia eDR3 proper motions and new radial velocity measurements published here.
1 Introduction
The motions of stars are determined by the Milky Way’s gravitational potential and provide a measure of its mass distribution. Many tools exist to analyze stellar velocity distributions. The anisotropy parameter, , is a summary statistic of the ratio of tangential to radial random motion (Binney, 1980). A system of stars with purely radial orbits has ; a system with purely circular orbits has . Theoretical simulations demonstrate that changes in in the stellar halo can be a sensitive probe of both recent interactions with satellites and ancient major mergers (Loebman et al., 2018).
Our previous work, based on radial velocities of F-type main sequence turnoff stars in the halo, found evidence for a surprising dip in anisotropy around kpc (King et al., 2015) similar to that found by Kafle et al. (2012) for blue horizontal branch stars. Gaia now provides precise proper motions for these stars. Gaia-based studies of nearby solar neighborhood stars (Helmi et al., 2018) and distant blue horizontal branch (BHB) stars (Belokurov et al., 2018) conclude that the Milky Way has a two-component inner halo, and that radially anisotropic stars arrived from a major merger event around 10 Gyr ago. Main sequence turnoff stars are less luminous than evolved or giant stars, but provide a much denser tracer at kpc distances.
We revisit our original result using Gaia proper motions and new radial velocity measurements presented here.
2 Measurements
As described in King et al. (2015), we select mag F-type stars using extinction-corrected colors from the Sloan Digital Sky Survey. We obtain spectra for 4,022 new stars at the 6.5m MMT telescope with the Hectospec spectrograph between 2015 September and 2017 April, of which 2,851 satisfy our S/N4 per pixel quality threshold. We measure radial velocities using the RVSAO cross-correlation package. The median uncertainty is 18 km s-1 at the median mag.
We also make use of F-type stars published in the SDSS Stellar Parameter Pipeline catalog (Allende Prieto et al., 2008). This catalog is relatively shallow; the entire catalog is brighter than the median mag of the Hectospec sample.
We obtain proper motions and their covariances from Gaia eDR3 (Lindegren et al., 2021). We impose quality thresholds recommended by the Gaia Collaboration, ruwe 1.4 being the most important. The mean proper motion error at mag corresponds to a tangential velocity error km s-1 if distance error is zero. Parallax provides no meaningful constraint for our stars, so we estimate distances using the photometric parallax relation of Ivezić et al. (2008) and Bond et al. (2010). Statistical distance errors are 15%.
We transform measurements to the Galactic coordinate frame assuming the Sun is located at kpc, the local circular velocity is 235 km s-1, and the local standard of rest motion of Schönrich et al. (2010). We then impose 5 kpc to remove all significant disk contamination, leaving us with a sample of 17,221 halo F-type stars. We note that the Sgr stream lies beyond our sample depth, and does not enter into our sample.
3 Results
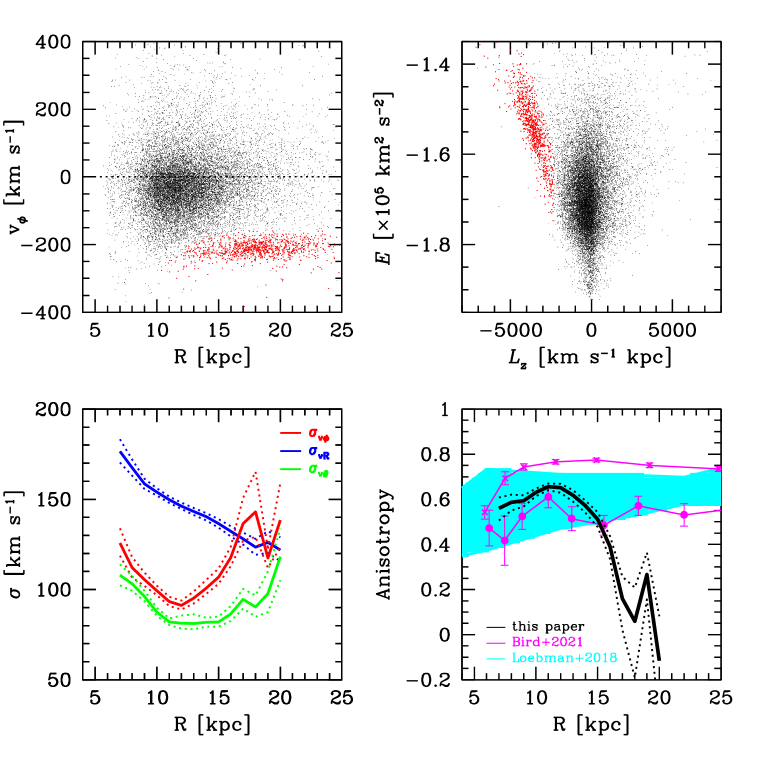
The measured distributions of velocity components are similar to our previous work with one exception: we find an unexpected group of stars with thin disk azimuthal velocity km s-1 that dominates our sample by number around kpc (Figure 1). These stars are located in the Galactic anti-center at latitudes. This is the ACS/Mon halo structure (Xu et al., 2015; Morganson et al., 2016). We consider orbital energy and angular momentum per unit mass using the gravitational potential of Kenyon et al. (2014), and find that the ACS/Mon stars have km s-1 kpc-1 within km2 s-2 (red dots in Figure 1).
We compute mean velocities and velocity dispersions by partitioning the full sample into 2 kpc wide bins in Galactocentric radius . We estimate errors from bootstrap re-sampling times using the full covariance matrix of observational errors. The mean radial and longitudinal velocities are consistent with zero, as expected, although the mean azimuthal velocity, km s-1, is slightly prograde. The velocity covariances are consistent with zero. The tilt angles of the velocity ellipsoid are closely aligned with the spherical coordinate system.
The lower panels of Figure 1 plot the velocity dispersions and the anisotropy of our full sample. In the range kpc, the ACS/Mon stars artificially increase the computed azimuthal velocity dispersion , and decrease the anisotropy (Figure 1). Other samples that include stars in the Galactic anti-center region with may be similarly affected, depending on the relative number of stars from that region of sky.
In the range kpc, the mean anisotropy, , of our halo F-type stars is consistent with BHB stars (lower magenta line) but is more tangential than the measured for K giants (upper magenta line) (Bird et al., 2021). For comparison, Loebman et al. (2018) compute theoretical profiles for various accretion-only and cosmological hydrodynamic simulations. All of the simulations predict a radial anisotropy (cyan band) consistent with our result for kpc.
We provide the 2,851 new radial velocities as Data Behind the Figure.
References
- Allende Prieto et al. (2008) Allende Prieto, C., Sivarani, T., Beers, T. C., et al. 2008, AJ, 136, 2070, doi: 10.1088/0004-6256/136/5/2070
- Belokurov et al. (2018) Belokurov, V., Erkal, D., Evans, N. W., Koposov, S. E., & Deason, A. J. 2018, MNRAS, 478, 611, doi: 10.1093/mnras/sty982
- Binney (1980) Binney, J. 1980, MNRAS, 190, 873, doi: 10.1093/mnras/190.4.873
- Bird et al. (2021) Bird, S. A., Xue, X.-X., Liu, C., et al. 2021, ApJ, 919, 66, doi: 10.3847/1538-4357/abfa9e
- Bond et al. (2010) Bond, N. A., Ivezić, Ž., Sesar, B., et al. 2010, ApJ, 716, 1, doi: 10.1088/0004-637X/716/1/1
- Helmi et al. (2018) Helmi, A., Babusiaux, C., Koppelman, H. H., et al. 2018, Nature, 563, 85, doi: 10.1038/s41586-018-0625-x
- Ivezić et al. (2008) Ivezić, Ž., et al. 2008, ApJ, 684, 287, doi: 10.1086/589678
- Kafle et al. (2012) Kafle, P. R., Sharma, S., Lewis, G. F., & Bland-Hawthorn, J. 2012, ApJ, 761, 98, doi: 10.1088/0004-637X/761/2/98
- Kenyon et al. (2014) Kenyon, S. J., Bromley, B. C., Brown, W. R., & Geller, M. J. 2014, ApJ, 793, 122, doi: 10.1088/0004-637X/793/2/122
- King et al. (2015) King, III, C., Brown, W. R., Geller, M. J., & Kenyon, S. J. 2015, ApJ, 813, 89, doi: 10.1088/0004-637X/813/2/89
- Lindegren et al. (2021) Lindegren, L., Klioner, S. A., Hernández, J., et al. 2021, A&A, 649, A2, doi: 10.1051/0004-6361/202039709
- Loebman et al. (2018) Loebman, S. R., Valluri, M., Hattori, K., et al. 2018, ApJ, 853, 196, doi: 10.3847/1538-4357/aaa0d6
- Morganson et al. (2016) Morganson, E., Conn, B., Rix, H.-W., et al. 2016, ApJ, 825, 140, doi: 10.3847/0004-637X/825/2/140
- Schönrich et al. (2010) Schönrich, R., Binney, J., & Dehnen, W. 2010, MNRAS, 403, 1829, doi: 10.1111/j.1365-2966.2010.16253.x
- Xu et al. (2015) Xu, Y., Newberg, H. J., Carlin, J. L., et al. 2015, ApJ, 801, 105, doi: 10.1088/0004-637X/801/2/105