On Demographic Bias in Fingerprint Recognition
Abstract
Fingerprint recognition systems have been deployed globally in numerous applications including personal devices, forensics, law enforcement, banking, and national identity systems. For these systems to be socially acceptable and trustworthy, it is critical that they perform equally well across different demographic groups. In this work, we propose a formal statistical framework to test for the existence of bias (demographic differentials) in fingerprint recognition across four major demographic groups (white male, white female, black male, and black female) for two state-of-the-art (SOTA) fingerprint matchers operating in verification and identification modes. Experiments on two different fingerprint databases (with 15,468 and 1,014 subjects) show that demographic differentials in SOTA fingerprint recognition systems decrease as the matcher accuracy increases and any small bias that may be evident is likely due to certain outlier, low-quality fingerprint images.
1 Introduction
Fingerprint recognition systems have shown impressive recognition accuracy in recent years [1]. Consequently, they are now deployed across applications ranging from mobile phone unlock [2] to large-scale national identity systems [3]. However, there is a growing debate about whether biometric systems are fair and equitable. Though there is no clarity yet on the precise definition of fairness, a general consensus is that biometric systems must exhibit similar recognition accuracy across various demographic groups.
Fairness111In this study, we use the term fairness in the limited context of absence of demographic bias or existence of demographic parity. in biometric systems is quantified in terms of demographic differentials in the error rates of the system [4]. According to [5], American airports processed biometric data of over 9 million international travelers in the first six months of 2021. At this scale of operation, even small differentials in the performance across groups may bear significant consequence for individual users as well as organizations that operate such systems. Hence, evaluating the fairness of biometric systems and mitigating any hidden bias is critical for public trust and social acceptance.
| Demographic Group | Database | Database | ||
| # of subjects | approx.% of database | # of subjects | approx.% of database | |
|
|
762 | 5 | 172 | 17 |
|
|
5,594 | 36 | 77 | 8 |
|
|
1,195 | 8 | 462 | 45 |
|
|
7,917 | 51 | 303 | 30 |
-
*
The datasets and are not available in the public domain due to privacy concerns. It is difficult to obtain large-scale fingerprint databases with demographic information in the public domain.
In the last decade, face recognition systems have come under scrutiny for exhibiting racial and gender bias [6, 7, 8, 9, 4]. Several academic publications and media reports have claimed that female and black individuals suffer from lower face detection and recognition accuracies compared to male and white individuals. These claims are a cause of concern due to the proliferation of face recognition systems that have the ability to capture faces at a distance in a covert manner. On the flip side, it has been argued that these criticisms are not justifiable because the claimed differences in face recognition accuracy across demographic groups are not significant. Unlike scientific publications [4], commonplace media claims about bias in face recognition often fail to account for rapid progress in facial recognition algorithms in the past 10 years - labelling a system “racist” based on evaluations done more than a decade ago [10, 11].
Leaving aside specific claims and counterclaims about the fairness of facial recognition technology, any evaluation of fairness in biometric systems must be based on state-of-the-art (SOTA) recognition technology and objectively rely on sound analysis as opposed to public sentiment [12]. Of the existing literature on fairness of fingerprint recognition systems [13, 14, 15, 16], even the most recent study by Yoon et al. [17] was conducted nearly ten years ago. Given that fingerprint matchers have continued to improve (e.g., the ongoing Fingerprint Verification Competition has seen the Equal Error Rate of fingerprint matchers decrease from 0.1% to 0.01% since 2011 [1]), a fresh look at the fairness of SOTA fingerprint systems becomes an urgent necessity.
Another major lacunae in most of the existing works on fairness in biometric systems is the lack of a standard definition for fairness and a statistical framework to test for fairness. For example, it was reported in [17] that demographic covariates such as race and gender have negligible impact on genuine match scores; however, this does not mean that there will be no difference in the true match rate for different demographic groups. Similarly, if a fingerprint system is evaluated on a dataset and it is observed that the true match rate is and for males and females, respectively, how can we claim that the observed differential is statistically significant? If we change the dataset by adding or removing some individuals or draw a sample from a different population, will the demographic differential still hold? How large should the dataset be, if we want to claim with confidence that the observed demographic differential is statistically significant? To answer these questions, a formal hypothesis testing framework is essential.
To address the above limitations, we make the following three key contributions in this work:
-
1.
We aim to uncover biases (or lack thereof) in a SOTA commercial-off-the-shelf (COTS) fingerprint matcher (Verifinger 12.3 SDK) and a SOTA deep neural network based fingerprint matcher (DeepPrint [18]).
-
2.
We propose a statistical testing framework for evaluating bias in biometric systems operating the verification and identification modes.
-
3.
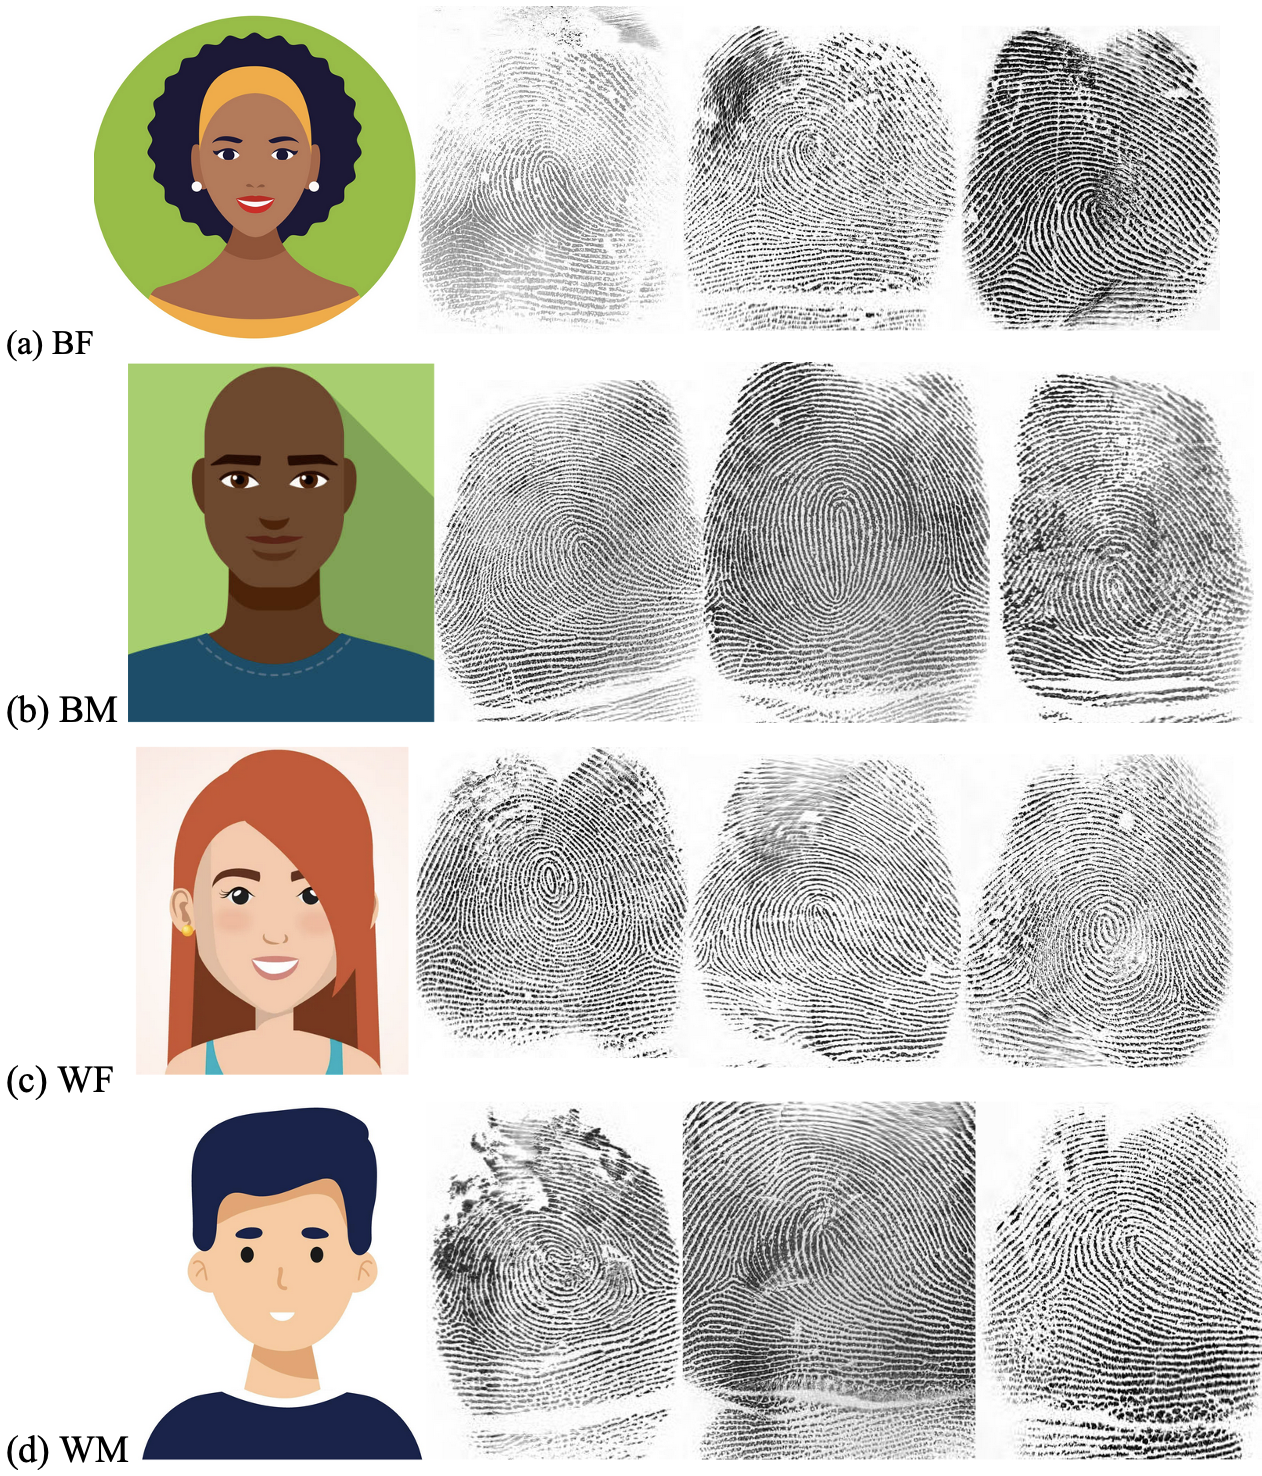
We apply the proposed statistical framework to test the fairness of SOTA fingerprint systems on two different datasets (see Table 1) focusing on four demographic groups: black female (BF), black male (BM), white female (WF), and white male (WM). This is aligned with the same demographic groups evaluated in the NIST Face Recognition Vendor Test (FRVT) [4, 19]. Additionally, the NFIQ2 fingerprint quality metric [20] is computed for the datasets to identify any image quality bias that may exist in the two fingerprint matchers.
2 Related Work
2.1 Definitions of Fairness
Fairness and demographic bias are well-studied topics in machine learning (ML) systems and several competing notions of fairness have been introduced [21, 22]. Typically, a ML system is modeled as a predictor that predicts an outcome based on some input . Ideally, the predictions made by the ML system must not rely on “protected” or “sensitive” attributes such as race, gender, and age. For simplicity, let us assume that the true outcome (e.g., positive vs negative), the predicted outcome , and the protected attribute (e.g., white vs black, male vs female) are binary random variables. In this case, the notion of fairness can be formalized in a number of ways.
Statistical Parity: Also known as demographic parity, this criterion requires . In other words, the predictions are independent of the protected attribute and the likelihood of observing an outcome should be the same regardless of person’s sensitive attribute. However, the above definition of statistical parity is not suitable for biometric recognition systems. For instance, when a male user is attempting to impersonate as a female user in a face recognition system, it is unreasonable to expect the outcome to be independent of the person’s gender.
Equalized Odds: A predictor is said to satisfy equalized odds if and are independent conditional on [23]. More specifically, , where . In simple terms, equalized odds ensures equal true positive and false positive rates for the two groups, and . Since equalized odds allows to depend on but through the target , it is possible to use features that relate directly to , but not through . This is usually the criterion used in biometric fairness literature, where the difference in the true positive and false positive rates for the two groups is termed as demographic differential. Existence of demographic differential indicates that the system violates the equalized odds fairness notion.
Equal Opportunity: A relaxation to the equalized odds criterion is called equal opportunity, which considers only the true positive rates for the two groups and ignores the false positives [23]. Specifically, the system satisfies equal opportunity if . In most biometric applications (especially in the verification and closed set identification modes), the users want the system to recognize them correctly and the effects of a false match are hardly perceived by the users. Hence, it can be argued that equal opportunity is also an appropriate notion of fairness in biometric systems.
Apart from the above three widely used definitions of fairness, other fairness criteria have also been proposed in the literature [21, 24]. Notable among them include test fairness (TF), which attempts to calibrate the similarity of a biometric system such that the conditional (genuine and impostor) score distributions are identical across different demographic groups, and fairness discrepancy rate (FDR) for biometric verification systems [25], which tries to ensure statistical parity between groups in terms of both false match rate (FMR) and false non-match rate (FNMR) at various decision thresholds using different hyperparameters. Both TF and FDR may be more appropriate during biometric system design, where the designer may not be aware of the operating threshold of the biometric system. In this work, the goal is to evaluate the fairness of operational biometric systems, where the decision threshold has already been fixed. Therefore, equalized odds and equal opportunity are more suitable definitions of fairness.
2.2 Fairness in Face Recognition
Studies on fairness of face recognition systems have received a lot of attention due to the high correlation between demographic and facial features. Many of these studies indicate that face recognition systems exhibit some bias against underrepresented ethnic and racial communities [26, 27]. There have been claims and supporting evidence that face recognition has a lower performance for darker skinned people compared to lighter skinned people [6]. Another example can be found in [28], where it was reported that the classification algorithm built into Google Photos classified some African-American people as “gorillas". Given such detrimental real-world consequences of demographic differentials in a biometric system (e.g., an innocent person being incarcerated due to a false facial match obtained from surveillance footage), it is important to study the causes for these biases and work towards eliminating them.
[]
Demographics of dataset used to train DeepPrint [18]*
Demographic Group
# of unique fingers in training set
![]() BF
1,510
BF
1,510
![]() BM
17,090
BM
17,090
![]() WF
1,750
WF
1,750
![]() WM
15,760
WM
15,760
-
*
The total number of unique fingers used to train DeepPrint was 38,291, which also includes a very small number of identities from other races as well as those with undisclosed demographic attributes.
2.3 Fairness in Fingerprint Recognition
A limited number of studies are available on the fairness of fingerprint recognition [14, 29, 17, 15, 16, 13]. Marasco [30] analyzed biases in fingerprint recognition systems including biases induced by sensors and fingerprint image quality. Though the number of low quality (estimated using NFIQ2 measures) fingerprint images was much higher for females compared to males, it was observed that the recognition accuracy was higher for females. Jain et al. [12] pointed out that bias in the demographic distribution of the dataset can produce biases in fingerprint recognition systems - especially due to the fact that most modern biometric systems are based on deep neural network (DNN) models. These DNN models generally tend to be prejudiced against the underrepresented demographic groups. For instance, a DNN trained on a dataset that is over sampled with white subjects can be expected to show higher performance on white subjects (see table 2.2). This phenomenon has been demonstrated in facial recognition and is referred to as the “other-race-effect”. This term is generally used when referring to the higher ability of humans to recognize faces of people from their own race [31]. In terms of fingerprint recognition, the other-race-effect would translate to a positive correlation between the verification performance of the system and the majority demographic group in the training dataset [31, 32].
2.4 A Note on Vocabulary
While studying demographic bias, it is important to use precise terminology for describing various demographic traits. The primary demographic attributes considered in this study are race and gender. Present day societal norm is to use the words ‘race’ and ‘ethnicity’ interchangeably. However, ‘race’ is associated with physical attributes, while ‘ethnicity’ relates to an individual’s cultural upbringing [33]. Since this study is concerned with the the physical traits of the subjects, the relevant term is race. A similar dilemma exists when it comes to the terms ‘gender’ and ‘sex’ [34]. ‘Gender’ is more appropriate when discussing the self-identity of an individual and how they project themselves to society. On the other hand, ‘sex’ refers to the biological traits present in an individual that classify them as either male or female. Since the subjects in the datasets used in this study presented their own identity, the appropriate term to use is gender.
3 Proposed Statistical Framework
Fairness Metric: In this work, equal opportunity [23] is used as the fairness criterion. A binary predictor , which outputs an outcome , satisfies equal opportunity with respect to protected attributed if:
| (1) |
where is typically considered as the “positive” or “advantaged” outcome and denotes group membership based on a protected attribute such as race (e.g., black vs. white) or gender (male vs. female). Equal opportunity implies that the true positive rates for the two demographic groups under consideration are equal.
3.1 Framework for Verification
A biometric system operating in the verification mode can be considered as a binary predictor , whose outcome is based on matching two biometric samples. An outcome represents a “non-match” decision, while represents a “match” decision. Following the definition in Eq. 1, we say that a biometric verification system is fair (in terms of equal opportunity) if the true match rates are equal across different demographic groups. Note that the true match rate is the proportion of mated comparisons that are correctly recognized as a match, and is equal to , where is the false non-match rate of the fingerprint system.
Two key challenges need to be addressed in order to test the fairness of a system based on the criterion defined in Eq. 1: (i) How to estimate the true positive rates accurately? and (ii) How to test for equality? Most of the existing works on fairness in the biometrics literature fail to address these challenges adequately. Note that and are Bernoulli random variables with parameters and , respectively. In the case of biometric verification, maximum likelihood (point) estimates of the parameters and can be obtained by performing and mated comparisons for the two demographic groups ( and , respectively) and computing the corresponding true match rates. Let and be the MLE estimates of the parameters based on the given matcher on the given dataset. While these estimates can be compared directly to test for fairness, this approach fails to consider the uncertainty in the parameter estimation and lacks a solid theoretical foundation. For example, if and differ by a small amount, we cannot claim the two distributions are significantly different.
Since the goal is to test the null hypothesis versus the alternate hypothesis , the following test statistic could be used.
| (2) |
where is the estimated true match rate for both the groups combined. The test statistic in eq. 2 asymptotically follows a standard normal distribution. Hence, for a level test, the null hypothesis should be rejected if , where is the -quantile value of the standard normal distribution.
Welch t-test: The above hypothesis test relies on the assumption that the dataset used to estimate the true match rates is a random sample of the population. Since there may be biases in data collection and the mated comparisons may not be truly independent, an alternative is to evaluate the uncertainty in the estimation of and using the bootstrapping (sampling with replacement) approach [35]. Specifically, we draw and bootstrap samples from the available dataset to estimate and , respectively. Let () be the mean true match rate for demographic group () based on the () bootstrap samples. Furthermore, let and be the standard deviation of the true match rates for the two groups. To evaluate statistical significance of the difference between the two means and , we can use the two-sampled Welch’s t-test [36]. The Welch t-test statistic is:
| (3) |
and the null hypothesis is rejected if , where is the -quantile value of the t distribution with degrees of freedom. In this case, the degrees of freedom is given by:
| (4) |
We refer to this test procedure as the bootstrap fairness test.
ANOVA test: The Welch t-test is restricted to comparing two means. Statistical significance between the means of more than two groups can be evaluated using one way analysis of variance (ANOVA). Suppose that there are demographic groups and are the true match rates for the groups. The null hypothesis is that all the groups have the same true match rate, i.e., . Let be the true match rate computed from the bootstrap sample of group , and . Also, let be the mean true match rate for the bootstrap samples of group and be the overall true match rate of the entire dataset. The test statistic [37, 38] is given by:
| (5) |
One of the underlying assumptions for this test is that the variances of the sample populations are equal. The null hypothesis is rejected if the resulting statistic is greater than , where and are the inter- and intra-class degrees of freedom.
3.2 Framework for Identification
In the case of a fingerprint system operating in the closed set identification mode, a “positive” outcome () can be defined as the scenario where a query user is correctly identified among subjects in the gallery. Correspondingly, a “negative” outcome () implies that the query user is incorrectly matched against the wrong identity. Thus, and are the true positive identification rates (TPIR) for the two demographic groups. Note that TPIR refers to the fraction of mated searches where the enrolled mate is within the top ranks, and is equal to , where is the false negative identification rate [39]. Thus, the same fairness testing framework derived for the verification mode can be applied for closed set identification, with and being the TPIR of the two demographic groups. The only modification is to account for the fact that TPIR is a function of both rank and the gallery size .
Finally, for fingerprint systems operating in the open set identification mode, the user will be greatly disadvantaged only when he is incorrectly assigned a wrong identity in the case of a mated search (query user is enrolled in the gallery) or is incorrectly identified as someone present in the gallery in the case of a non-mated search. Therefore, the performance metric that is critical from users’ perspective is false positive identification rate (FPIR) and the demographic differential should be measured based on FPIR. To evaluate fairness, a common threshold is fixed for all the demographic categories and the discrepancies between are considered for fairness evaluation, aligning the identification experiment with the protocol outlined in the NIST FRVT [4, 19].
4 Results
4.1 Databases and Recognition Systems
The longitudinal forensics database consists of 15,468 subjects (unique fingers), each with a set of ten fingerprints taken each time the subject was arrested (on an average, eight times over a 12-year period). The second database contains 1,014 subjects collected using a CrossMatch Guardian 200 reader. Additional details about the number of subjects per demographic category can be found in Table 1. These datasets were used to evaluate the fairness of a COTS fingerprint matcher Verifinger 12.3 SDK, along with a SOTA deep learning based matcher DeepPrint [18]. For verification, the COTS matcher provides a predefined threshold of 48 at a of 0.01%. For DeepPrint, 0.83 was the threshold used - computed on NIST SD4 [40] to obtain a of 0.01%.
4.2 Evaluation Protocol
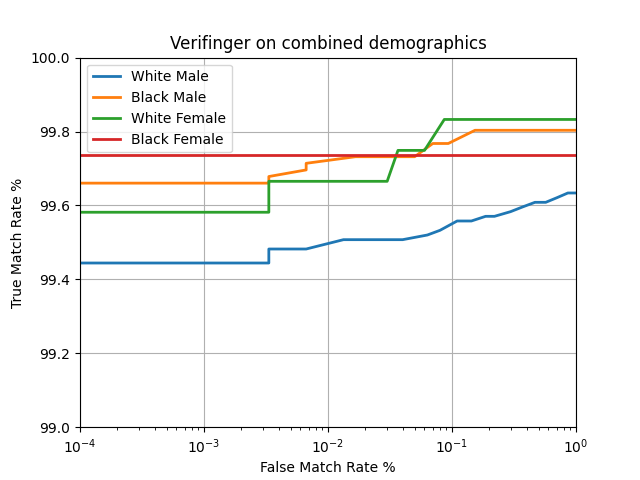
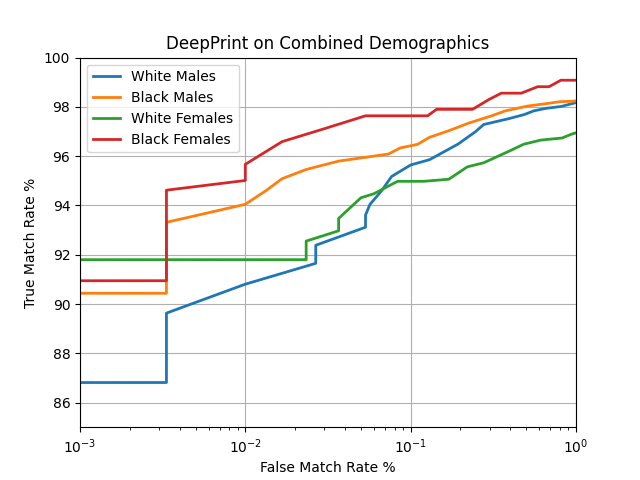
Verification and open-set identification performances are reported for the two matchers. To the best of our knowledge, most fingerprint recognition systems operate in one of these two modes of operation. Hence, we do not report results for closed-set identification. Based on the statistical framework developed in Section 3, we claim that the demographic differential (bias) in a verification system is statistically significant if the null hypothesis is rejected. For verification, 10 bootstrapped samples are created from the entire population for each database and . Using these 10 samples, both matchers are evaluated to obtain a mean along with the standard deviation , . Table 2 summarizes the results and figure 2 shows the associated ROC curves.
4.3 Verification Bias
| Demographic Group | Dataset | Dataset | avg. # of genuine comparisons | ||
|---|---|---|---|---|---|
| Verifinger 12.32 | DeepPrint3 | Verifinger 12.32 | DeepPrint3 | ||
|
|
99.66 (±0.23) | 95.3 (±0.49) | 100 (±0) | 91.07 (±2.75) | 760 |
|
|
99.68 (±0.07) | 94.35 (±0.39) | 100 (±0) | 97.30 (±2.11) | 5,619 |
|
|
99.53 (±0.17) | 92.03 (±0.6) | 100 (±0) | 93.38 (±1.3) | 1,188 |
|
|
99.46 (±0.08) | 91.18 (±0.32) | 99.52 (±0.51) | 94.33 (±1.61) | 7,902 |
|
|
99.68 (±0.08) | 94.47 (±0.38) | 100 (±0) | 94.19 (±3.96) | 6,379 |
|
|
99.47 (±0.08) | 91.29 (±0.28) | 99.75 (±0.43) | 93.85 (±1.54) | 9,089 |
|
|
99.58 (±0.14) | 93.3 (±0.51) | 100 (±0) | 92.23 (±2.44) | 1,947 |
|
|
99.55 (±0.05) | 92.5 (±0.28) | 99.76 (±0.43) | 95.81 (±2.4) | 13,521 |
-
1
Mean % and standard deviation were obtained using the 10 bootstrap samples.
-
2
Threshold = 48. Specified by vendor.
-
3
Threshold = 0.83. Computed based on matcher performance on NIST SD4 [40] at a .
The mean values for dataset in Table 2 indicate that Verifinger has a higher performance on BM compared to BF and a lower performance on WM compared to WF. Overall, this matcher has a higher on black subjects compared to white subjects and almost equal for male and female subjects. DeepPrint also shows a higher performance on black subjects compared to white subjects and a higher performance on females compared to males. To evaluate statistical significance, we test versus where and are the mean (%) of the two groups being evaluated. Table 3 consolidates the pairwise Welch’s t-test results for all the relevant comparisons. Our analysis in this paper is largely focused on dataset because of its large size. Verifinger does exhibit significant difference in between WM and BM groups but the biases are more prevalent in DeepPrint with the differentials in being statistically significant for each pairwise comparison when evaluated on . ANOVA test on the mean from Verifinger for BF, BM, WF and WM yields with inter-class and intra-class degrees of freedom and . Since , we can conclude that there is demographic differential between the of the 4 groups when evaluated using Verifinger. Similarly, there is also a bias present in DeepPrint because . This is not surprising given the existence of pairwise biases.
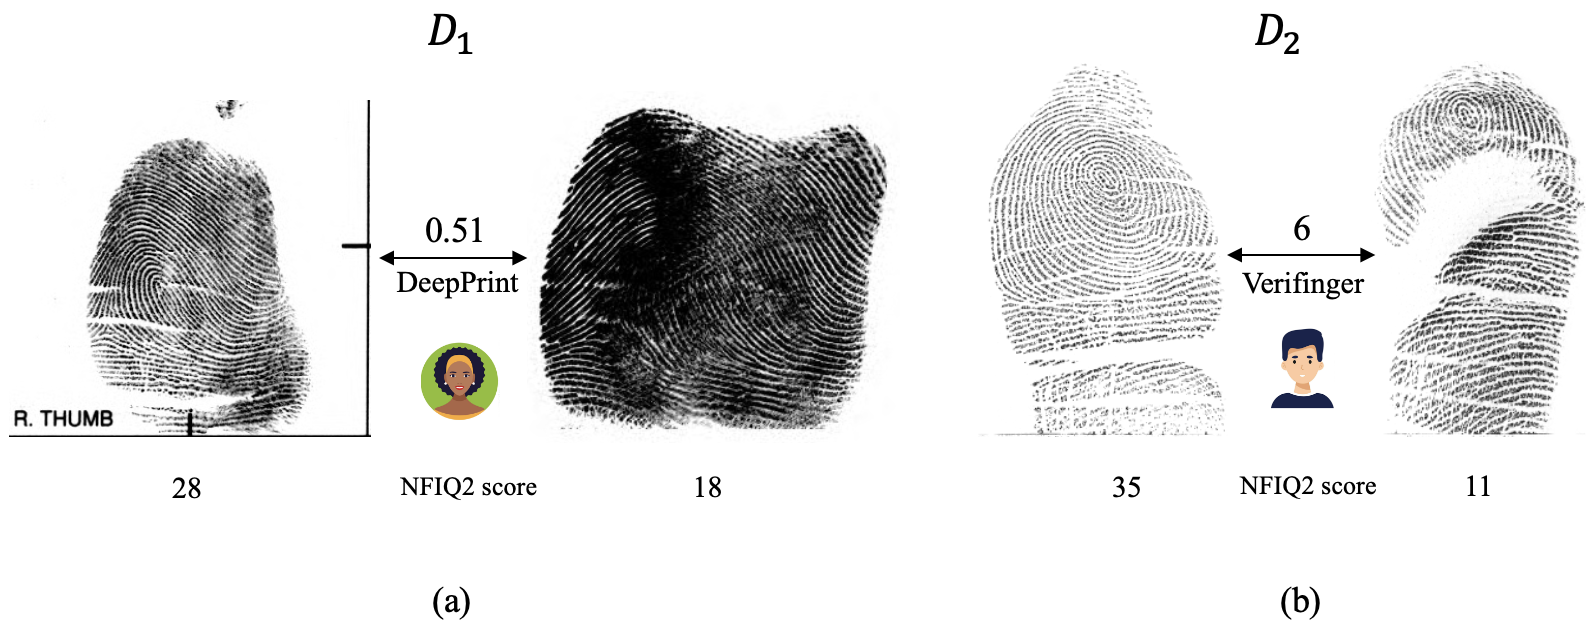
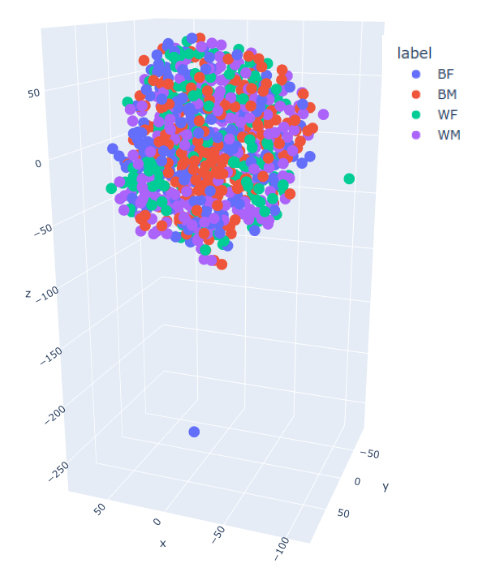
Verifinger and DeepPrint are different types of matchers - the former is minutiae-based and the latter is based on a deep neural network. Since DeepPrint has lower overall accuracy and reliability compared to Verifinger, it is more prone to demographic bias due to the larger range of values. Since there are an average of only 760 genuine comparisons for BF, even a few noisy similarity scores can lead to statistically significant differentials among the demographic groups. Figure 3 shows a 3-D t-SNE plot of the embeddings obtained from DeepPrint for dataset . It shows embeddings for 200 randomly selected subjects for each demographic group. We can see two clear outliers in the figure - one from BF and one from WF. It should be noted that these outliers are not the only ones present in the dataset but are the ones that were included in the random sampling. Figure 4 shows examples of genuine similarity scores below the matcher threshold. In Fig. 4 (a), the image on the right is blotted and the ridge patterns are not clearly visible. In Fig. 4 (b), we see that the image on the right has a large gap in the middle, which explains the low match score of 6. Thus, the differentials between the demographic groups can be explained by such outliers to a large degree.
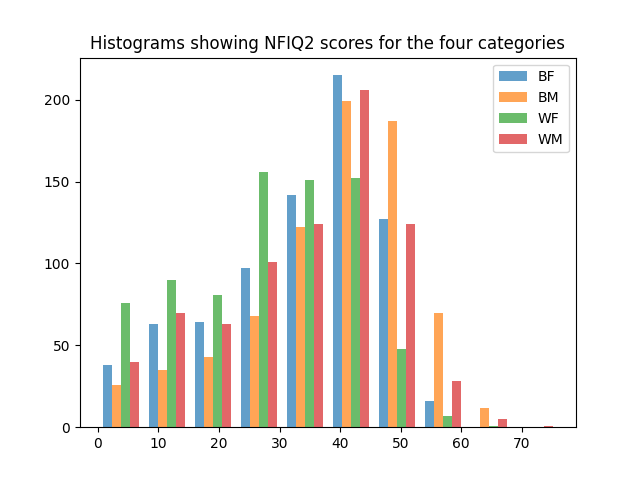
Additionally, Figure 5 shows that female subjects have a lower mean NFIQ2 score compared to male subjects. Intuitively, the matchers will perform better on the images with higher quality - assuming a correlation between image quality and matcher performance. However, that is not the case for DeepPrint - it performs better on female subjects compared to male. This outcome mirrors the observations made by Marasco [30] and leads to the conclusion that the NFIQ2 quality metric may itself be biased.
| Demographic Group | Verifinger 12.3 | DeepPrint | ||||
|---|---|---|---|---|---|---|
| rejected? | rejected? | |||||
| WF and WM | 1.18 | 12.8 | No | 3.95 | 13.73 | Yes |
| BF and BM | 0.26 | 10.65 | No | 4.79 | 17.14 | Yes |
| WM and BM | 6.54 | 17.69 | Yes | 19.87 | 17.34 | Yes |
| WF and BF | 1.44 | 16.57 | No | 13.34 | 17.31 | Yes |
| F and M | 0.64 | 11.25 | No | 4.34 | 13.97 | Yes |
| B and W | 5.86 | 18 | Yes | 21.3 | 16.55 | Yes |
| Demographic Group | Verifinger 12.3 | DeepPrint | ||||
|---|---|---|---|---|---|---|
| rejected? | rejected? | |||||
| WF and WM | 5.2 | 7.60 | Yes | 3.0 | 6.71 | Yes |
| BF and BM | 2.34 | 4.07 | No | 1.50 | 7.93 | No |
| WM and BM | 1.93 | 7.83 | No | 2.77 | 7.34 | Yes |
| WF and BF | 7.02 | 4.03 | Yes | 4.39 | 5.35 | Yes |
4.4 Open-set Identification Bias
For open-set identification, we follow the experiment design described in [41] and report the performance based on the two metrics defined in the NIST FRVT report, and [4, 19]. FRVT defines the as the fraction of non-mated searches that returned one or more similarity scores above the specified threshold and as the fraction of mated searches where the mate has a similarity score less than the threshold or was found outside ranks [4]. In this case was selected to be 5.
To evaluate open-set identification accuracy, a gallery is constructed consisting of 100,000 unique fingers222No demographic information is available for these 100,000 images and there are no overlapping identities. from a separate database as distractors along with impressions from three demographic groups (from ) selected as follows; if we are evaluating performance on BF, the three groups in the gallery will be BM, WF, WM. Out of the 4 groups, black females have the least number of probe subjects (762). To maintain consistency, the same number of probe subjects were sampled from all four groups. As described by Tabassi [41], the probe cohort is split up into two categories; subjects that have a mate in the gallery () and subjects that do not have a mate ()333 and are disjoint from each other.. The number of subjects with a mate in the gallery is chosen to be 200. This brings the total gallery size to 102,486 identities 444k unique fingers () subjects from the 3 other demographic categories mates of , in alignment with the procedure specified in [42] that recommends one biometric sample per identity in the gallery.
| Demographic Group | Verifinger | DeepPrint |
|---|---|---|
| BF | 8.04 (±0.11) | 2.35 (±0.5) |
| BM | 6.8 (±1.17) | 1.85 (±0.55) |
| WF | 13.45 (±1.72) | 4.9 (±1.2) |
| WM | 8.35 (±1.36) | 3.0 (±0.75) |
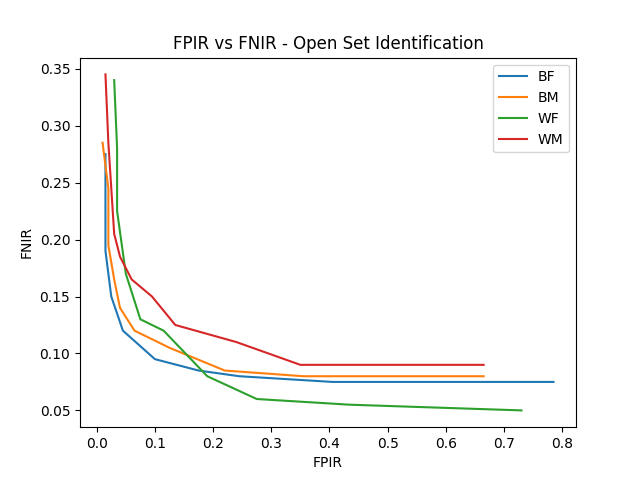
Figure 6 and Table 5 show the open-set identification performance in terms of and for DeepPrint. To ensure that the values are comparable, the threshold is fixed across all four demographic groups. In the case of Verifinger, a threshold of 48 is provided by the vendor. For DeepPrint, a matcher threshold is computed to obtain a desired (0.1) on a specific demographic group (BF) and that same threshold (0.8904) is applied to all four demographic groups. From Tables 5 and 4, it is observed that both Verifinger and DeepPrint exhibit the lowest performance on WF (highest mean at the given threshold) and the highest performance on BM (lowest mean ). The differentials observed in Verifinger are statistically significant when the WF demographic group is included in the comparison. DeepPrint showed statistically significant differentials in all cases except when comparing BF and BM.
5 Discussion and Summary
Two clear trends emerge from this study: (i) in the case of verification, more accurate fingerprint matchers are less likely to exhibit bias (demographic differentials), and (ii) most observed demographic differentials can be explained by the poor quality of some fingerprint images, which leads to outliers in the genuine score distribution. Depending on database size, even a small number of noisy mated comparisons can cause a significant drop in the performance of the matcher, thereby providing false evidence of bias. For example, out of the 9,112 total white subjects (and genuine similarity scores), if only 13 (0.15%) of the genuine similarity scores below the threshold were increased to be above the threshold, the bias between black and white subjects in Verifinger would disappear. This would also eliminate the bias between WM and BM. Therefore, our study strongly indicates that the differentials in fingerprint recognition performance between demographic groups depend on external factors that are unrelated to the demographic of the user. Hence, it cannot be said with confidence that the biases encountered in facial recognition are also present in fingerprint recognition.
References
- [1] B. Dorizzi, R. Cappelli, M. Ferrara, D. Maio, D. Maltoni, N. Houmani, S. Garcia-Salicetti, and A. Mayoue, “Fingerprint and On-Line Signature Verification Competitions at ICB 2009,” International Conference on Biometrics (ICB), pp. 725–732, 2009. https://biolab.csr.unibo.it/FvcOnGoing/.
- [2] “Touch ID.” Apple Inc. https://support.apple.com/.
- [3] “AADHAAR.” Unique Identification Authority of India. https://uidai.gov.in/.
- [4] P. Grother, M. Ngan, and K. Hanaoka, “Face Recognition Vendor Test (FRVT) Part 3: Demographic Effects,” 2019. https://nvlpubs.nist.gov/nistpubs/ir/2019/nist.ir.8280.pdf.
- [5] US Department of Transportation, “US International Air Passenger and Freight Statistics,” International Aviation Development Series, 2022 [Online]. https://www.transportation.gov/.
- [6] Najibi, Alex, “Racial Discrimination in Face Recognition Technology,” Science in the News, October 2020.
- [7] J. Buolamwini and T. Gebru, “Gender shades: Intersectional accuracy disparities in commercial gender classification,” in Conference on Fairness, Accountability and Transparency, pp. 77–91, Proceedings of Machine Learning Research, 2018.
- [8] N. Singer, “Amazon is pushing facial technology that a study says could be biased,” The New York Times, Jan 2019.
- [9] N. Wingfield, “Amazon pushes facial recognition to police. Critics see surveillance risk.,” The New York Times, May 2018.
- [10] Brendan Klare, “Race and Face Recognition Accuracy: Common Misconceptions.” Rank One Computing. https://rankone.io/2019/09/12/race-and-face-recognition-accuracy-common-misconceptions/.
- [11] Stuart Baker, “The Flawed Claims About Bias in Facial Recognition.” Lawfare Blog. https://www.lawfareblog.com/flawed-claims-about-bias-facial-recognition.
- [12] A. K. Jain, D. Deb, and J. J. Engelsma, “Biometrics: Trust, but verify,” arXiv preprint arXiv:2105.06625, 2021.
- [13] A. Hicklin and C. Reedy, “Implications of the ident/iafis image quality study for visa fingerprint processing,” Mitertek Systems (MTS), 2002. https://www.eumonitor.nl/.
- [14] N. C. Sickler and S. J. Elliott, “An evaluation of fingerprint image quality across an elderly population vis-a-vis an 18-25 year old population,” in Proceedings 39th Annual 2005 International Carnahan Conference on Security Technology, pp. 68–73, IEEE, 2005.
- [15] S. K. Modi and S. J. Elliott, “Impact of image quality on performance: Comparison of young and elderly fingerprints,” in Proceedings of the 6th International Conference on Recent Advances in Soft Computing (RASC 2006), K. Sirlantzis (Ed.), pp. 449–45, Citeseer, 2006.
- [16] S. K. Modi, S. J. Elliott, J. Whetsone, and H. Kim, “Impact of age groups on fingerprint recognition performance,” in 2007 IEEE Workshop on Automatic Identification Advanced Technologies, pp. 19–23, 2007.
- [17] S. Yoon and A. K. Jain, “Longitudinal study of fingerprint recognition,” Proceedings of the National Academy of Sciences, vol. 112, no. 28, pp. 8555–8560, 2015.
- [18] J. J. Engelsma, K. Cao, and A. K. Jain, “Learning a fixed-length fingerprint representation,” IEEE Transactions on Pattern Analysis and Machine Intelligence, vol. 43, no. 6, pp. 1981–1997, 2019.
- [19] P. Grother, M. Ngan, and K. Hanaoka, “Face Recognition Vendor Test (FRVT) Part 2: Identification,” 2022. https://pages.nist.gov/frvt/reports/1N/frvt_1N_report.pdf.
- [20] E. Tabassi and G. Fiumara, “NFIQ 2,” National Institute of Standards and Technology (NIST), 2021. https://www.nist.gov/.
- [21] N. Mehrabi, F. Morstatter, N. Saxena, K. Lerman, and A. Galstyan, “A Survey on Bias and Fairness in Machine Learning,” ACM Computing Surveys, vol. 54, July 2021.
- [22] H. Liu, Y. Wang, W. Fan, X. Liu, Y. Li, S. Jain, Y. Liu, A. K. Jain, and J. Tang, “Trustworthy AI: A Computational Perspective,” arXiv preprint arXiv:2107.06641, 2021.
- [23] M. Hardt, E. Price, E. Price, and N. Srebro, “Equality of Opportunity in Supervised Learning,” in Advances in Neural Information Processing Systems, vol. 29, 2016.
- [24] S. Verma and J. Rubin, “Fairness Definitions Explained,” in Proceedings of the International Workshop on Software Fairness, p. 1–7, 2018.
- [25] T. de Freitas Pereira and S. Marcel, “Fairness in Biometrics: a figure of merit to assess biometric verification systems,” IEEE Transactions on Biometrics, Behavior, and Identity Science, vol. 4, no. 1, pp. 19–29, 2021.
- [26] P. Drozdowski, C. Rathgeb, A. Dantcheva, N. Damer, and C. Busch, “Demographic bias in biometrics: A survey on an emerging challenge,” IEEE Transactions on Technology and Society, vol. 1, no. 2, pp. 89–103, 2020.
- [27] P. Terhörst, J. N. Kolf, M. Huber, F. Kirchbuchner, N. Damer, A. Morales, J. Fierrez, and A. Kuijper, “A Comprehensive Study on Face Recognition Biases Beyond Demographics,” arXiv preprint arXiv:2103.01592, 2021. https://arxiv.org/abs/2103.01592.
- [28] M. Garcia, “Racist in the machine: The disturbing implications of algorithmic bias,” World Policy Journal, vol. 33, no. 4, pp. 111–117, 2016.
- [29] K. O’Connor and S. J. Elliott, “The impact of gender on image quality, henry classification and performance on a fingerprint recognition system,” in Proc. Int. Conf. Inf. Technol. Appl. (ICITA), pp. 304–307, 2011.
- [30] E. Marasco, “Biases in fingerprint recognition systems: Where are we at?,” in 2019 IEEE 10th International Conference on Biometrics Theory, Applications and Systems (BTAS), pp. 1–5, 2019.
- [31] N. Furl, P. J. Phillips, and A. J. O’Toole, “Face recognition algorithms and the other-race effect: computational mechanisms for a developmental contact hypothesis,” Cognitive Science, vol. 26, no. 6, pp. 797–815, 2002.
- [32] P. J. Phillips, F. Jiang, A. Narvekar, J. Ayyad, and A. J. O’Toole, “An other-race effect for face recognition algorithms,” ACM Transactions on Applied Perception (TAP), vol. 8, no. 2, pp. 1–11, 2011.
- [33] E. Blakemore, “Race and ethnicity: How are they different?,” National Geographic, May 2021. https://www.nationalgeographic.com/culture/article/race-ethnicity.
- [34] B. N. Torgrimson and C. T. Minson, “Sex and gender: what is the difference?,” Journal of Applied Physiology, vol. 99, no. 3, pp. 785–787, 2005. PMID: 16103514.
- [35] B. Efron, “Bootstrap methods: Another Look at the Jackknife,” in Breakthroughs in Statistics, pp. 569–593, Springer, 1992.
- [36] B. L. Welch, “The significance of the difference between two means when the population variances are unequal,” Biometrika, vol. 29, no. 3/4, pp. 350–362, 1938.
- [37] A. Ross and V. L. Willson, One-Way Anova, pp. 21–24. Rotterdam: SensePublishers, 2017.
- [38] L. St»hle and S. Wold, “Analysis of variance (anova),” Chemometrics and Intelligent Laboratory Systems, vol. 6, no. 4, pp. 259–272, 1989.
- [39] D. Maltoni, D. Maio, A. K. Jain, and S. Prabhakar, Handbook of Fingerprint Recognition. Springer Science & Business Media, 2009.
- [40] NIST, “NIST Special Database 4,” National Institute of Standards and Technology, 2010. https://www.nist.gov/srd/nist-special-database-4.
- [41] E. Tabassi, C. Watson, G. Fiumara, W. Salamon, P. Flanagan, and S. L. Cheng, “Performance evaluation of fingerprint open-set identification algorithms,” in IEEE International Joint Conference on Biometrics, pp. 1–8, IEEE, 2014.
- [42] S. Z. Li and A. K. Jain, Handbook of Face Recognition, vol. 2. Springer, 2011.