Dislocation nucleation and dynamics models for plastic deformation of single crystalline tungsten: The role of interatomic potentials
Abstract
Computational modeling is usually applied to aid experimental exploration of advanced materials to better understand the fundamental plasticity mechanisms during mechanical testing. In this work, we perform Molecular dynamics (MD) simulations to emulate experimental room temperature spherical–nanoindentation of crystalline W matrices by different interatomic potentials: EAM, modified EAM, and a recently developed machine learned based tabulated Gaussian approximation potential (tabGAP) for describing the interaction of W-W. Results show similarities between load displacements and stress–strain curves, regardless of the numerical model. However, a discrepancy is observed at early stages of the elastic to plastic deformation transition showing different mechanisms for dislocation nucleation and evolution, that is attributed to the difference of Burgers vector magnitudes, stacking fault and dislocation glide energies. Besides, contact pressure is investigated by considering large indenters sizes that provides a detailed analysis of screw and edge dislocations during loading process. Furthermore, the glide barrier of this kind of dislocations are reported for all the interatomic potentials showing that tabGAP model presents the most accurate results with respect to density functional theory calculations and a good qualitative agreement with reported experimental data.
keywords:
Dislocations dynamics , Tungsten , Nanoindentation , Machine learning methods1 Introduction
The development of novel technology for current energy industries requires the use of refractory BCC materials that can mechanically sustain extreme operating conditions that may include, among others, high temperature and irradiation. Tungsten can fulfill these requirements and is the main candidate material to design a Plasma Facing Component (PFM) for fusion reactors [1, 2, 3, 4] due to its high melting point, low sputtering yield, and low tritium inventory [5, 6, 7, 8, 9]. Like the International Thermonuclear Experimental Reactor (ITER), the main objective is to develop accessible applications for W and its alloys in extreme operating environment and to identify limitations in future fusion reactors. This will certainly increase the already demanding mechanical properties of the materials facing higher neutron irradiation dose and nuclear transmutation rates [1, 2], where computational models can save financial and technological resources [10, 11, 12].
In a fusion reactor, W experiences a harsh environment due to the alpha particles and hydrogen ions irradiation that causes indentation size effects. Thus, the modeling of nanoindentation of W is essential and of importance to better understand its behaviour at a similar scale (e.g. within 100 nm of the surface) [13]. Atomistic simulations based on the molecular dynamics (MD) method have been used to provide an insight of plastic deformation of BCC metals by spherical nanoindentation [14, 15, 16, 17, 18, 13, 10, 19], as well as the description of the the physical and chemical processes for defect production during external load where the interatomic potentials play an important role to model the W-W interaction [20, 21, 22, 23, 24, 25, 26]. For example, large scale MD simulations are mainly based on the embedded atom method (EAM) expressing the energy of an atomic system by the sum of pair potential terms of the separation between an atom and the collective chemical bonds between the neighboring atoms [24]. This kind of approach provides information about the atomistic description of dislocation nucleation during mechanical loading, with some limitations in several cases. The nucleation of a dislocation with a Burgers vector commonly occurs during nanomechanical tests of BCC metals like W and hence it is important to accurately model the glide of 1/2{110} screw dislocations for describing dislocation dynamics numerically [27], being the goal of our work.
Our paper is organized as follows: In Section 2 we describe the details of the numerical simulations by considering different interatomic potentials based on EAM [25, 24], modified EAM [28] and tabulated Gaussian approximation potential framework [29]. In Section 3, the atomistic insights of the mechanical response of crystalline W by nanoindentation tests are presented on the [001], [011], and [111] orientations. We analyze dislocation density as function indentation depth, in conjunction to dislocation loop formation, pile-ups formation showing nanoindentation mechanisms. Stress-strain curves and dislocation densities are reported. Besides, an analysis of the screw and junction dislocations by NEB is presented to elucidate the difference on dislocation dynamics in the MD simulation due to the modeling of the interatomic potential. Finally, in section 4, we provide concluding remarks.
2 Computational methods
In general, MD simulations utilize EAM approach as a first attempt to computationally model the physical and mechanical processes of the nanomechanical response of crystalline W under external load, which defines the energy of the –atom as
| (1) |
where represents the atoms within the cutoff range nm, is a pairwise potential, repulsive at short range, and the embedding function for an atom in a region of electron density, given by . Therefore, we explore the advantages and limitations of the following interatomic potentials over a traditional EAM model:
| Parameter | Wang | Marinica | TabGAP | Mason | Hiremath | Exp. |
|---|---|---|---|---|---|---|
| 523 | 523 | 540 | 511 | 527 | 501 | |
| 203 | 203 | 182 | 201 | 194 | 198 | |
| 160 | 160 | 133 | 161 | 177 | 151 | |
| Shear Mod. | 160.0 | 160.0 | 135 | 161 | 177 | 151.47 |
| Poisson R. | 0.28 | 0.28 | 0.28 | 0.27 | 0.27 | 0.283 |
| Elastic Mod. | 409.48 | 409.48 | 448.63 | 431.03 | 424.63 | 388.82 |
| BCC (eV/atom) | -8.899 | -8.899 | -8.9 | -8.65 | -8.90 | -8.9 |
| 2.72 | 2.72 | 2.75 | 2.74 | 2.74 | 2.74 |
- EAM1
-
This interatomic potential is the main reference of our work and was developed by Marinica et al. [24] (second class of potentials defined as EAM2 by the authors) for an investigation of radiation defects as well as dislocation nucleation in tungsten. This potential was fitted to: 1) experimental values such as lattice constant measurements, cohesive energies of tungsten in BCC phase and elastic constants; 2) basic point defects formation energies calculated by ab–initio computations for the single vacancy and self-interstitials with different crystal orientations, namely , , and , interatomic forces for liquid state configurations of tungsten. The resulting EAM potential has been evaluated by comparing with DFT results on point defects (I2 and I4 interstitial clusters as well as two-, three– and four–vacancy clusters formation energy) as well as extended defects (surface energy, Bain deformation energy, dislocation core energy and Peierls energy barrier calculations). The results show that, in principle, this potential is a good choice for dislocation involved simulations of tungsten, such as nanoindentation measurements.
- EAM2
-
This EAM potential is reported by Wang et al. [25] where the W–W interaction is in principle based on Marinica et al potential [24], and developed by computing DFT calculation to fit the W–H interactions taken from reported and generated W–W/W–H DFT data by the authors. Here, defect properties like hydrogen with SIA, hydrogen diffusion in strained W are reported. Thus, the W–W interaction description was optimized to include the W–H parametrization giving the opportunity to model W–H interaction for further investigation of the effect of deuterium on the dislocation nucleation and dynamics during mechanical testing.
- EAM+ZBL
-
Mason et al. [31] introduced smoothly–varying, physically– motivated modifications to the Ackland–Thetford potential [32] and adding the ZBL universal screening potential contribution to improve vacancy- and surface-related properties. This potential was parametrized to perform simulations of vacancy–type defects for collision cascades at elevated temperatures with improved surface properties for pure W.
- TabGAP
-
The tabulated Gaussian approximation potential (GAP) was developed by Byggmästar et al. [29]. It is a GAP machine–learning potential that has been trained with only simple low–dimensional descriptors (two–body, three–body, and an EAM-like density). The low dimensionality of the descriptors allows for creating faster tabulated versions, where the machine-learning energy contributions are mapped onto grids [33, 34, 35]. The total energy is then evaluated efficiently using cubic splines as
(2) Here, represents a one–dimensional cubic spline for the two-body contribution, is the three– dimensional spline for the three–body contribution, and the final term is the embedding energy contribution similar to the EAM potentials. Despite the simplicity compared to other machine–learning potentials, the tabGAP achieves meV/atom accuracy for tungsten–based high-entropy alloys and compares well with DFT for various elastic, defect, and melting properties [29, 35] that can be applied to model defect production at high temperatures [36].
- MEAM
-
Hiremath et al. [28] developed a second nearest-neighbor modified EAM potential to investigate mechanisms of fracture in W samples providing an atomic insight; which also yields surface and unstable twinning energies that are in slightly better agreement with DFT. Here, the total potential energy of the system is given as
(3) where represents the embedding energy associated with placing the -atom into the background electron density . The function is defined as the pair interaction contribution between and atoms, separated by the distance , while is a screening function. The fitting process was done by using the open-source M-EAM parameter calibration (MPC) tool [37] to reproduce DFT data that serves as input data.
| Approach | ||||
|---|---|---|---|---|
| DFT | 0.29 | 0.25 | 0.28 | 0.26 |
| Wang et al. | 0.17 | 0.14 | 0.18 | 0.17 |
| Marinica et al. | 0.17 | 0.14 | 0.18 | 0.17 |
| TabGAP | 0.24 | 0.21 | 0.24 | 0.23 |
| Mason et al. | 0.24 | 0.22 | 0.26 | 0.24 |
| Hiremath et al. | 0.24 | 0.21 | 0.25 | 0.24 |
2.1 Nanoindentation test
| Orientation | Size(dx,dy,dz) [nm] | X-axis | Y-axis | Z-axis | Atoms |
|---|---|---|---|---|---|
| (37.92,41.08,31.60) | 3 120 000 | ||||
| (34.76,37.99,36.65) | (011) | 3 066 800 | |||
| (33.52,34.83,46.52) | 3 442 500 |
In order to perform the MD simulations, we utilize the Large-scale Atomic/ Molecular Massively Parallel Simulator (LAMMPS) software [39]. To model correctly plastic deformation, we first compute the the elastic constants, Cij, and other W properties, as well as the surface energies by all the interatomic potentials considered in this work. The obtained values are presented in Table 1 and 2 noticing that the EAM-based potentials we utilize are similar in most respects.
We apply MD simulations through an statistical thermodynamic ensemble and the velocity Verlet algorithm to emulate experimental nanoindentation test. Periodic boundary conditions are set on the and axes to simulate an infinite surface, while the orientation contains a fixed bottom boundary and a free top boundary in all MD simulations [40]. We first defined the initial W sample with respect to its crystal orientation as shown in Tab. 3 followed by a process of energy optimization and equilibration for 100 ps with a Langevin thermostat at 300 K and a time constant of 100 fs [40]. This is done until the system reaches a homogeneous sample temperature and pressure profile with a density of 19.35 g/cm3, which is similar to the experimental value. At the first stage, the samples are defined into three sections in the direction for setting up boundary conditions along its depth, : 1) frozen section with a width of 0.02 for stability of the numerical cell; 2) a thermostatic section at 0.08 above the frozen one to dissipate the generated heat during nanoindentation; and 3) the dynamical atoms section, where the interaction with the indenter tip modifies the surface structure of the samples. In addition, a 5 nm vacuum section is included at the top of the sample [17].
The indenter tip is considered as a non-atomic repulsive imaginary (RI) rigid sphere with a force potential defined as: where eV/Å3 (37.8 GPa) is the force constant, and is the position of the center of the tip as a function of time, with radius . Here, with and as the center of the surface sample on the plane, the nm is the initial gap between the surface and the intender tip moves with a speed = 20 m/s. The loading and unloading processes are defined by considering the direction of the velocity as negative and positive, respectively. Each process is performed for 125 ps with a time step of fs. The maximum indentation depth is chosen to 3.0 nm to avoid the influence of boundary layers in the dynamical atoms region.
3 Results
From our MD simulations, the loading and unloading processes of nanoindentation test of W sample are recorded and shown in Fig. 1 by using different interatomic potentials and an indenter tip radius nm. We include a Hertz fitting curve based on the sphere–flat surface contact and expressed as
| (4) |
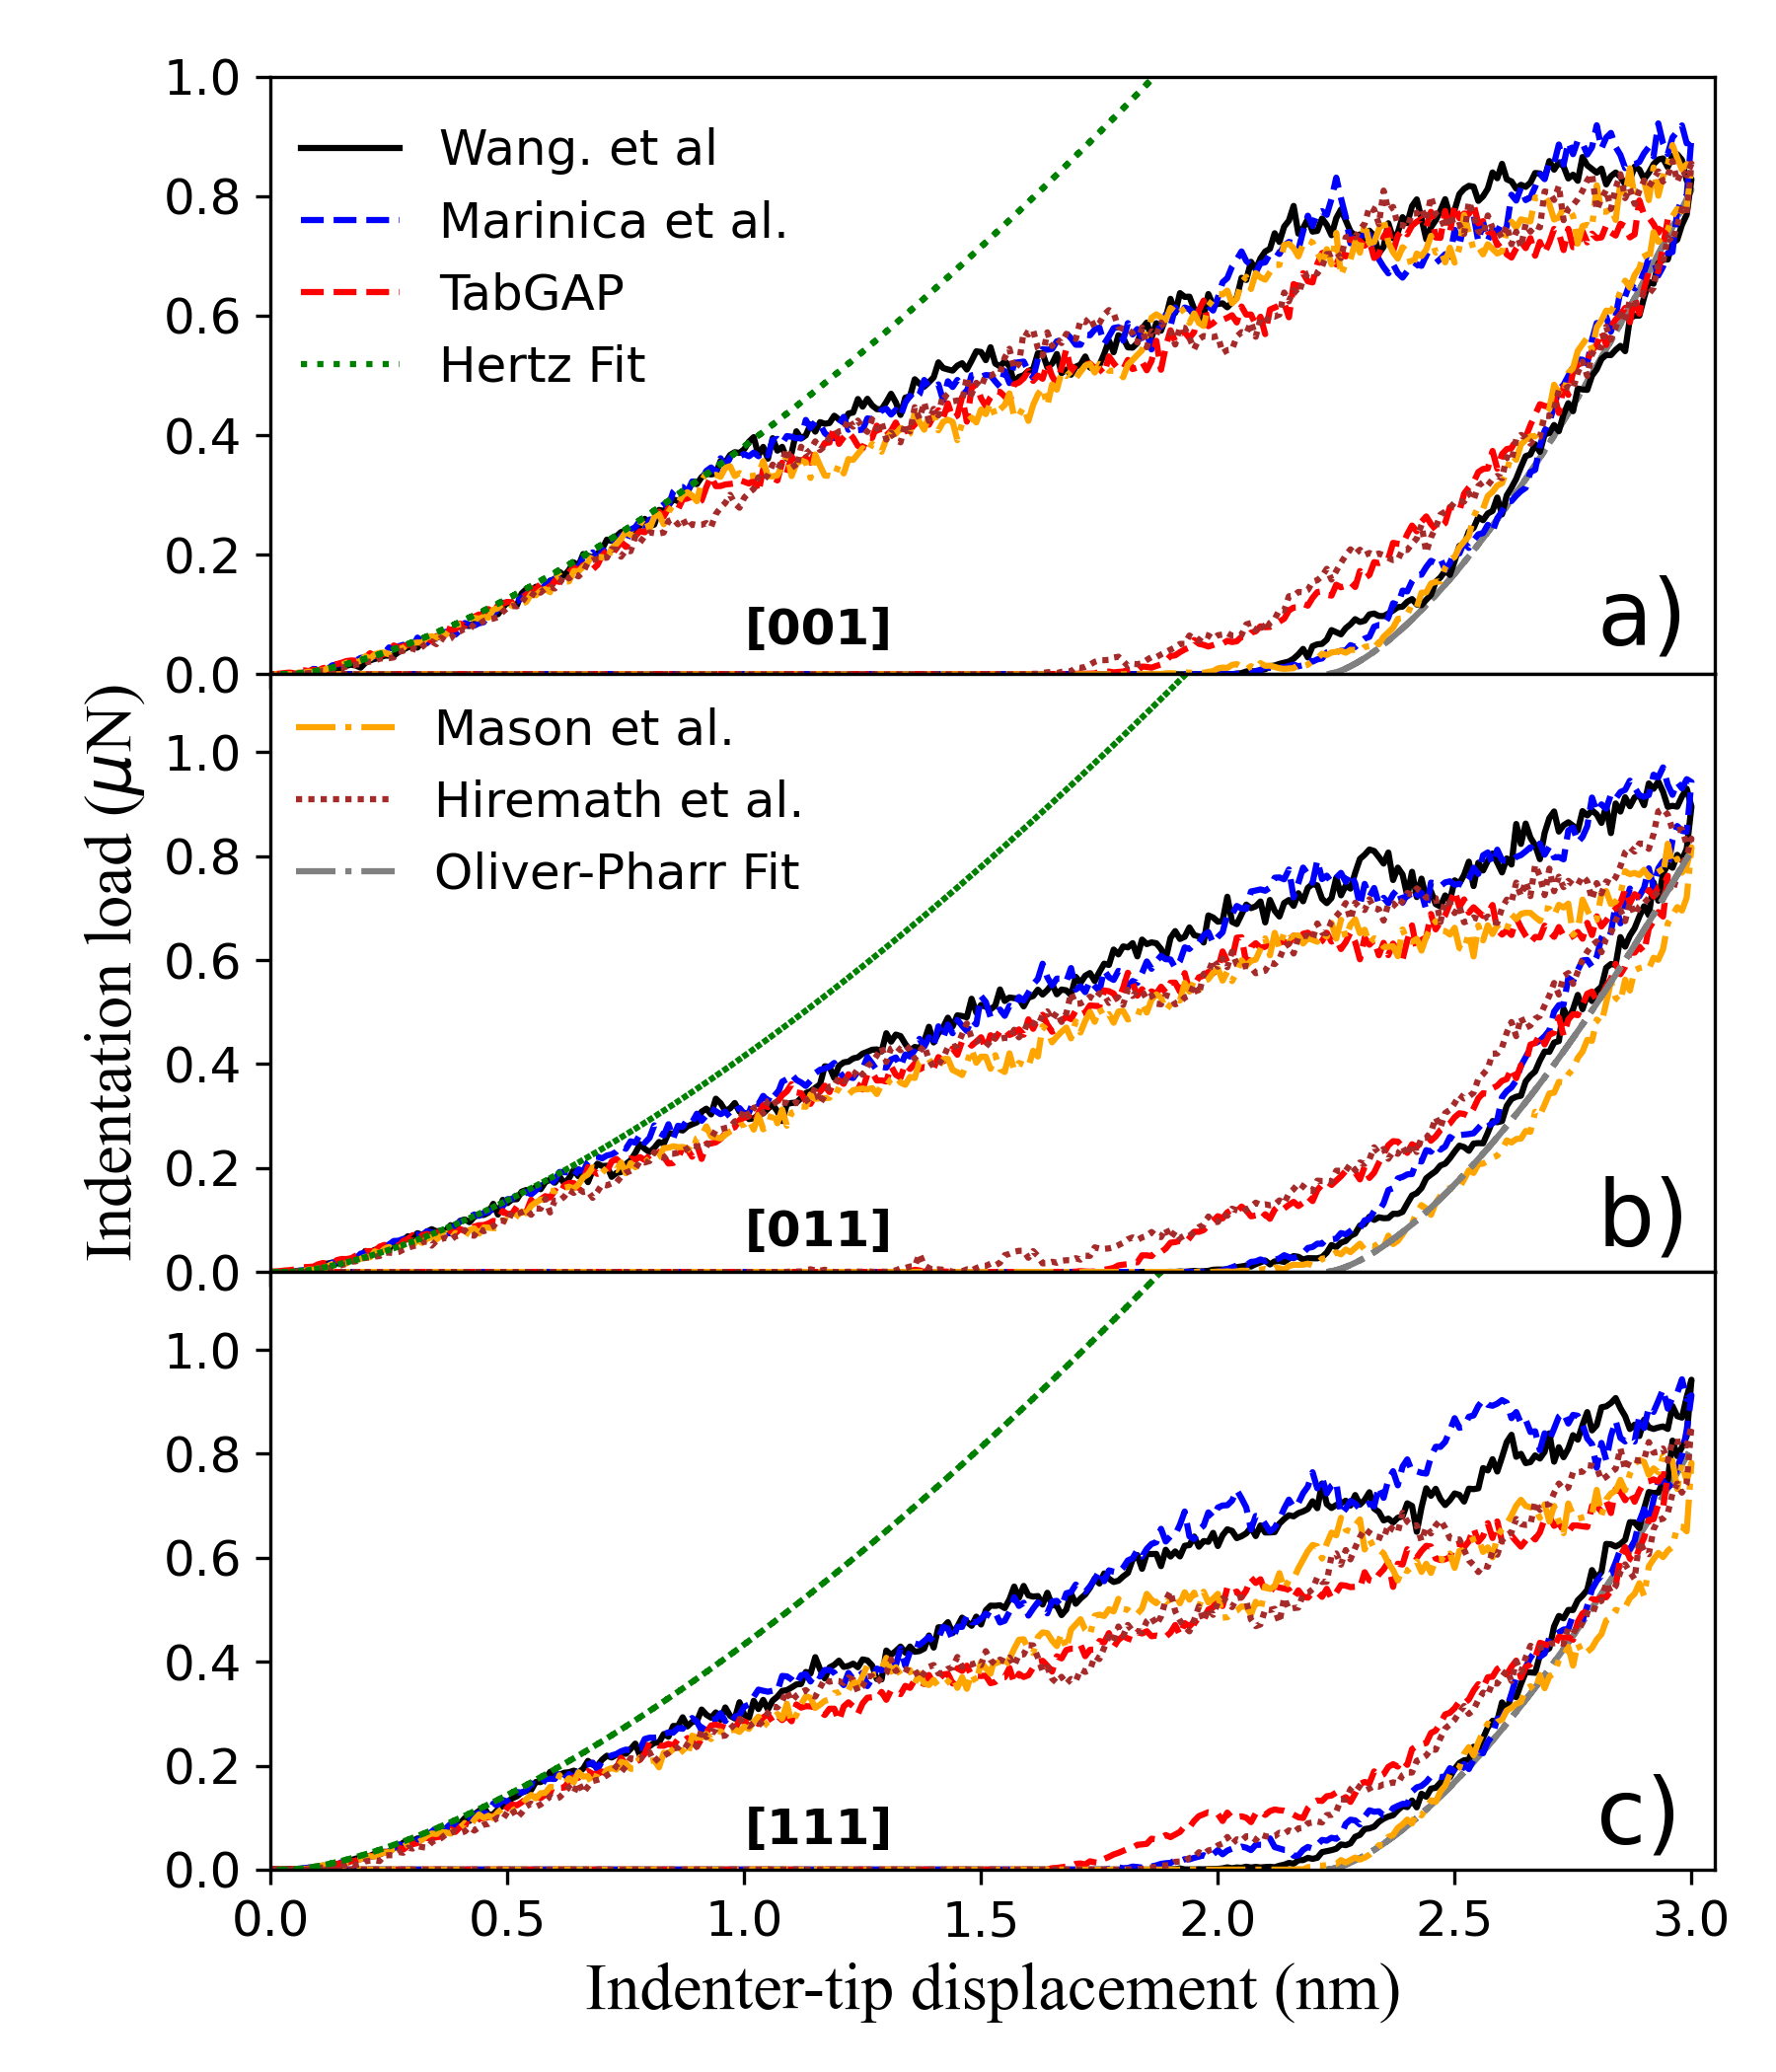
where is the indenter radius, is the indenter displacement, and is the effective elastic modulus. Thus, the elastic to plastic deformation transition can be identified during the loading process by the pop–in event that is well modeled by all the approaches; which can be correlated to experimental results to study stress distributions under the tip which is in a good qualitative good agreement to the data reported by Beake et al. [13, 10]. In our MD simulations, the elastic unloading relaxation is performed for long time allowing W atoms to be chemically active and mobile under all interaction forces during the elastic and plastic relaxation of the material.
The effect of the crystal orientation is observed by identifying the pop-in event where a sequence is found by every approach used following the characteristic maximum pop–in load for [001] orientation and the minimum one for [111] orientation for BCC metals [16, 18, 26]. For the indentation mark left by the tip, tabGAP and MEAM potentials report similar trends. All approaches report the similar value for the critical pop-in load and effective Young’s modulus regardless of the crystal orientation; albeit of the recombination effects observed at nm depth by the MD simulations.
The proper description of the nanoindentation test by recorded LD curves is of importance in materials design, where W is used for calibration of the nanoindenter machine in most of the cases [13]. Thus, the hardness of the indented sample is calculated by applying the Oliver and Pharr method [41] following the fitting curve to the unloading process curve as:
| (5) |
with is the indentation load; is the indentation depth and is the residual depth after the whole indentation process; and and are fitting parameters that is added to the unloading curve in Fig. 1. Therefore, the nanoindentation hardness can be computed as: where is the maximum indentation load at the maximum indentation depth, is the projected contact area with as the indenter tip radius which similar values by all interatomic potentials.
3.1 Dislocation nucleation and evolution
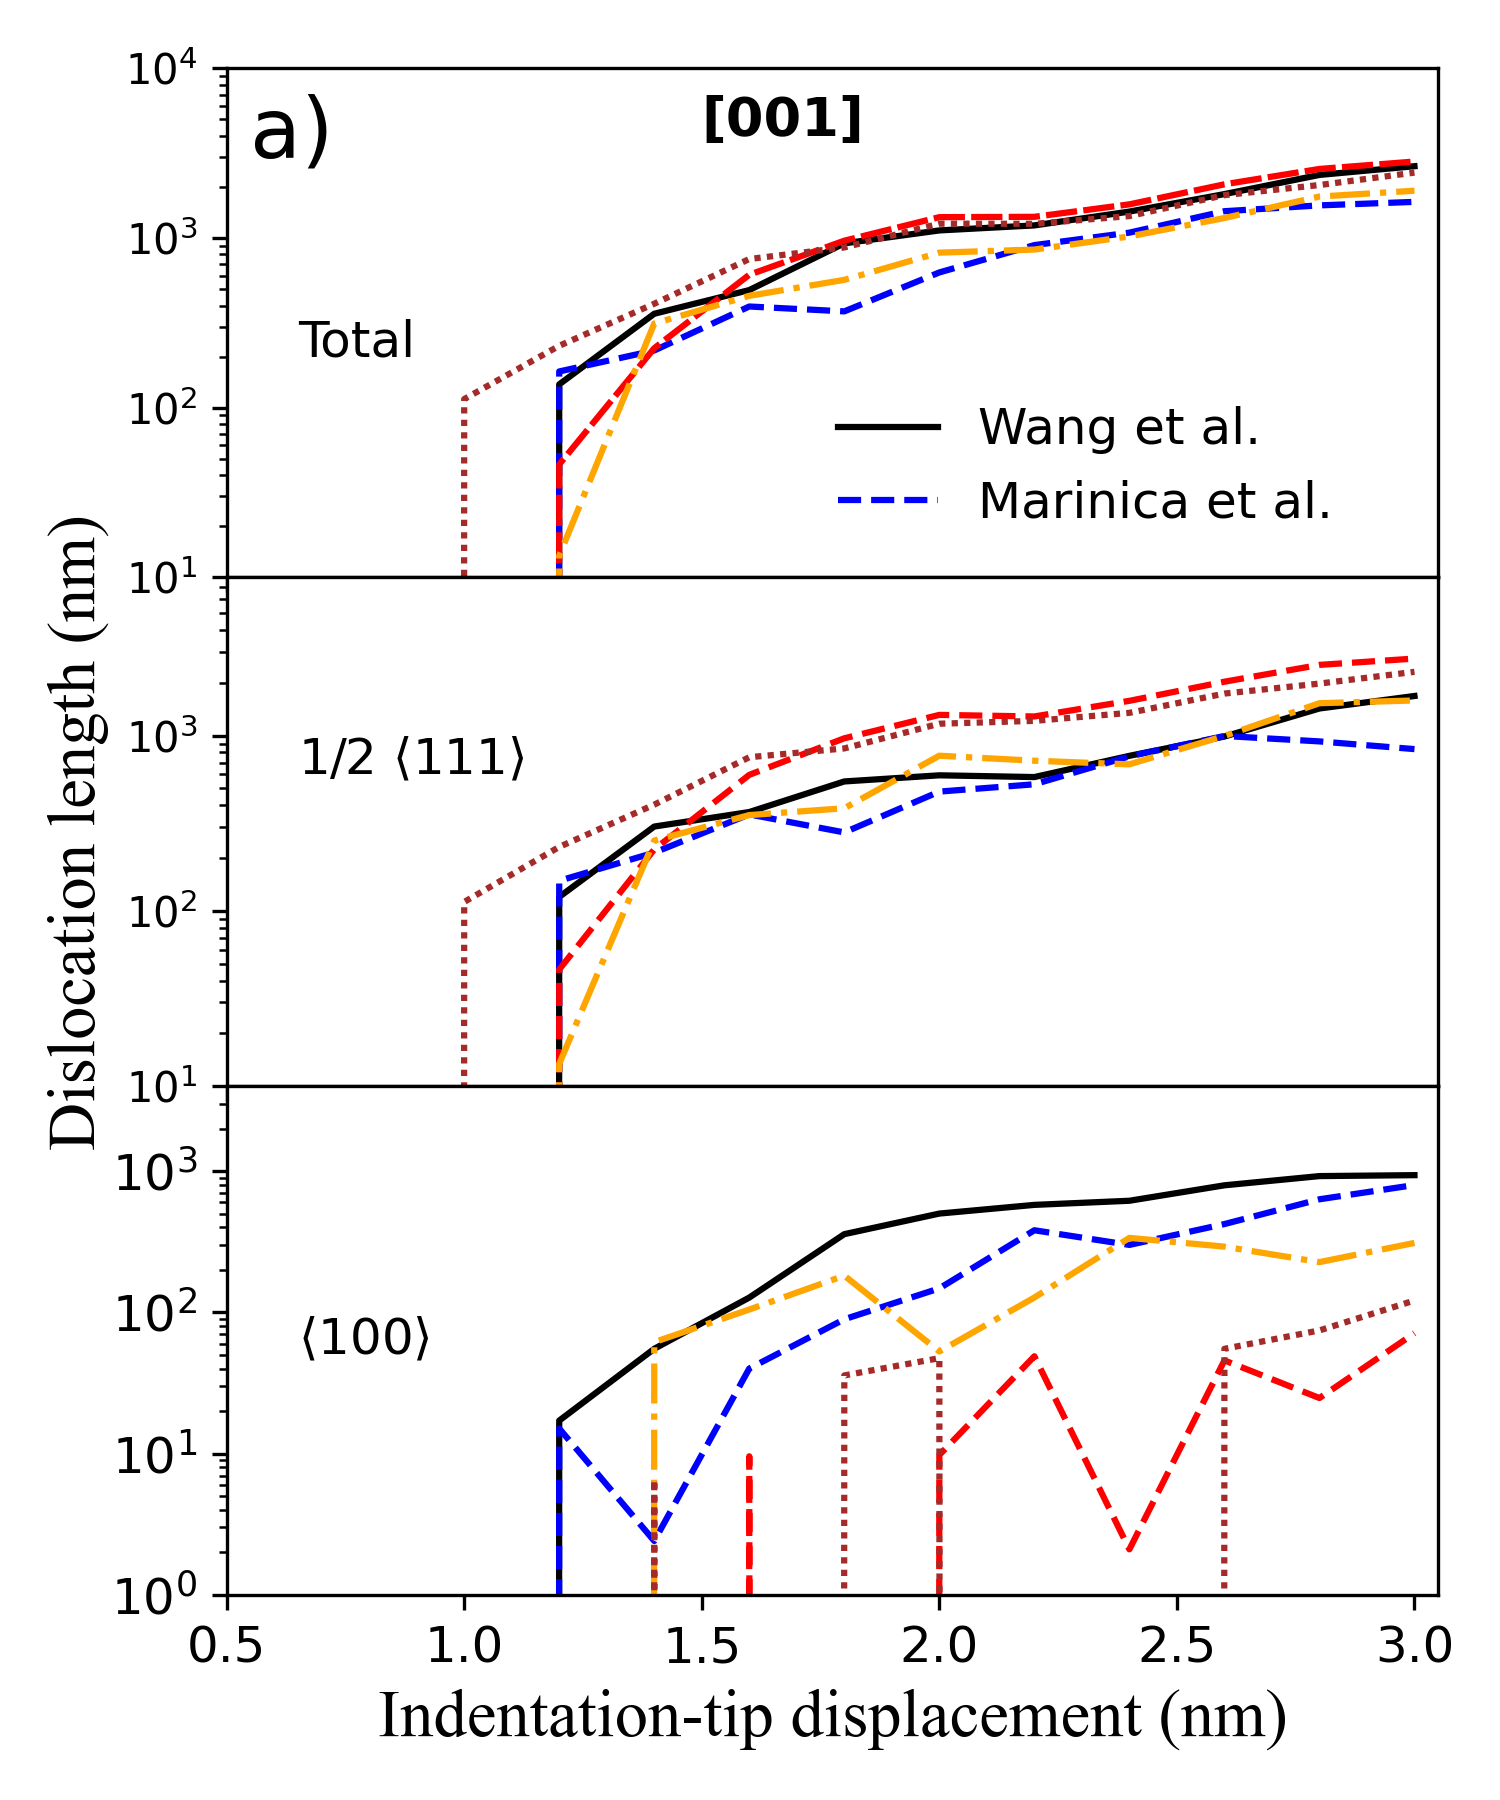
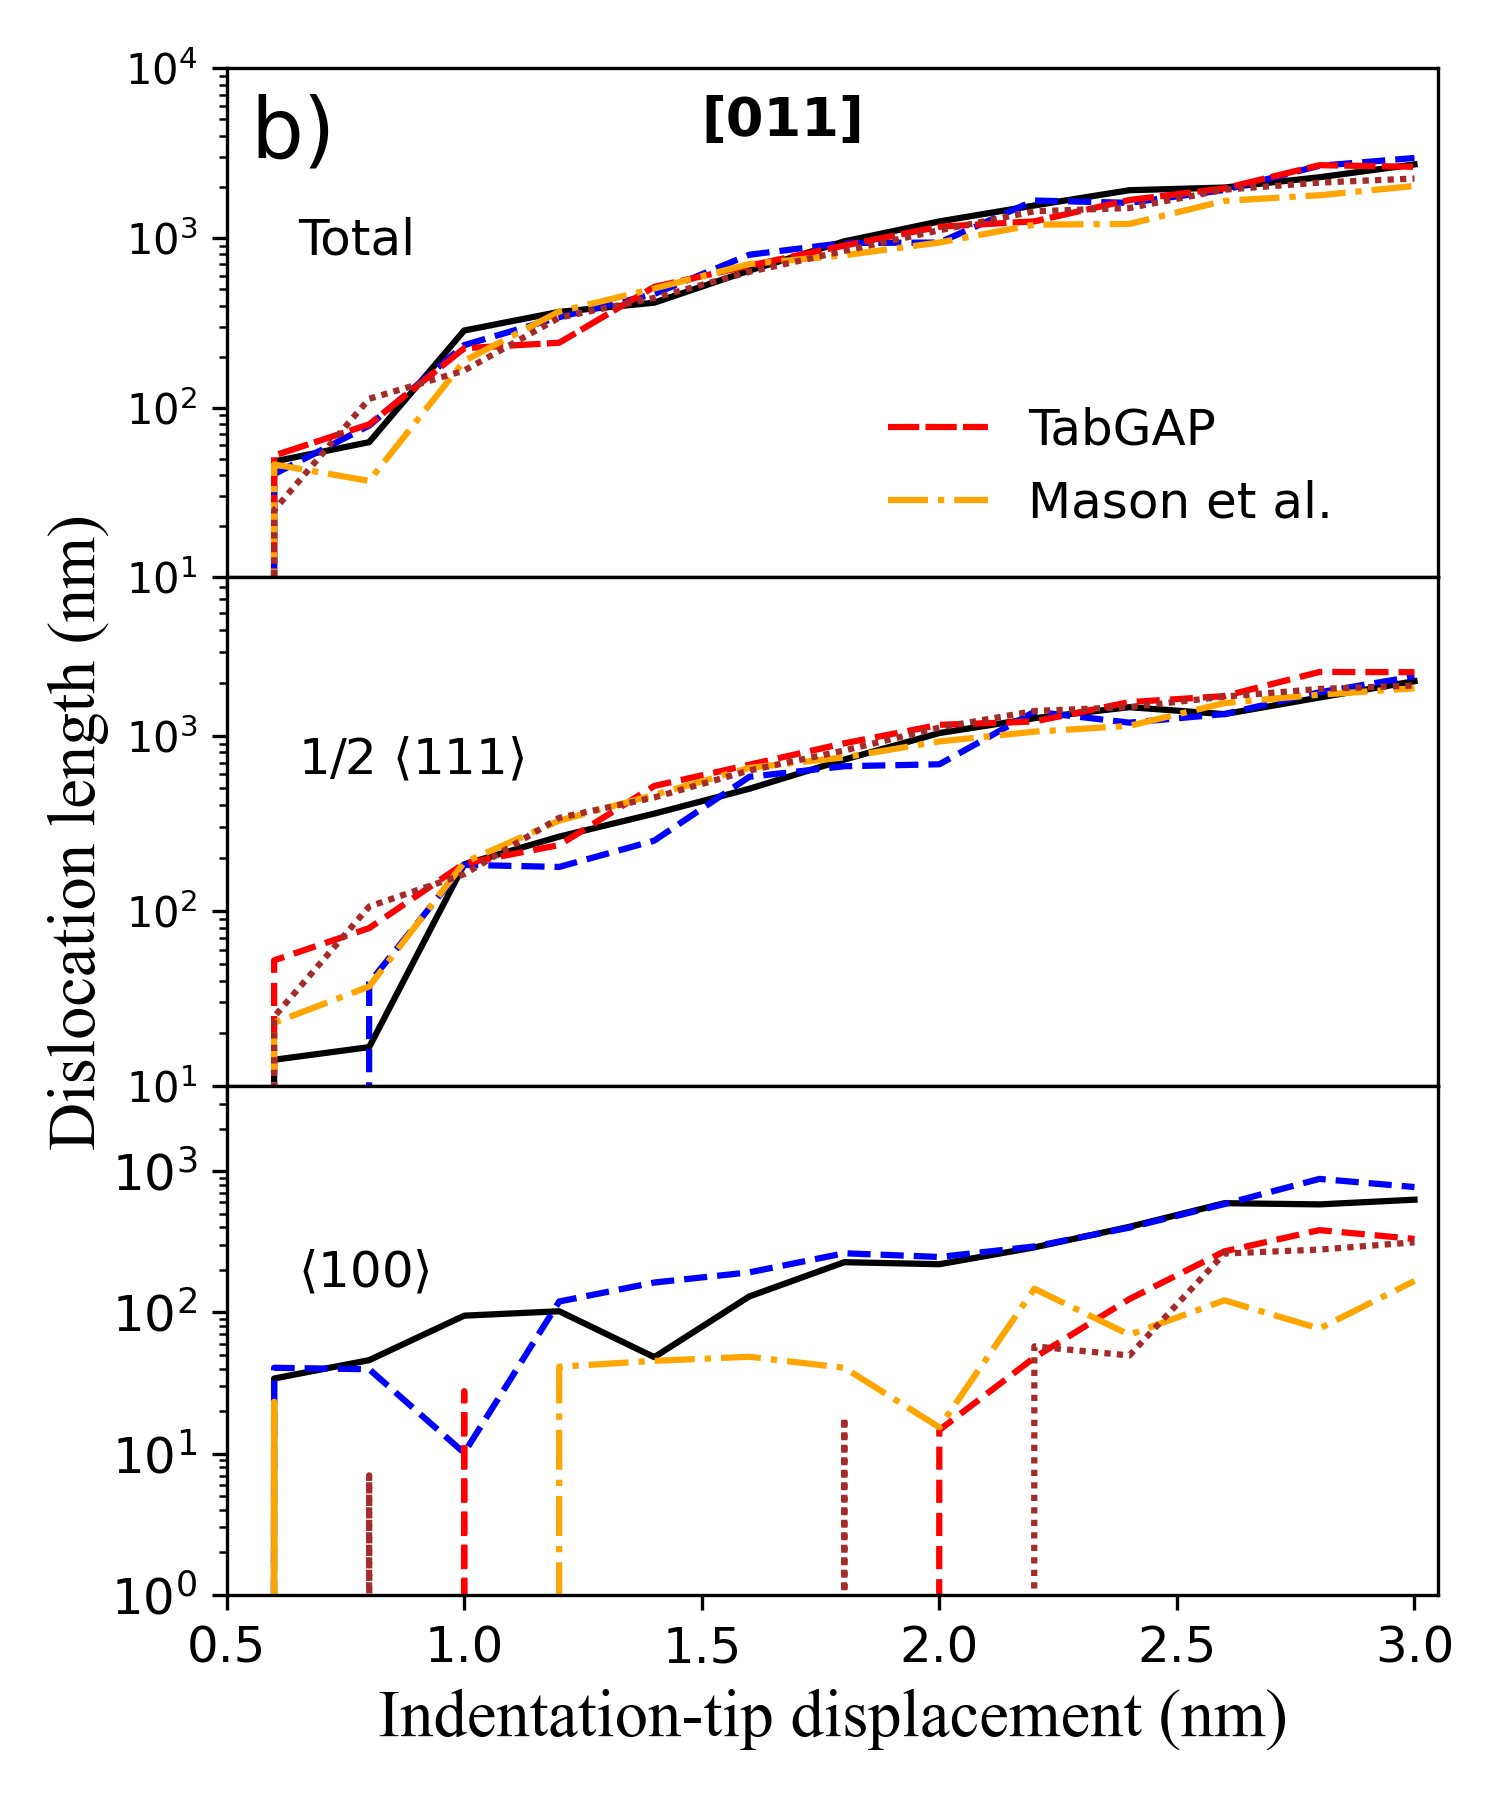
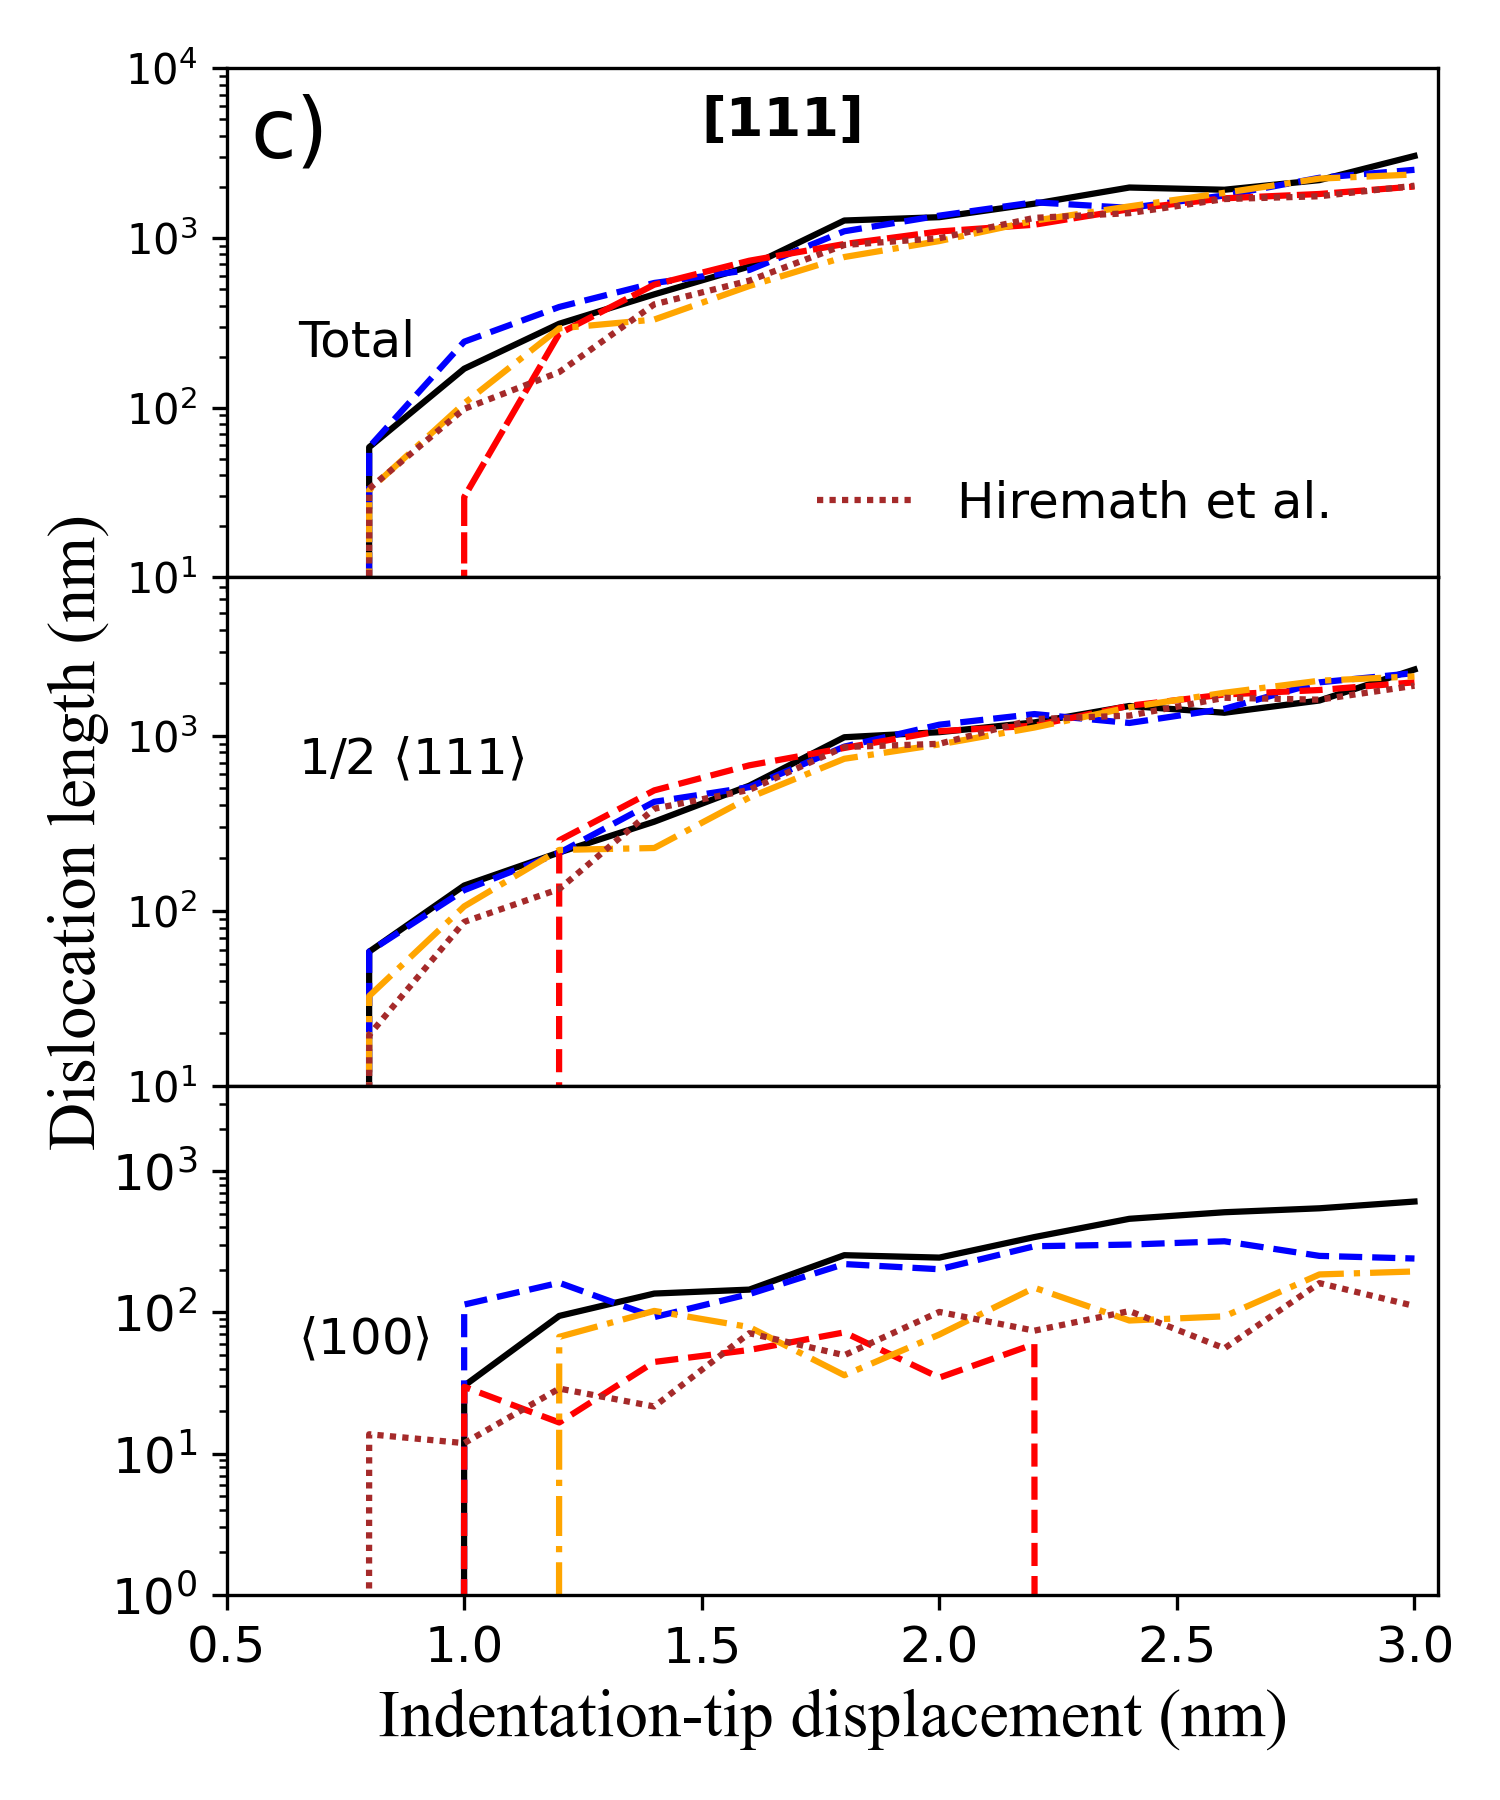
In order to analyze the dislocation nucleation and evolution of the sample during mechanical testing, we identify the different types of dislocations nucleated at different indentation depth by using OVITO [42] with the DXA package [43], which provides information of the Burgers vector associated to each dislocation. Thus, we categorized the dislocations into several dislocation types according to their Burgers vectors as: , , and dislocation types. We compute the dislocation density, , as a function of the depth as
| (6) |
where is the number of dislocation types, is the dislocation length of each type, and is the volume of the plastic deformation region by using the approximation of a spherical plastic zone; where is the largest distance of a dislocation measured from the indentation displacement, considering a hemispherical geometry , as shown in Fig 2.
In general, dislocation glide occurs in the closest-packed directions for BCC metals with Burgers vector , and slip planes belong to the {110}, {112}. To analyze the atomic structure during nanoindentation test which provides information about the mechanisms of dislocation nucleation and evolution [44], we compute the dislocation density at different indentation depths. The output data is reported in Fig. 2 that provides the total, type, and type dislocation density as a function of the indentation depth during loading process for [001] in a), [011] in b), and [111] in c) crystal orientations. All MD simulations results show oscillations of the dislocation length during the loading process for the dislocation junction, and the identified drop minimum at 2 nm depth for the total length is related to the nucleation of a single prismatic loop. Note that all potentials are different for the nucleation and evolution of the dislocation junction, where information and good representation of the surface energy and its interaction with the indenter tip leads to the mechanism of this junction nucleation. We note that this kind of defect is common underneath the indenter tip where the interaction or dissociation of dislocation leads to dislocation junction nucleation.
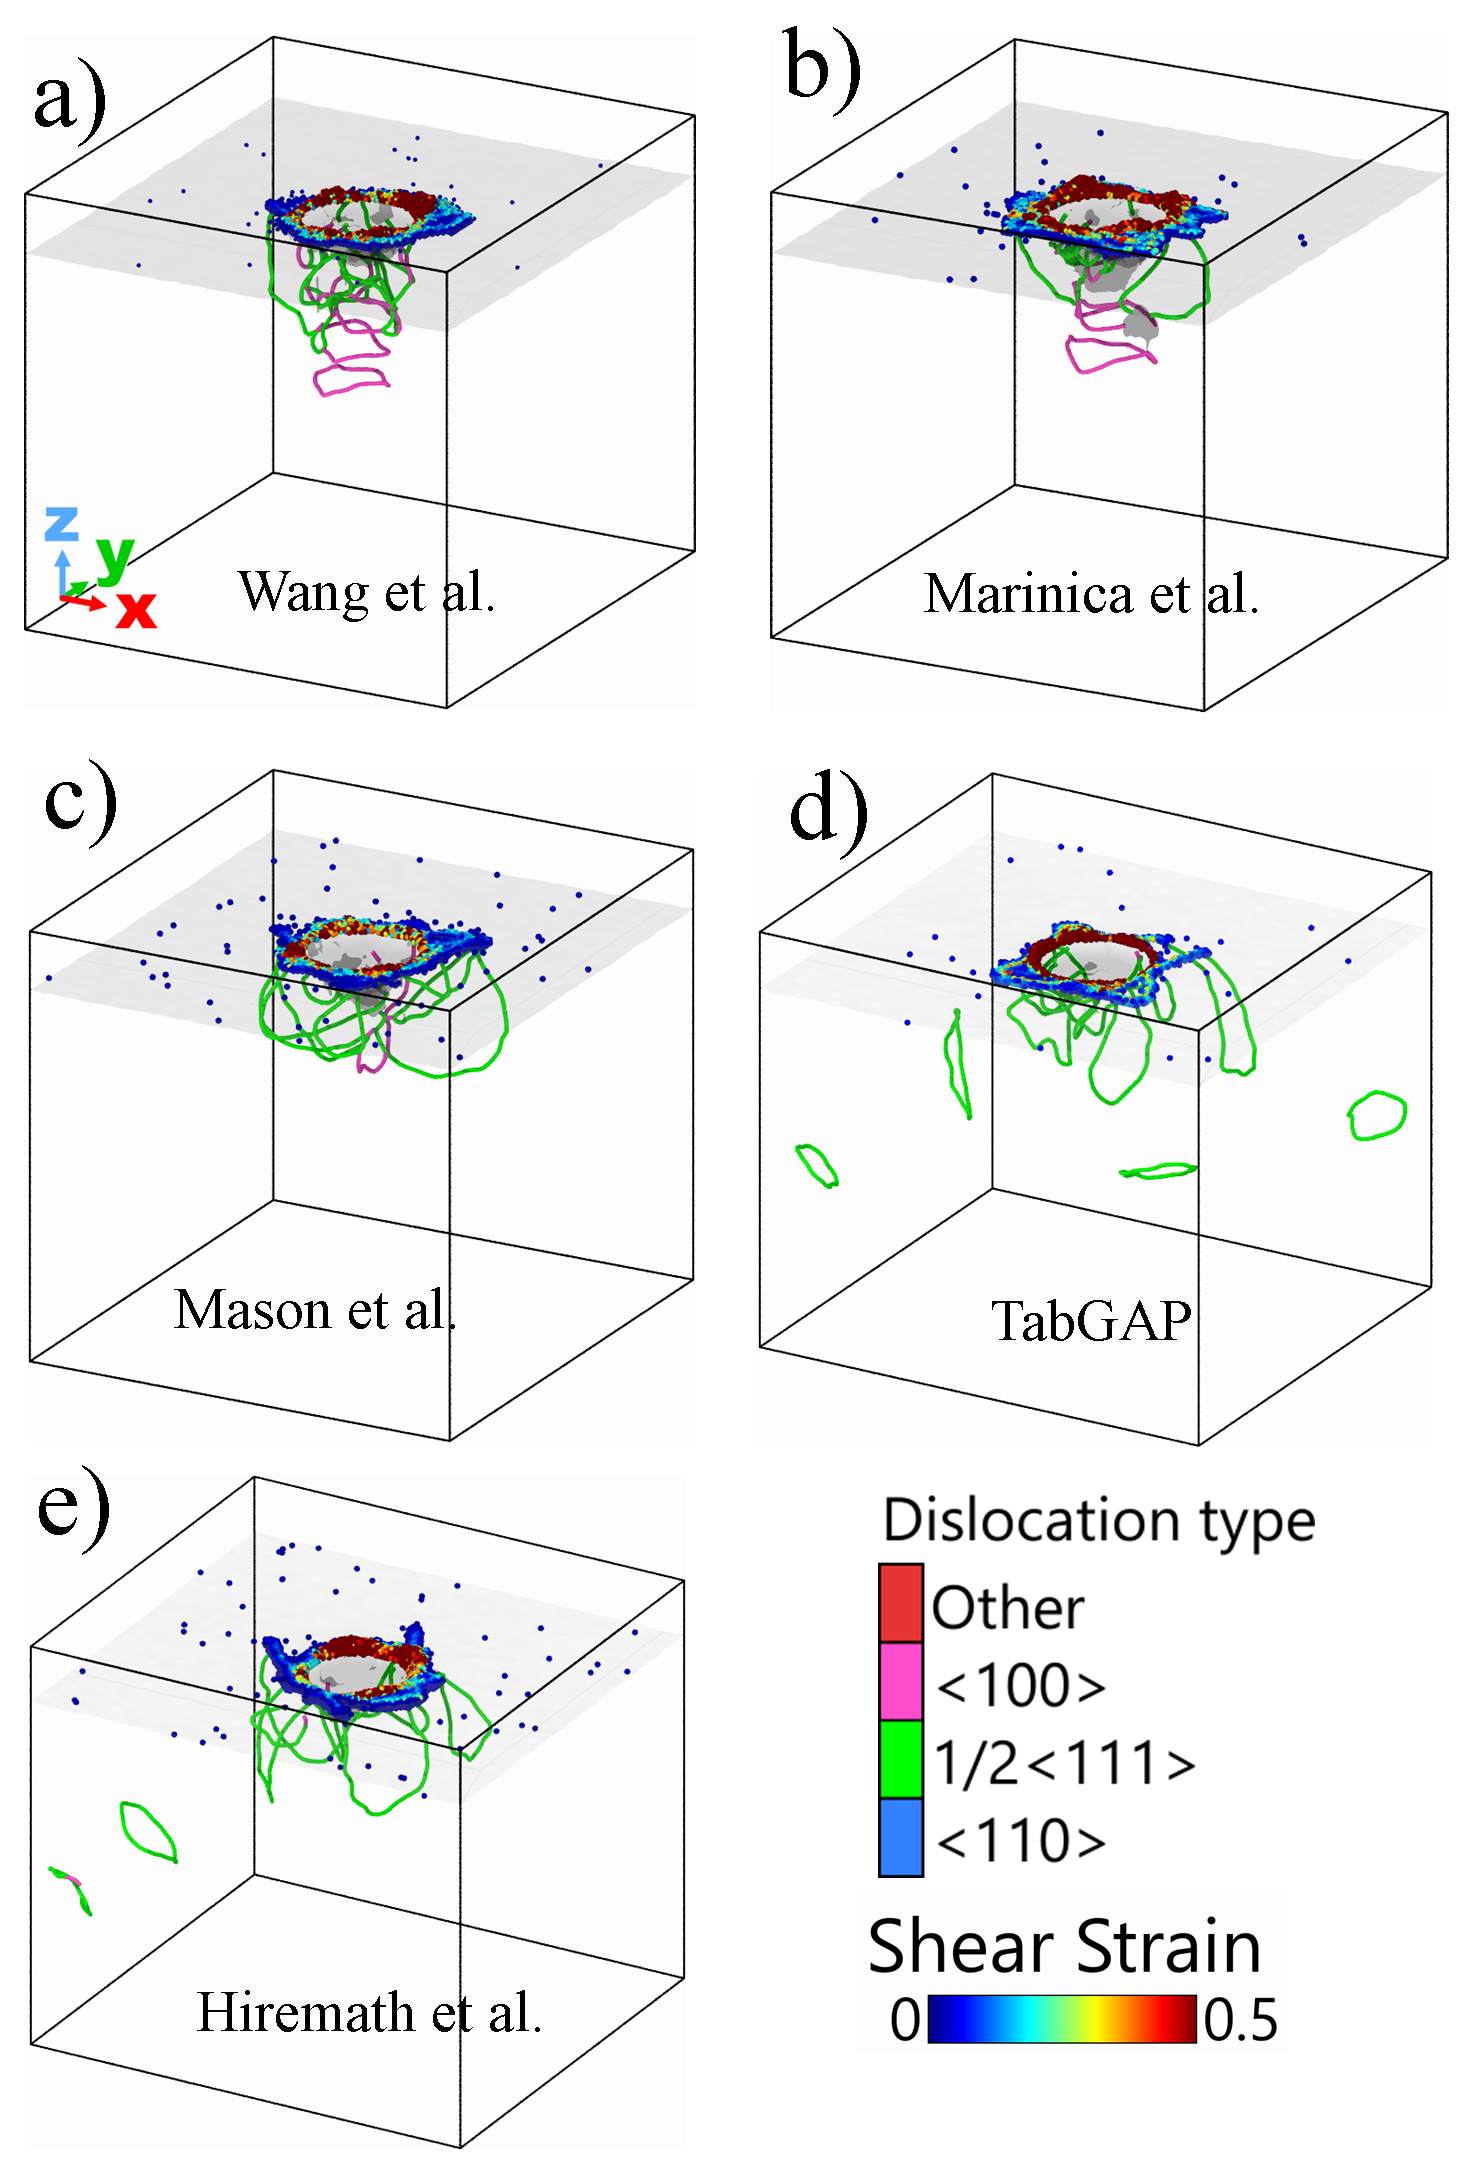
It is noted that all the potentials model the dynamics of the elastic to plastic deformation transition differently, as shown in Fig 3. Here, we visualize the dislocation network nucleated at the maximum indentation depth for the [001] crystal orientation, as well as the atomic shear strain mapping that shows pile-ups formation and slip traces due to indentation with a maximum strain for region around the indenter tip. This is the main difference between the MD simulations performed by every approach.
The MD simulations performed by using Wang et al. (Fig. 3a) and Marinica et al. (Fig. 3b) potentials show similar results where prismatic loops are nucleated. This is likely due to loops being more stable than 1/2 loops in these potentials [45]. In contrast, in the MD simulations with the potential by Mason et al., 1/2 half loops are nucleated following the slip families (Fig. 3c). Moreover, tabGAP (Fig. 3d) and Hiremath et al (Fig. 3e) report similar results for the dislocation nucleation and dynamics where 1/2 prismatic loops follow the [110] slip system and symmetrical one; which is expect to observe in the experiments [13, 10]. Besides, the lasso–like dislocation is nucleated by all the approaches where a single prismatic loop is nucleated at a range of 1.0 to 1.5 nm, depending on the approach. The visualization of the dislocation dynamics during nanoindentation test for [011] and [111] orientations are reported in the supplementary material.

The formation of slip traces at the surface is of importance to manifest crystal plasticity process during nanoindentation test where the traces are indicative of the underlying dislocation glide processes occurring in the subsurface, as depicted in Fig. 4 for the maximum depth (upper panel) and after unloading (lower panel) of [001] W sample. Due to the interface between the W sample and vacuum, the interatomic potentials are required to describe properly the interaction of terraces during the development of plastic hillocks that exhibits a marked directionality as a function of crystalline orientation, as do slip traces. Although the rosettes presented by MD simulations show the typical four-fold one for BCC metal on the [100] orientation as reported experimentally for W [10] and MD simulations for BCC Fe [18], the displaced atoms are in different arrangements; showing the need of accurate modeling for open boundaries simulations.
During the loading process, there is a competition between screw and edge glide processes of the dislocation loops at the surface that is modeled in different way by the chosen MD potential, leading to a couple of distinguishable patterns in terms of slip trace formation, as presented at the upper panel of Fig. 4. The observed correspondence between the nucleated loops and the propagation of slip traces can only be understood by considering the associated dislocation glide direction is directed towards the surface plane. From our MD simulations, the formation of indentation plastic imprints is a process associated to the onset of plastic bursts during mechanical loading that is modeled in similar manner by tabGAP and the modified EAM potential, where our results are in good agreement with experimental SEM and AFM images [10, 12].
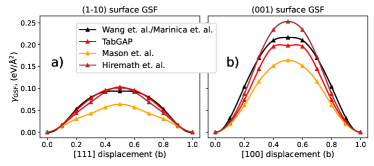
Characteristically, the stacking fault energy scales as , while dislocation energies as , suggesting that a fundamental difference in should influence and amplify effects that distinguish dislocations from stacking faults during mechanical deformation simulations. Fig. 5 shows results for the generalized staking fault energies that are computed by defining the –line by cutting a perfect crystal with two free surfaces and displacing the two parts relative to each other on the chosen direction parallel to the cut plane; with periodic boundary conditions applied along the cut plane. For each displacement vector, the atomic positions are relaxed only in the direction perpendicular to the cut plane [46]. Using unit cells from dislocation objects with l.u. surface area and 30 l.u. perpendicular to the cut plane and a force tolerance for relaxation of 0.01 eV/Å. These results confirmed the different shapes of the slip traces showing that Mason et al potetentials sub-estimate the SFEs.
3.2 Nanoindentation size effects
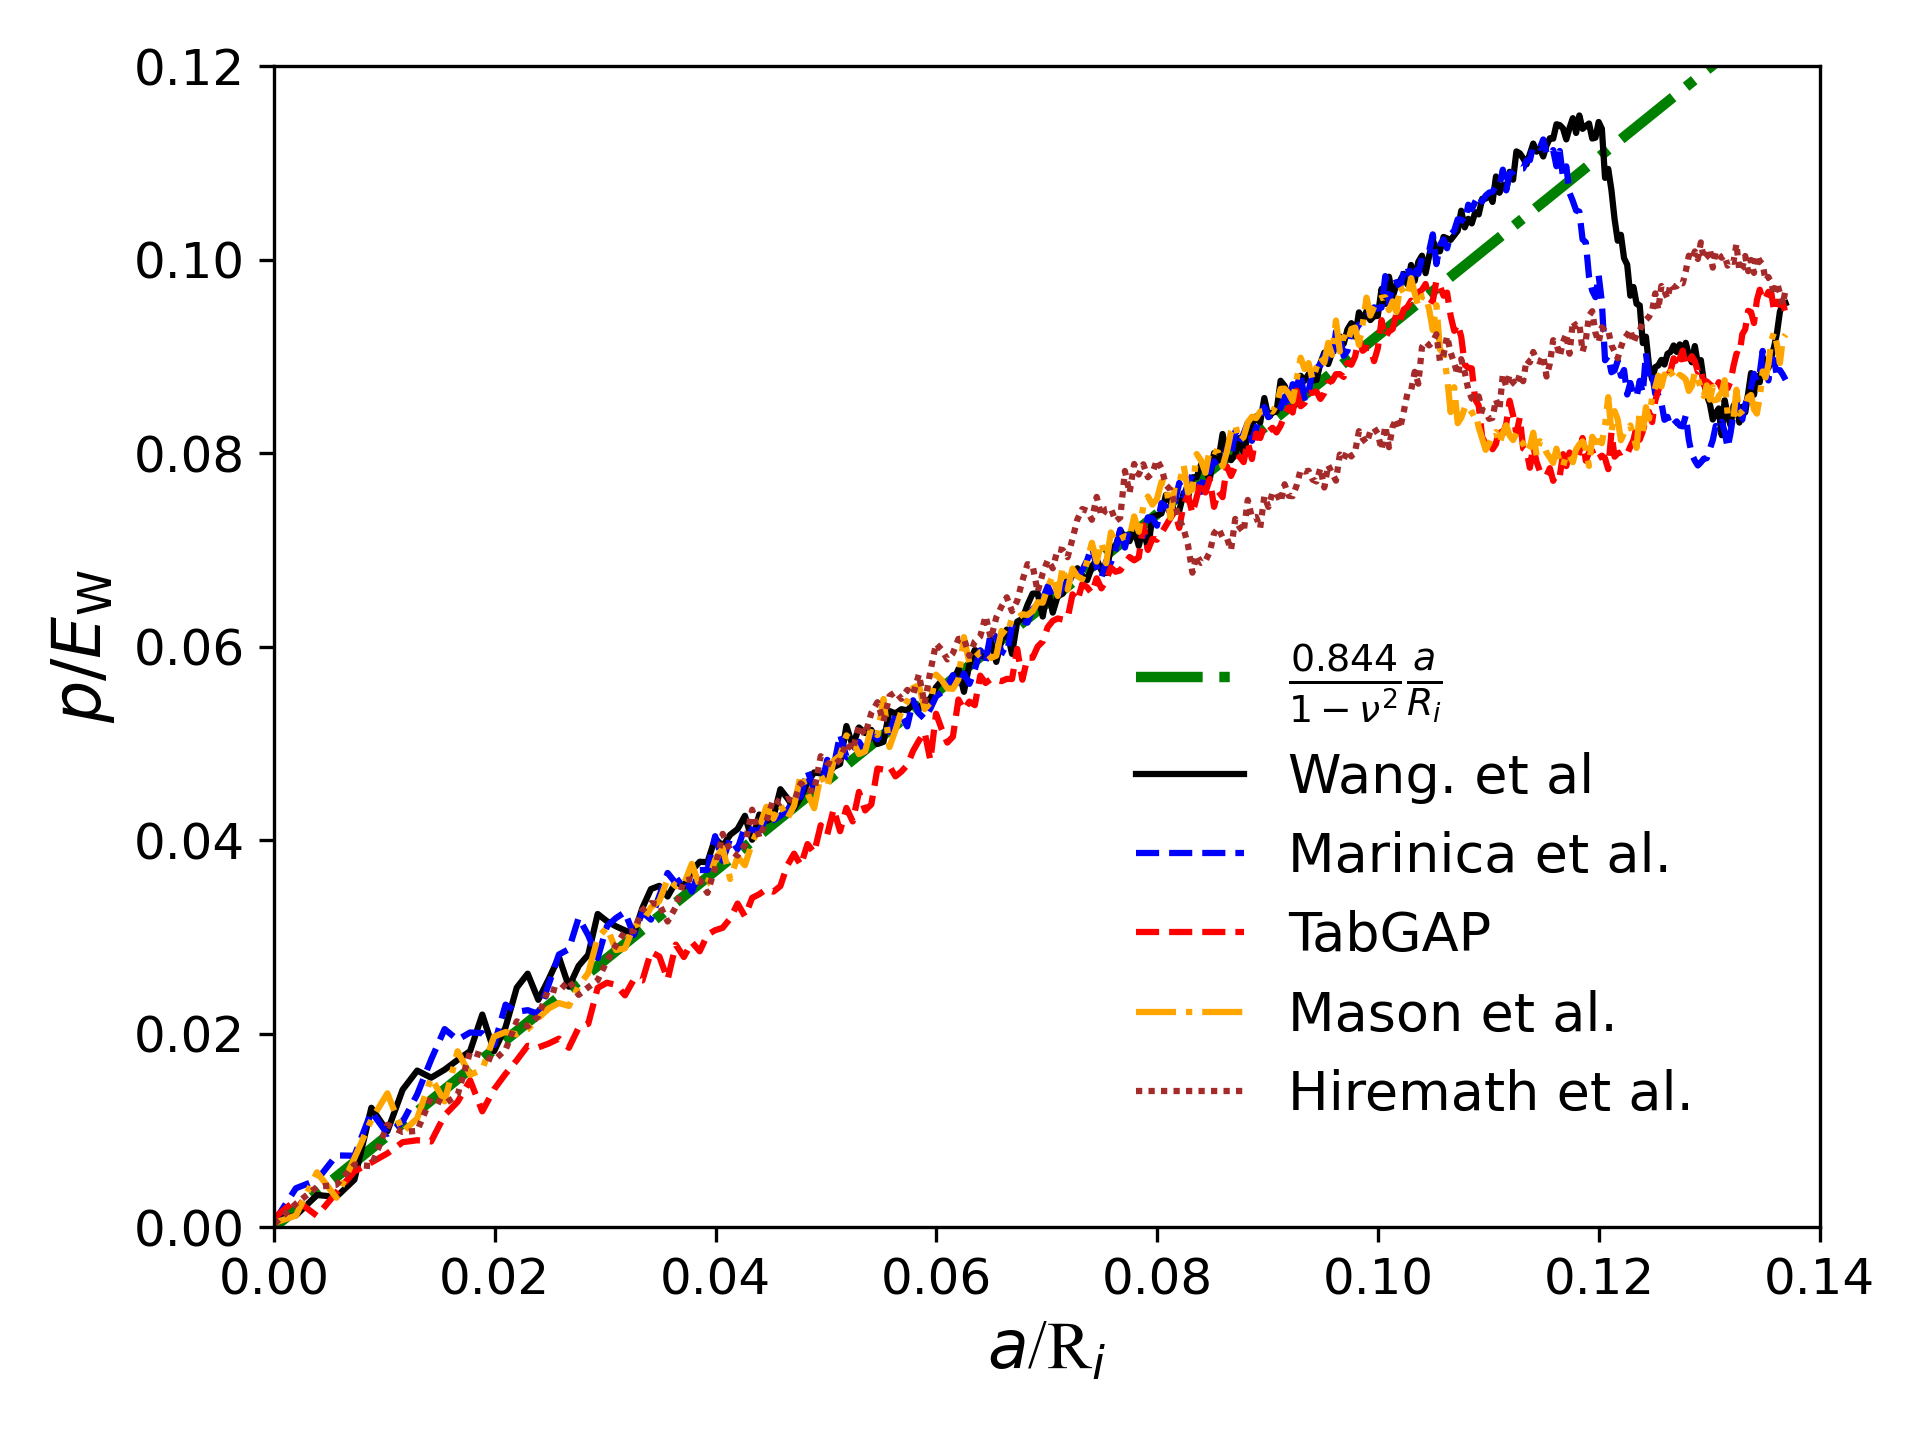
In order to obtain more information about the nanomechanical response during loading, we perform MD simulation by considering an indenter tip radius nm to calculate the indentation stress and strain [14]; by taking into account the contact radius between the sample and the tip by using the geometrical relationship . This expression allows us to write the contact pressure as a function of the depth as: , where is the indentation load. Fig. 6 shows the evolution of the contact pressure normalized to the Young’s modulus ratio of each approach as: , as a function of the normalized contact radius, . The results seem to follow the universal linear relationship as [14]: . Here the elastic to plastic deformation transition is observed to happen at different ”nanoindentation strain”.
In Fig. 7, we present the dislocation network at the maximum indentation depth by identifying the screw (red lines) and edge (blue lines) dislocation for all the approaches. In addition, we include the atoms identified as FCC and HCP underneath the indenter tip as modeled by different methods. Results show the dislocation evolution in a larger scale than thos presented in Fig. 3, noticing that screw dislocations are mainly located into the plastic region which is underneath the tip. While, edge dislocation are mainly distributed deep inside the sample. An important discrepancy is observed during the nucleation of atomic defects; TabGAP and modified EAM potentials tend to nucleate the minimum number of atoms, and EAM+ZBL overstimates phase transition and nucleation of FCC atoms due to contact pressure. This is a key difference due to variations on the Burgers vector that is defined for BCC crystals as , it is clear that the potentials are expected to have distinct effects on plastic deformation features, such as stacking fault formation and dislocation proliferation.

It is well known that dislocation glide in BCC metals is mainly governed by the Peierls barrier, which measures the stress that needs to be applied in order to move a dislocation core to the next atomic valley in the glide plane. Thus, the ‘lasso‘ mechanism, as mentioned, is observed by all methods, suggesting that the main dislocation nucleation mechanism remains analogous to other BCC metals [14, 40]. Moreover, the Peierls barrier is smaller for edge dislocations than for screw dislocations, where the BCC metal plasticity is dominated by the sluggish glide of screw dislocation segments, as shown by our MD simulations [27, 47].
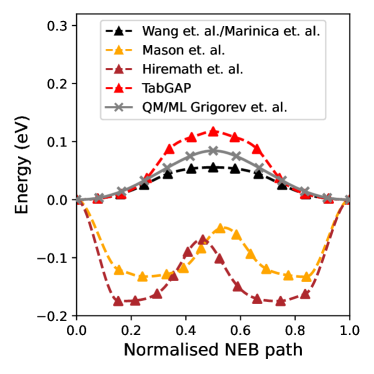
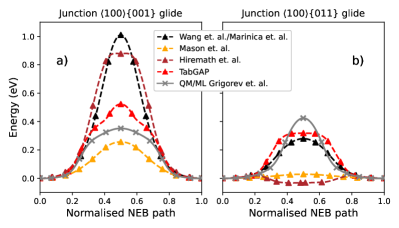
We calculate the screw dislocation glide barriers between two easy cores by means of the NEB method with a force tolerance of 0.025 eV/ used in the minimization. Initial path with 11 intermediate images were obtained by linear interpolation of the atomic positions between initial and final configurations that were relaxed with force tolerance of 0.001 . The starting dislocation configurations for relaxation were obtained with anisotropic elasticity method within the Stroh formalism [48] using the elastic constants reported in table 1. As presented in Fig. 8 and 9, tabGAP seems to have overall best compromise: comparable barriers for two junction dislocations glide planes as well as reasonable screw dislocation barriers. All other potentials get at least something mislead: a) Hiremath et al. and Mason et al. potentials poorly represents screw dislocation core stability. b) Marinica et al. and Hiremath et al. significantly overestimate the glide barrier for a junction dislocation in the {001} glide plane; and b) Hiremath et al. and Mason et al. predict almost zero glide for the junction dislocation in the {011} glide plane. The obtained results can guide experiments on the understanding of the fundamental mechanisms for dislocations nucleation with in situ transmission electron microscopy (TEM) images [49].
A final remark on the use of different interatomic potentials is the computational time and resources that need to be utilized for performing MD simulations of nanoindentation test. Thus, the lammps software was used in the institutional linux cluster with 120 Intel(R) Xeon(R) CPU E5-2680 v2 processors at 2.80GHz with computer wall time of 269 mins for Marinica et al; 165 mins for Wang et al.; 63 mins for Mason et al. (EAM+FS); 1569 min for Hiremath et al. (Modified EAM); and 3315 mins for tabGAP. Although the tabGAP simulations are faster than the original GAP approach, it is considerable slower than EAM based simulations and provides a better modeling for mechanical testing, as shown in this paper.
4 Concluding remarks
In this work, MD simulations by using different interatomic potentials like traditional EAM potentials, a recently developed tabulated Gaussian approximation potential and a modified EAM approaches are performed to investigate the nanomechanical response of crystalline W during nanoindentation tests for [001], [011], and [111] orientations. We analyzed the dislocation nucleation and evolution mechanisms described by all approaches. We characterized the nanoindentation process in W by tracking shear strain accumulation and displacement atoms mapping that can be compared to SEM investigations. Our work is summarized as follows: 1) the comparison between the potentials report similarities for the recorded load displacement curves, as well as the rosettes formed at the surface projections of the preferential gliding direction during nanoindentation; 2) dislocation nucleation mechanisms are modeled in a different way during nanoindentation test due to difference of the Burgers vector magnitude related to stacking fault formation and dislocation dynamics. Although a prismatic loop is nucleated by both approaches, the dynamics is modeled in different manners, where tabGAP and MEAM report similar results. Based on the present results, we conclude that nanomechanical tests can be modeled by several interatomic potentials where the load displacement and stress–strain curves can be similar. However, dislocation dynamics depends on the approach used to developed the MD potentials exhibit by NEB calculations of screw and edge dislocation glide of 1/2 and Junction and energies, and stacking fault energies showing that tabGAP simulations can emulate nanoindentation test as close as possible to experiments. In our future work, we will investigate the nanomechanical response of chemically complex BCC metals under external load by using recently developed tabGAP potentials that can be compared to experimental SEM and TEM images.
Acknowledgements
We would like to thank M-C Marinica for inspiring conversations. We acknowledge support from the European Union Horizon 2020 research and innovation program under grant agreement no. 857470 and from the European Regional Development Fund via the Foundation for Polish Science International Research Agenda PLUS program grant No. MAB PLUS/ 2018/8. We acknowledge the computational resources provided by the High Performance Cluster at the National Centre for Nuclear Research in Poland. PG gratefully recognizes support from the Agence Nationale de Recherche, via the MeMoPAS project ANR-19-CE46-0006-1 as well as access to the HPC resources of IDRIS under the allocation A0090910965 attributed by GENCI.
Data Availability Statement
The raw data and MD simulations results and nanoindentation tests of W sample visualization that support the findings of this study are available within the article and its supplementary material.
References
- [1] R. Pitts, S. Carpentier, F. Escourbiac, T. Hirai, V. Komarov, S. Lisgo, A. Kukushkin, A. Loarte, M. Merola, A. Sashala Naik, R. Mitteau, M. Sugihara, B. Bazylev, P. Stangeby, A full tungsten divertor for iter: Physics issues and design status, Journal of Nuclear Materials 438 (2013) S48–S56, proceedings of the 20th International Conference on Plasma-Surface Interactions in Controlled Fusion Devices.
-
[2]
M. Rieth, J. Boutard, S. Dudarev, T. Ahlgren, et al.,
Review
on the efda programme on tungsten materials technology and science, Journal
of Nuclear Materials 417 (1) (2011) 463–467, proceedings of ICFRM-14.
doi:https://doi.org/10.1016/j.jnucmat.2011.01.075.
URL https://www.sciencedirect.com/science/article/pii/S0022311511001073 -
[3]
J. Pamela, A. Bécoulet, D. Borba, J.-L. Boutard, L. Horton, D. Maisonnier,
Efficiency
and availability driven r & d issues for demo, Fusion Engineering and
Design 84 (2) (2009) 194–204, proceeding of the 25th Symposium on Fusion
Technology.
doi:https://doi.org/10.1016/j.fusengdes.2009.02.028.
URL https://www.sciencedirect.com/science/article/pii/S0920379609001574 -
[4]
N. Holtkamp,
The
status of the iter design, Fusion Engineering and Design 84 (2) (2009)
98–105, proceeding of the 25th Symposium on Fusion Technology.
doi:https://doi.org/10.1016/j.fusengdes.2008.12.119.
URL https://www.sciencedirect.com/science/article/pii/S092037960900009X - [5] M. Mayer, M. Andrzejczuk, R. Dux, E. Fortuna-Zalesna, A. Hakola, S. Koivuranta, K. Krieger, K. J. Kurzydlowski, J. Likonen, G. Matern, Tungsten erosion and redeposition in the all-tungsten divertor of ASDEX upgrade, Physica Scripta T138 (2009) 014039.
- [6] P. Piaggi, E. Bringa, R. Pasianot, N. Gordillo, M. Panizo-Laiz, J. del RÃo, C. G. de Castro, R. Gonzalez-Arrabal, Hydrogen diffusion and trapping in nanocrystalline tungsten, Journal of Nuclear Materials 458 (2015) 233 – 239.
- [7] B. Lipschultz, et al., An assessment of the current data affecting tritium retention and its use to project towards t retention in iter, Techincal Report MIT PSFC/RR (2010) 10–4.
- [8] M. Kaufmann, R. Neu, Tungsten as first wall material in fusion devices, Fusion Engineering and Design 82 (5) (2007) 521 – 527.
- [9] T. Schwarz-Selinger, J. Bauer, S. Elgeti, S. Markelj, Influence of the presence of deuterium on displacement damage in tungsten, Nuclear Materials and Energy 17 (2018) 228 – 234.
- [10] K. MIYAHARA, S. MATSUOKA, N. NAGASHIMA, Nanoindentation measurement for a tungsten(001)single crystal, JSME International Journal Series A 41 (4) (1998) 562–568. doi:10.1299/jsmea.41.562.
- [11] Z. Wen, G. Xuanqiao, Z. Pingxiang, H. Zhongwu, L. Laiping, C. Jun, Nanoindentation size effect of tungsten single crystal, Rare Metal Materials and Engineering 46 (12) (2017) 3626–3632.
- [12] J. Wang, T. Volz, S. Weygand, et al., The indentation size effect of single-crystalline tungsten revisited, Journal of Materials Research 36 (2021) 2166.
- [13] B. D. Beake, S. Goel, Incipient plasticity in tungsten during nanoindentation: Dependence on surface roughness, probe radius and crystal orientation, International Journal of Refractory Metals and Hard Materials 75 (2018) 63–69.
- [14] J. Varillas-Delgado, J. Alcala Cabrelles, A molecular dynamics study of nanocontact plasticity and dislocation avalanches in fcc and bcc crystals, PhD dissertation, Universitat Politècnica de Catalunya. Departament de Ciència dels Materials i Enginyeria Metal·lúrgica (2019).
- [15] C. A. Schuh, Nanoindentation studies of materials, Materials Today 9 (5) (2006) 32–40. doi:https://doi.org/10.1016/S1369-7021(06)71495-X.
- [16] F. Domínguez-Gutiérrez, S. Papanikolaou, A. Esfandiarpour, P. Sobkowicza, M. Alava, Nanoindentation of single crystalline mo: Atomistic defect nucleation and thermomechanical stability, Materials Science and Engineering: A 826 (2021) 141912. doi:https://doi.org/10.1016/j.msea.2021.141912.
-
[17]
L. Kurpaska, F. Dominguez-Gutierrez, Y. Zhang, K. Mulewska, H. Bei, W. Weber,
A. Kosińska, W. Chrominski, I. Jozwik, R. Alvarez-Donado, S. Papanikolaou,
J. Jagielski, M. Alava,
Effects
of Fe atoms on hardening of a nickel matrix: Nanoindentation experiments
and atom-scale numerical modeling, Materials & Design 217 (2022) 110639.
doi:https://doi.org/10.1016/j.matdes.2022.110639.
URL https://www.sciencedirect.com/science/article/pii/S026412752200260X - [18] J. Varillas, J. Ocenasek, J. Torner, J. Alcala, Unraveling deformation mechanisms around fcc and bcc nanocontacts through slip trace and pileup topography analyses, Acta Materialia 125 (2017) 431–441. doi:https://doi.org/10.1016/j.actamat.2016.11.067.
- [19] G. Po, Y. Cui, D. Rivera, D. Cereceda, T. D. Swinburne, J. Marian, N. Ghoniem, A phenomenological dislocation mobility law for bcc metals, Acta Materialia 119 (2016) 123–135.
- [20] D. R. Mason, D. Nguyen-Manh, M.-C. Marinica, R. Alexander, A. E. Sand, S. L. Dudarev, Relaxation volumes of microscopic and mesoscopic irradiation-induced defects in tungsten, Journal of Applied Physics 126 (7) (2019) 075112. doi:10.1063/1.5094852.
- [21] T. Ahlgren, K. Heinola, N. Juslin, A. Kuronen, Bond-order potential for point and extended defect simulations in tungsten, Journal of Applied Physics 107 (3) (2010) 033516. doi:10.1063/1.3298466.
- [22] J. Byggmästar, A. Hamedani, K. Nordlund, F. Djurabekova, Machine-learning interatomic potential for radiation damage and defects in tungsten, Phys. Rev. B 100 (2019) 144105. doi:10.1103/PhysRevB.100.144105.
- [23] K. Nordlund, S. Zinkle, A. Sand, et al., Improving atomic displacement and replacement calculations with physically realistic damage models. (2018). doi:https://doi.org/10.1038/s41467-018-03415-5.
-
[24]
M.-C. Marinica, L. Ventelon, M. R. Gilbert, L. Proville, S. L. Dudarev,
J. Marian, G. Bencteux, F. Willaime,
Interatomic potentials
for modelling radiation defects and dislocations in tungsten, Journal of
Physics: Condensed Matter 25 (39) (2013) 395502.
doi:10.1088/0953-8984/25/39/395502.
URL https://doi.org/10.1088/0953-8984/25/39/395502 -
[25]
L.-F. Wang, X. Shu, G.-H. Lu, F. Gao,
Embedded-atom method
potential for modeling hydrogen and hydrogen-defect interaction in tungsten,
Journal of Physics: Condensed Matter 29 (43) (2017) 435401.
doi:10.1088/1361-648x/aa86bd.
URL https://doi.org/10.1088/1361-648x/aa86bd - [26] S. Goel, G. Cross, A. Stukowski, E. Gamsjäger, B. Beake, A. Agrawal, Designing nanoindentation simulation studies by appropriate indenter choices: Case study on single crystal tungsten, Computational Materials Science 152 (2018) 196–210. doi:https://doi.org/10.1016/j.commatsci.2018.04.044.
-
[27]
P. Grigorev, T. D. Swinburne, J. R. Kermode,
Hybrid
quantum/classical study of hydrogen-decorated screw dislocations in tungsten:
Ultrafast pipe diffusion, core reconstruction, and effects on glide
mechanism, Phys. Rev. Materials 4 (2020) 023601.
doi:10.1103/PhysRevMaterials.4.023601.
URL https://link.aps.org/doi/10.1103/PhysRevMaterials.4.023601 -
[28]
P. Hiremath, S. Melin, E. Bitzek, P. A. Olsson,
Effects
of interatomic potential on fracture behaviour in single- and bicrystalline
tungsten, Computational Materials Science 207 (2022) 111283.
doi:https://doi.org/10.1016/j.commatsci.2022.111283.
URL https://www.sciencedirect.com/science/article/pii/S0927025622000805 - [29] J. Byggmästar, K. Nordlund, F. Djurabekova, Simple machine-learned interatomic potentials for complex alloys, Physical Review Materials 6 (8) (2022) 083801. doi:10.1103/PhysRevMaterials.6.083801.
- [30] R. W. Hertzberg, F. E. Hauser, Deformation and fracture mechanics of engineering materials (1977).
-
[31]
D. R. Mason, D. Nguyen-Manh, C. S. Becquart,
An empirical potential for
simulating vacancy clusters in tungsten, Journal of Physics: Condensed
Matter 29 (50) (2017) 505501.
doi:10.1088/1361-648x/aa9776.
URL https://doi.org/10.1088/1361-648x/aa9776 - [32] G. J. Ackland, R. Thetford, An improved N-body semi-empirical model for body-centred cubic transition metals, Philosophical Magazine A 56 (1) (1987) 15–30. doi:10.1080/01418618708204464.
-
[33]
A. Glielmo, C. Zeni, A. De Vita,
Efficient
nonparametric n -body force fields from machine learning, Physical Review B
97 (18) (May 2018).
doi:10.1103/PhysRevB.97.184307.
URL https://link.aps.org/doi/10.1103/PhysRevB.97.184307 - [34] J. Vandermause, S. B. Torrisi, S. Batzner, Y. Xie, L. Sun, A. M. Kolpak, B. Kozinsky, npj Comput. Mater. 6 (2020) 20.
- [35] J. Byggmästar, K. Nordlund, F. Djurabekova, Modeling refractory high-entropy alloys with efficient machine-learned interatomic potentials: Defects and segregation, Phys. Rev. B 104 (2021) 104101.
- [36] F. Dominguez-Gutierrez, Temperature effects on the point defects formation in [111] w by neutron induced collision cascade, Nuclear Instruments and Methods in Physics Research Section B: Beam Interactions with Materials and Atoms 512 (2022) 38–41.
- [37] C. Barrett, R. Carino, The meam parameter calibration tool: an explicit methodology for hierarchical bridging between ab initio and atomistic scales, Integr Mater Manuf Innov 5 (2016) 177.
-
[38]
L. Vitos, A. Ruban, H. Skriver, J. Kollár,
The
surface energy of metals, Surface Science 411 (1) (1998) 186–202.
doi:https://doi.org/10.1016/S0039-6028(98)00363-X.
URL https://www.sciencedirect.com/science/article/pii/S003960289800363X - [39] A. P. Thompson, H. M. Aktulga, R. Berger, D. S. Bolintineanu, W. M. Brown, P. S. Crozier, P. J. in ’t Veld, A. Kohlmeyer, S. G. Moore, T. D. Nguyen, R. Shan, M. J. Stevens, J. Tranchida, C. Trott, S. J. Plimpton, Lammps - a flexible simulation tool for particle-based materials modeling at the atomic, meso, and continuum scales, Computer Physics Communications 271 (2022) 108171. doi:https://doi.org/10.1016/j.cpc.2021.108171.
-
[40]
F. Dominguez-Gutierrez, S. Papanikolaou, A. Esfandiarpour, P. Sobkowicz,
M. Alava,
Nanoindentation
of single crystalline mo: Atomistic defect nucleation and thermomechanical
stability, Materials Science and Engineering: A 826 (2021) 141912.
doi:https://doi.org/10.1016/j.msea.2021.141912.
URL https://www.sciencedirect.com/science/article/pii/S0921509321011783 - [41] W. Oliver, G. Pharr, An improved technique for determining hardness and elastic modulus using load and displacement sensing indentation experiments, Journal of Materials Research 7 (6) (1992) 1564–1583. doi:10.1557/JMR.1992.1564.
- [42] A. Stukowski, Visualization and analysis of atomistic simulation data with OVITO-the Open Visualization Tool, Modelling and simulation in materials science and engineering 18 (1) (JAN 2010). doi:{10.1088/0965-0393/18/1/015012}.
-
[43]
A. Stukowski, V. V. Bulatov, A. Arsenlis,
Automated identification
and indexing of dislocations in crystal interfaces, Modelling and Simulation
in Materials Science and Engineering 20 (8) (2012) 085007.
doi:10.1088/0965-0393/20/8/085007.
URL https://doi.org/10.1088/0965-0393/20/8/085007 - [44] A. D. Backer, D. Mason, C. Domain, D. Nguyen-Manh, M.-C. Marinica, L. Ventelon, C. Becquart, S. Dudarev, Multiscale modelling of the interaction of hydrogen with interstitial defects and dislocations in BCC tungsten, Nuclear Fusion 58 (1) (2017) 016006.
- [45] J. Byggmästar, F. Granberg, A. E. Sand, A. Pirttikoski, R. Alexander, M.-C. Marinica, K. Nordlund, Collision cascades overlapping with self-interstitial defect clusters in Fe and W, Journal of Physics: Condensed Matter 31 (24) (2019) 245402. doi:10.1088/1361-648X/ab0682.
- [46] L. Ventelon, F. Willaime, Generalized stacking-faults and screw-dislocation core-structure in bcc iron: A comparison between ab initio calculations and empirical potentials, Philosophical Magazine 90 (7-8) (2010) 1063–1074.
-
[47]
T. D. Swinburne, S. L. Dudarev,
Kink-limited
orowan strengthening explains the brittle to ductile transition of irradiated
and unirradiated bcc metals, Phys. Rev. Materials 2 (2018) 073608.
doi:10.1103/PhysRevMaterials.2.073608.
URL https://link.aps.org/doi/10.1103/PhysRevMaterials.2.073608 - [48] A. N. Stroh, Dislocations and cracks in anisotropic elasticity, The Philosophical Magazine: A Journal of Theoretical Experimental and Applied Physics 3 (30) (1958) 625–646.
- [49] B. Wang, Z. Zhang, J. Cui, N. Jiang, J. Lyu, G. Chen, J. Wang, Z. Liu, J. Yu, C. Lin, F. Ye, D. Guo, In situ tem study of interaction between dislocations and a single nanotwin under nanoindentation, ACS Applied Materials & Interfaces 9 (35) (2017) 29451–29456. doi:10.1021/acsami.7b11103.
- [50] D. Wang, N. Gao, Z. Wang, X. Gao, W. He, M. Cui, L. Pang, Y. Zhu, Effect of strain field on displacement cascade in tungsten studied by molecular dynamics simulation, Nuclear Instruments and Methods in Physics Research Section B: Beam Interactions with Materials and Atoms 384 (2016) 68–75.
- [51] F. Gao, D. Bacon, P. Flewitt, T. Lewis, The influence of strain on defect generation by displacement cascades in iron, Nuclear Instruments and Methods in Physics Research Section B: Beam Interactions with Materials and Atoms 180 (1) (2001) 187–193.
- [52] K. Heinola, T. Ahlgren, K. Nordlund, J. Keinonen, Hydrogen interaction with point defects in tungsten, Phys. Rev. B 82 (2010) 094102.
- [53] E. Hodille, S. Markelj, T. Schwarz-Selinger, A. Založnik, M. Pečovnik, M. Kelemen, C. Grisolia, Stabilization of defects by the presence of hydrogen in tungsten: simultaneous w-ion damaging and d-atom exposure, Nuclear Fusion 59 (1) (2018) 016011.
- [54] Y.-N. Liu, T. Ahlgren, L. Bukonte, K. Nordlund, X. Shu, Y. Yu, X.-C. Li, G.-H. Lu, Mechanism of vacancy formation induced by hydrogen in tungsten, AIP Advances 3 (12) (2013) 122111.
-
[55]
K. Nibur, D. Bahr,
Identifying
slip systems around indentations in fcc metals, Scripta Materialia 49 (11)
(2003) 1055–1060.
doi:https://doi.org/10.1016/j.scriptamat.2003.08.021.
URL https://www.sciencedirect.com/science/article/pii/S1359646203005402 - [56] S. Harvey, H. Huang, S. Venkataraman, W. Gerberich, Microscopy and microindentation mechanics of single crystal fe-3 wt. % si: Part i. atomic force microscopy of a small indentation, Journal of Materials Research 8 (6) (1993) 1291–1299. doi:10.1557/JMR.1993.1291.
-
[57]
E. Renner, Y. Gaillard, F. Richard, F. Amiot, P. Delobelle,
Sensitivity of the
residual topography to single crystal plasticity parameters in Berkovich
nanoindentation on FCC nickel, International Journal of Plasticity 77
(2016) 118 – 140.
URL https://hal.archives-ouvertes.fr/hal-01256237 - [58] S. Pathak, J. L. Riesterer, S. R. Kalidindi, J. Michler, Understanding pop-ins in spherical nanoindentation, Applied Physics Letters 105 (16) (2014) 161913. doi:10.1063/1.4898698.
-
[59]
Y. Wang, D. Raabe, C. KlĂĽber, F. Roters,
Orientation
dependence of nanoindentation pile-up patterns and of nanoindentation
microtextures in copper single crystals, Acta Materialia 52 (8) (2004)
2229–2238.
doi:https://doi.org/10.1016/j.actamat.2004.01.016.
URL https://www.sciencedirect.com/science/article/pii/S1359645404000308 -
[60]
Y. Liu, S. Varghese, J. Ma, M. Yoshino, H. Lu, R. Komanduri,
Orientation
effects in nanoindentation of single crystal copper, International Journal
of Plasticity 24 (11) (2008) 1990–2015.
doi:https://doi.org/10.1016/j.ijplas.2008.02.009.
URL https://www.sciencedirect.com/science/article/pii/S0749641908000363 -
[61]
M. M. Biener, J. Biener, A. M. Hodge, A. V. Hamza,
Dislocation
nucleation in bcc ta single crystals studied by nanoindentation, Phys. Rev.
B 76 (2007) 165422.
doi:10.1103/PhysRevB.76.165422.
URL https://link.aps.org/doi/10.1103/PhysRevB.76.165422