The Davis-Chandrasekhar-Fermi Method Revisited
Abstract
Despite the rich observational results on interstellar magnetic fields in star-forming regions, it is still unclear how dynamically significant the magnetic fields are at varying physical scales, because direct measurement of the field strength is observationally difficult. The Davis-Chandrasekhar-Fermi (DCF) method has been the most commonly used method to estimate the magnetic field strength from polarization data. It is based on the assumption that gas turbulent motion is the driving source of field distortion via linear Alfvén waves. In this work, using MHD simulations of star-forming clouds, we test the validity of the assumption underlying the DCF method by examining its accuracy in the real 3D space. Our results suggest that the DCF relation between turbulent kinetic energy and magnetic energy fluctuation should be treated as a statistical result instead of a local property. We then develop and investigate several modifications to the original DCF method using synthetic observations, and propose new recipes to improve the accuracy of DCF-derived magnetic field strength. We further note that the biggest uncertainty in the DCF analysis may come from the linewidth measurement instead of the polarization observation, especially since the line-of-sight gas velocity can be used to estimate the gas volume density, another critical parameter in the DCF method.
keywords:
MHD – polarization – turbulence – stars:formation – ISM:magnetic fields1 Introduction
Magnetic fields have long been recognized to play a critical role in shaping the formation and evolution of molecular clouds and protostellar systems (McKee & Ostriker, 2007), but definitive progress has been slow because the complete three-dimensional structure and strength of the magnetic field within molecular clouds cannot be directly probed observationally. On one hand, the magnetic field strength along the line of sight can be derived via Zeeman splitting of molecular lines, but the measurements are notoriously difficult. Firm Zeeman detections thus remain sparse (see e.g., Falgarone et al. 2008; Troland & Crutcher 2008; Crutcher et al. 2010, or Crutcher 2012 for a review). On the other hand, polarized dust emission is generally thought to be a reliable tracer of the projected magnetic field direction on the plane of sky, because non-spherical grains tend to be oriented with their long axes perpendicular to the magnetic field lines (Davis & Greenstein 1951; also see review by Lazarian 2007). However, though dust polarization patterns have been successfully mapped at multiple scales from diffuse clouds to protostellar disks (e.g., Planck Collaboration XIX, 2015; Hull et al., 2013; Stephens et al., 2014; Fissel et al., 2016; Ward-Thompson et al., 2017), the 3D structure of magnetic field remains unknown.
With the advent of several new instruments in the last several years including Planck (e.g., Planck Collaboration XIX, 2015), BLASTPol (Fissel et al., 2016), JCMT/POL-2 (Ward-Thompson et al., 2017), and SOFIA/HAWC+ (Harper et al., 2018), the observational situation has improved drastically. In particular, it is now possible to generate large number of polarization vectors in multi-scale observations with high-sensitivity polarimeters, which enables statistical examination on cloud polarization features. The statistical approach has proven to provide promising methods in theoretical studies (e.g., Padoan et al., 2001; Falceta-Gonçalves et al., 2008; Soler et al., 2013), and various models have been proposed to statistically approximate the observationally inaccessible properties of the magnetic field (e.g., Chen et al., 2016; Chen et al., 2019; King et al., 2018, 2019; Sullivan et al., 2021).
Despite the recent advances, the Davis-Chandrasekhar-Fermi (DCF) method (Davis, 1951; Chandrasekhar & Fermi, 1953) remains one of the most commonly used methods to estimate the magnetic field strength. The fundamental picture of the DCF method is to consider the propagation of Alfvén waves along the originally-uniform magnetic field. In this scenario, any distortion of the field lines correlates directly to the gas motions (see e.g., Fig. 1). Therefore, by measuring the field distortion (usually traced by the dispersion of polarization angles) and the turbulent strength (traced by linewidth), the field strength can be estimated by assuming 1) energy balance holds between the gas kinetic and magnetic energy fluctuations (i.e., ), and 2) the gas turbulent motion is isotropic in 3D. While this method has been tested with numerical simulations (e.g., Heitsch et al., 2001; Ostriker et al., 2001; Falceta-Gonçalves et al., 2008) and applied to observational data at various scales (e.g., Girart et al., 2006; Pillai et al., 2015; Planck Collaboration XXXV, 2016; Pattle et al., 2017; Kwon et al., 2019), it should be noted that the highly restrictive assumptions of the DCF method about the gas motions and magnetic field geometry severely compromise its accuracy, especially for star-forming regions that are self-gravitating (see e.g., Ostriker et al., 2001).
Several theoretical studies have been conducted towards characterizing the uncertainties of the DCF method, with most of the efforts being focused on investigating the cancellation effect in observed polarization angle dispersion through either the beam convolution (e.g., Zweibel, 1990; Myers & Goodman, 1991) or the integration along the line of sight (e.g., Falceta-Gonçalves et al., 2008; Hildebrand et al., 2009; Houde et al., 2009; Cho & Yoo, 2016; Cho, 2019; Skalidis & Tassis, 2021). However, as we shall argue in this work, the most severe uncertainty in the DCF method when applying to real observations is likely the hydrodynamic properties of the gas, not the polarization measurement. In fact, as pointed out in the recent work by Li et al. (2021), the interstellar MHD waves are likely nonlinear, and there exist many other modes that do not satisfy the Alfvén relation, which is a prerequisite of the DCF method. Several recent theoretical works have also investigated the correlation between turbulent kinetic energy and the perturbed component of magnetic energy using fully 3D simulation data, and suggested that the applicability of the DCF-assumed scenario is limited (see e.g., Skalidis et al., 2021; Beattie et al., 2022). If the DCF equation does not hold in 3D, its application on projected 2D data is questionable, unless proper calibration can be provided to increase the accuracy.
In this paper, we revisit the fundamental picture behind the DCF method using fully-3D MHD simulations (Sec. 2), and investigate the applicability of the simplified DCF scenario toward star-forming gas in 2D synthetic observations (Sec. 3). We first examine the balance between turbulent kinetic energy and the perturbed component of the magnetic energy in the 3D space using MHD simulations, which was assumed to be in equipartition in the DCF scenario. We then use the linear Alfvén wave relation (the foundation of the DCF method) to derive the “unperturbed” field for the simulated cloud in 3D (Sec. 2.2), which is a pure mathematical result assuming the DCF equation holds everywhere. We also discuss why the mean field could be considered as the background, “unperturbed” field when conducting the DCF analysis (Sec. 2.3-2.4). In Sec. 3 we discuss possible corrections and modifications for the DCF method when applying on 2D, projected observational data, which we test and compare in Sec. 4. In Sec. 5 we propose a new method to estimate the correction factor for the DCF equation from the cancellation effect on polarization angles along the line of sight. We summarize our conclusions in Sec. 6.
2 The 3D DCF Relation
| model | plasma | |||
|---|---|---|---|---|
| (G) | (km s-1) | |||
| L1 | 74 | 0.15 | 0.76 | 12 |
| L5 | 13 | 0.14 | 0.99 | 20 |
| L10 | 12 | 0.05 | 1.87 | 19 |
| L20 | 20 | 0.03 | 2.15 | 25 |
In this section, we describe our investigation toward the DCF correlation, and demonstrate our analysis using 3D MHD simulations. We used the set of simulations reported in Chen et al. (2019), which are cloud-scale, core-forming 3D MHD simulations.111Note that model L1 represents a slightly different scenario than other models. This particular simulation was designed to follow a local shock-compressed region (1 pc in size) within a molecular cloud, and thus the initial gas density is higher (1000 cm-3) and has relatively strong magnetic field (G) comparing to typical cloud-scale properties ( cm-3 and G). Since the focus of this study is to test the DCF method under various circumstances, we include model L1 with other models in our analysis, though we note that L1 is a relatively extreme case for cloud-scale gas and magnetic field structures. The core formation activities in these clouds are induced by turbulent convergent flows, which compresses the originally diffuse gas ( cm-3) to create dense, post-shock regions within which dense structures and cores form (for more detailed information, see Chen & Ostriker, 2014, 2015; Chen et al., 2016). For our analysis in this study, we only consider the post-shock regions in the simulations because they resemble better the physical properties of the observed star-forming molecular clouds. A summary of the basic cloud properties of these models is in Table 1. Generally speaking, models L1 and L20 represent the cases with relatively the strongest magnetic field and turbulence, respectively, and models L5 and L10 represent the moderately magnetized cases, with model L10 being more turbulent than L5 (see e.g., the values of plasma and the rms velocity in Table 1).
2.1 The Original DCF Method

Based on the assumption that the fluctuation of gas kinetic energy is equal to the fluctuation of magnetic energy, , the original DCF method envisioned the interplay between gas turbulence and magnetic field as a transverse Alfvén wave propagating through a background magnetic field . The gas velocity thus induces small deviation of the magnetic field, , from the initial, unperturbed field . Since we restrict our analysis to Alfvénic fluctuations, only the perpendicular component of the gas velocity with respect to the initial field is effective here, and the perturbed component of the magnetic field is perpendicular to (, ; see the left panel of Fig. 1). This suggests the relation between the gas velocity and the perturbed magnetic field should follow
| (1) |
The perturbed magnetic field and gas velocity thus satisfy
| (2) |
where is the Alfvén velocity in the pre-perturbation medium. This implies, if there is a well-defined, small amplitude Alfvén wave running along the “initial” field, , it is possible to derive the magnitude of using the DCF equation:
| (3) |
where , , and can be estimated from observations (see Sec. 3). Note that there is no prerequisite (e.g., must be constant) on to satisfy Eq. (2), and thus we shall not simply treat it as the average field over the interested region before further justifications (see Sec. 2.3).
2.2 The Initial Magnetic Field in the DCF Method
If the assumption of small-amplitude Alfvén wave is valid, Eqs. (1)-(3) should hold everywhere in the medium . This allows an inference of the unperturbed background field direction in each location when and vectors are known. As illustrated in Fig. 1, in the plane made by and vectors, let be the angle between and vectors and the angle between and (all angles are positive), we have either (note that cannot be in between and )
| (4) |
for case 1 ( on side), or
| (5) |
for case 2 ( on side). Note that here we require , which is a requirement for the DCF method to be applicable. This is because, for the DCF method to work accurately, there must exist such as the original, pre-perturbation field. Since the perturbed field is the combination of and the perturbed component from gas turbulence, and since only the velocity component perpendicular to could bend the field line, we have with , and the angle between and must be less than .
We would like to point out that, case 1 represents the “traditional” view of the DCF relation that when the deviation of from is not large, or in general, when the gas turbulence is sub-Alfvénic. On the other hand, case 2 is also physically correct with , which represents the situation when the gas turbulence is much more energetic comparing to the initial magnetic energy (i.e., super-Alfvénic).222Because in case 2, . Thus, locations that satisfy the scenario of case 2 are locally super-Alfvénic. Similarly, case 1 represents sub-Alfvénic locations. Another criterion for case 2 to be valid is , which is a numerical requirement but also provide the natural limit that must be smaller than in this scenario.
We can now solve following the derivations below:
| (6) | |||
| (7) | |||
| (8) | |||
| (9) |
This gives (and thus the direction of ) at every location. Note that the derived formula of is the same for both cases. Since , , and must be on the same plane, we can therefore solve for and :
| (10) |
When applying on simulation data, we adopt case 1 as the default solution, and we only use the solution from case 2 when
| (11) |
By defining as the vector in the same plane of , , and and is perpendicular to (see Fig. 1), we have
| (12) |
and we can derive the direction of (denoted as the unit vector ):
| (13) |
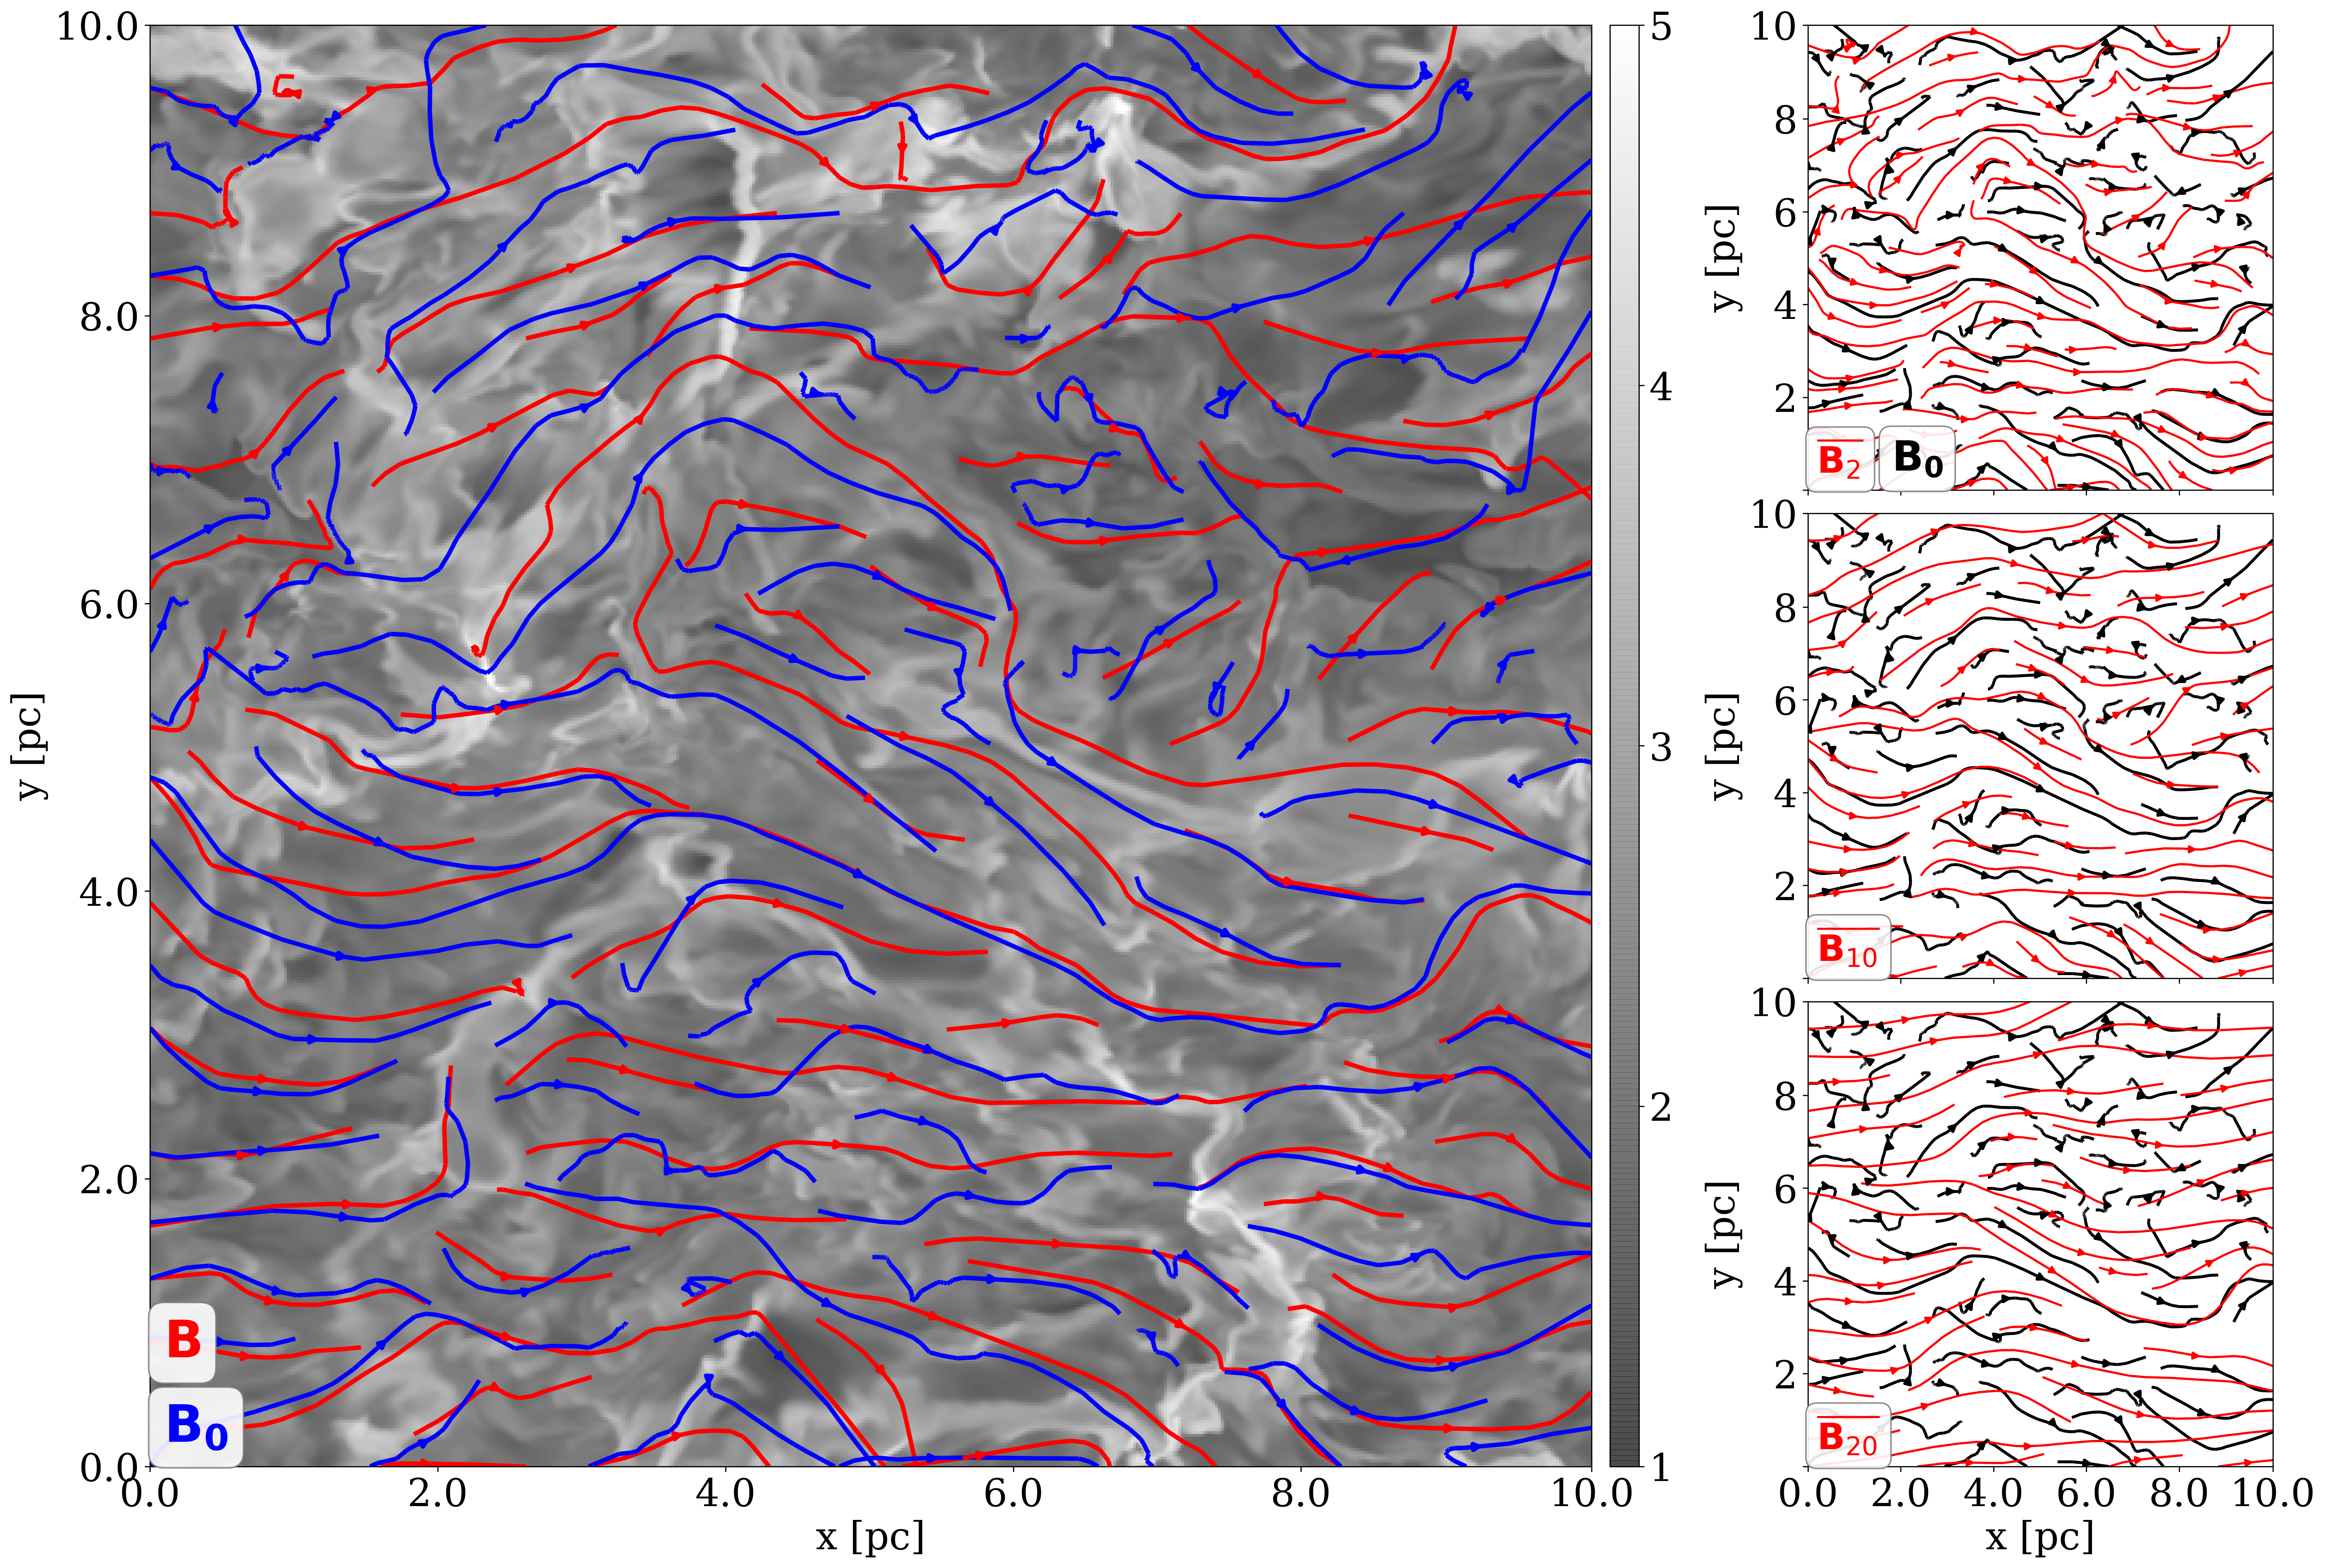
Since and , we know the amplitude of should be . However, we note that only the direction of is important here, because that is what we need to derive for the DCF analysis. Fig. 2 illustrates an example of the derived from a cloud-scale, core-forming simulation (model L10 in Chen et al., 2019). Also note that, as long as we can determine properly, the DCF relation is applicable everywhere even in super-Alfvénic gas, in contrast to the commonly-considered assumption that the DCF relation only holds in sub-Alfvénic regime, which have in fact been challenged by recent numerical studies (see e.g., Liu et al., 2021; Skalidis et al., 2021; Beattie et al., 2022).
2.3 Approximation of
As demonstrated in the previous section, the accuracy of the DCF method depends on the accuracy of the measurement of the direction . However, the full derivation of requires knowing the angle between and , which cannot be probed in observations. Since theoretically represents the “unperturbed” field, a straightforward alternative is to consider the vector-average of over a given scale as an approximation of :
| (14) |
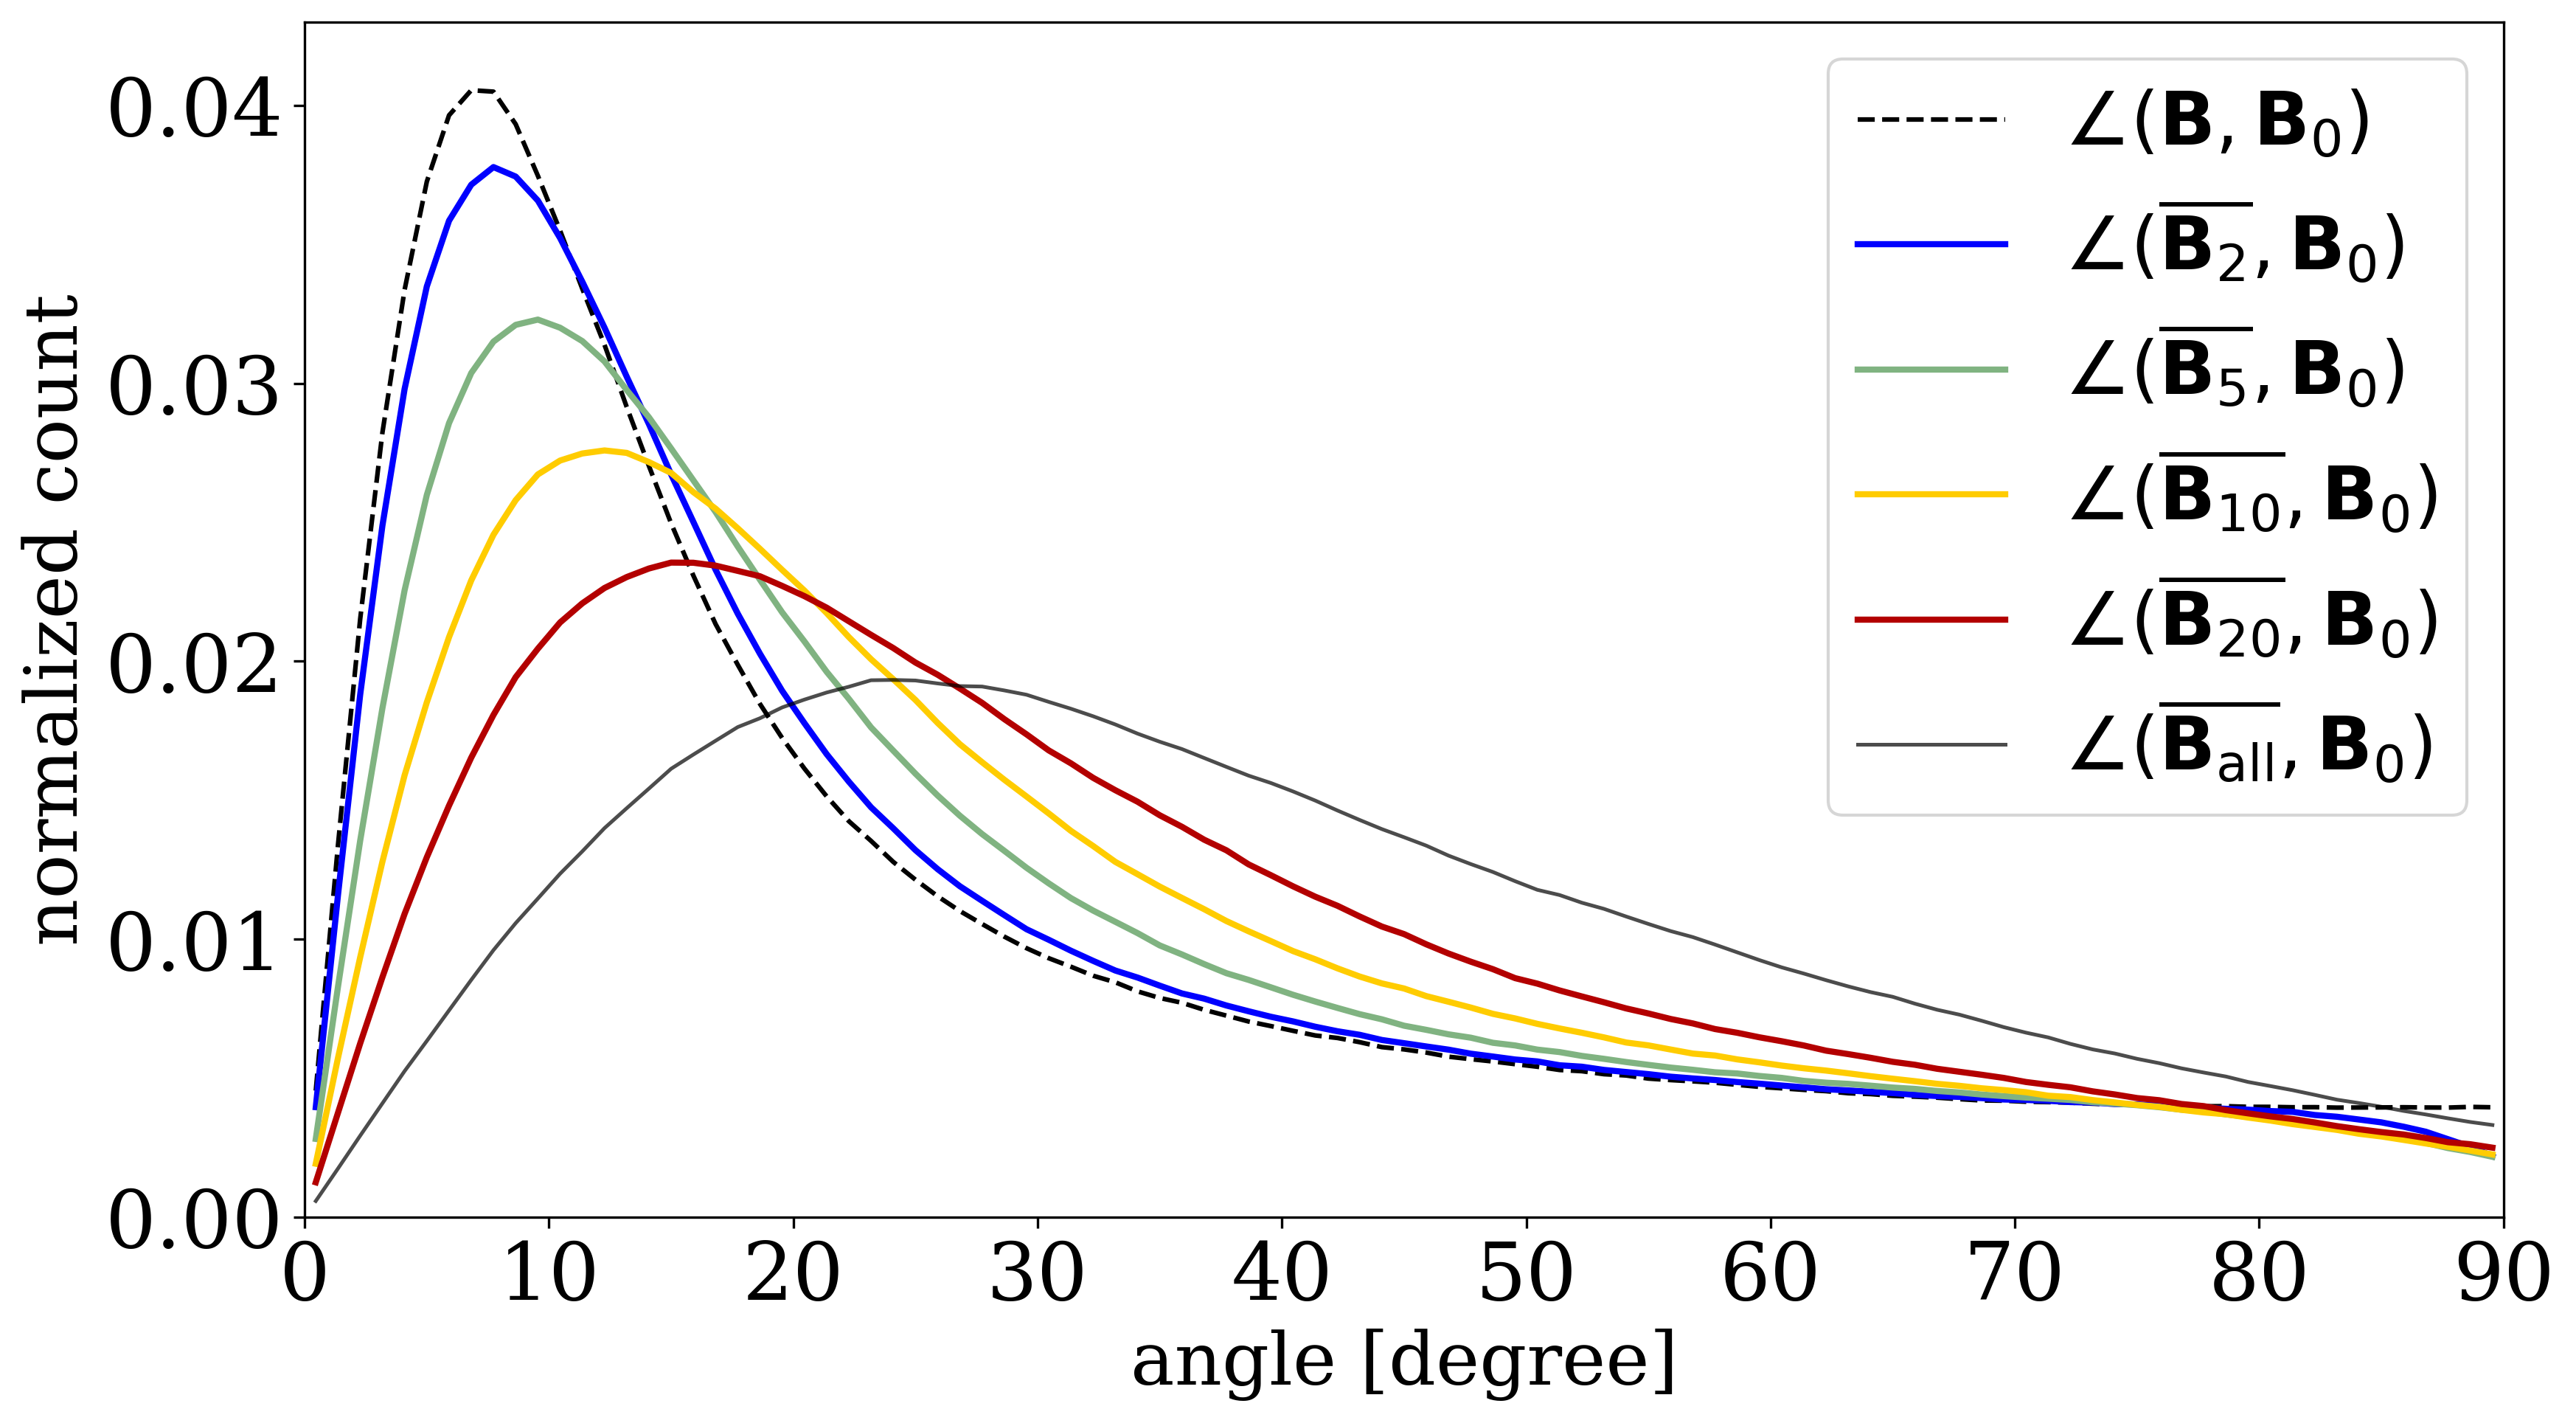
where , , represent averaged , , and over the chosen scale, denoted as . Using the same simulation shown in Fig. 2 (model L10 in Chen et al. (2019)), we consider the averaging scale to be simulation cells ( pc for this model), i.e., we calculate following Eq. (14) by averaging over a volume centered at each cell.
To see how depends on scales and whether we can use to approximate , we calculate the angle difference between and utilizing the full 3D information of the simulation data. The cases of are shown in Fig. 3 (left panel). Also included are the comparisons between the local field (i.e., ) and the “unperturbed” field as well as the total vector-averaged field among the entire simulation domain ( cells or pc3; see Fig. 2). Our results show that, statistically, the angle difference is smaller when the averaged field is derived within a smaller volume, which implies that the direction of could only be a good approximation of locally (i.e., for small ).
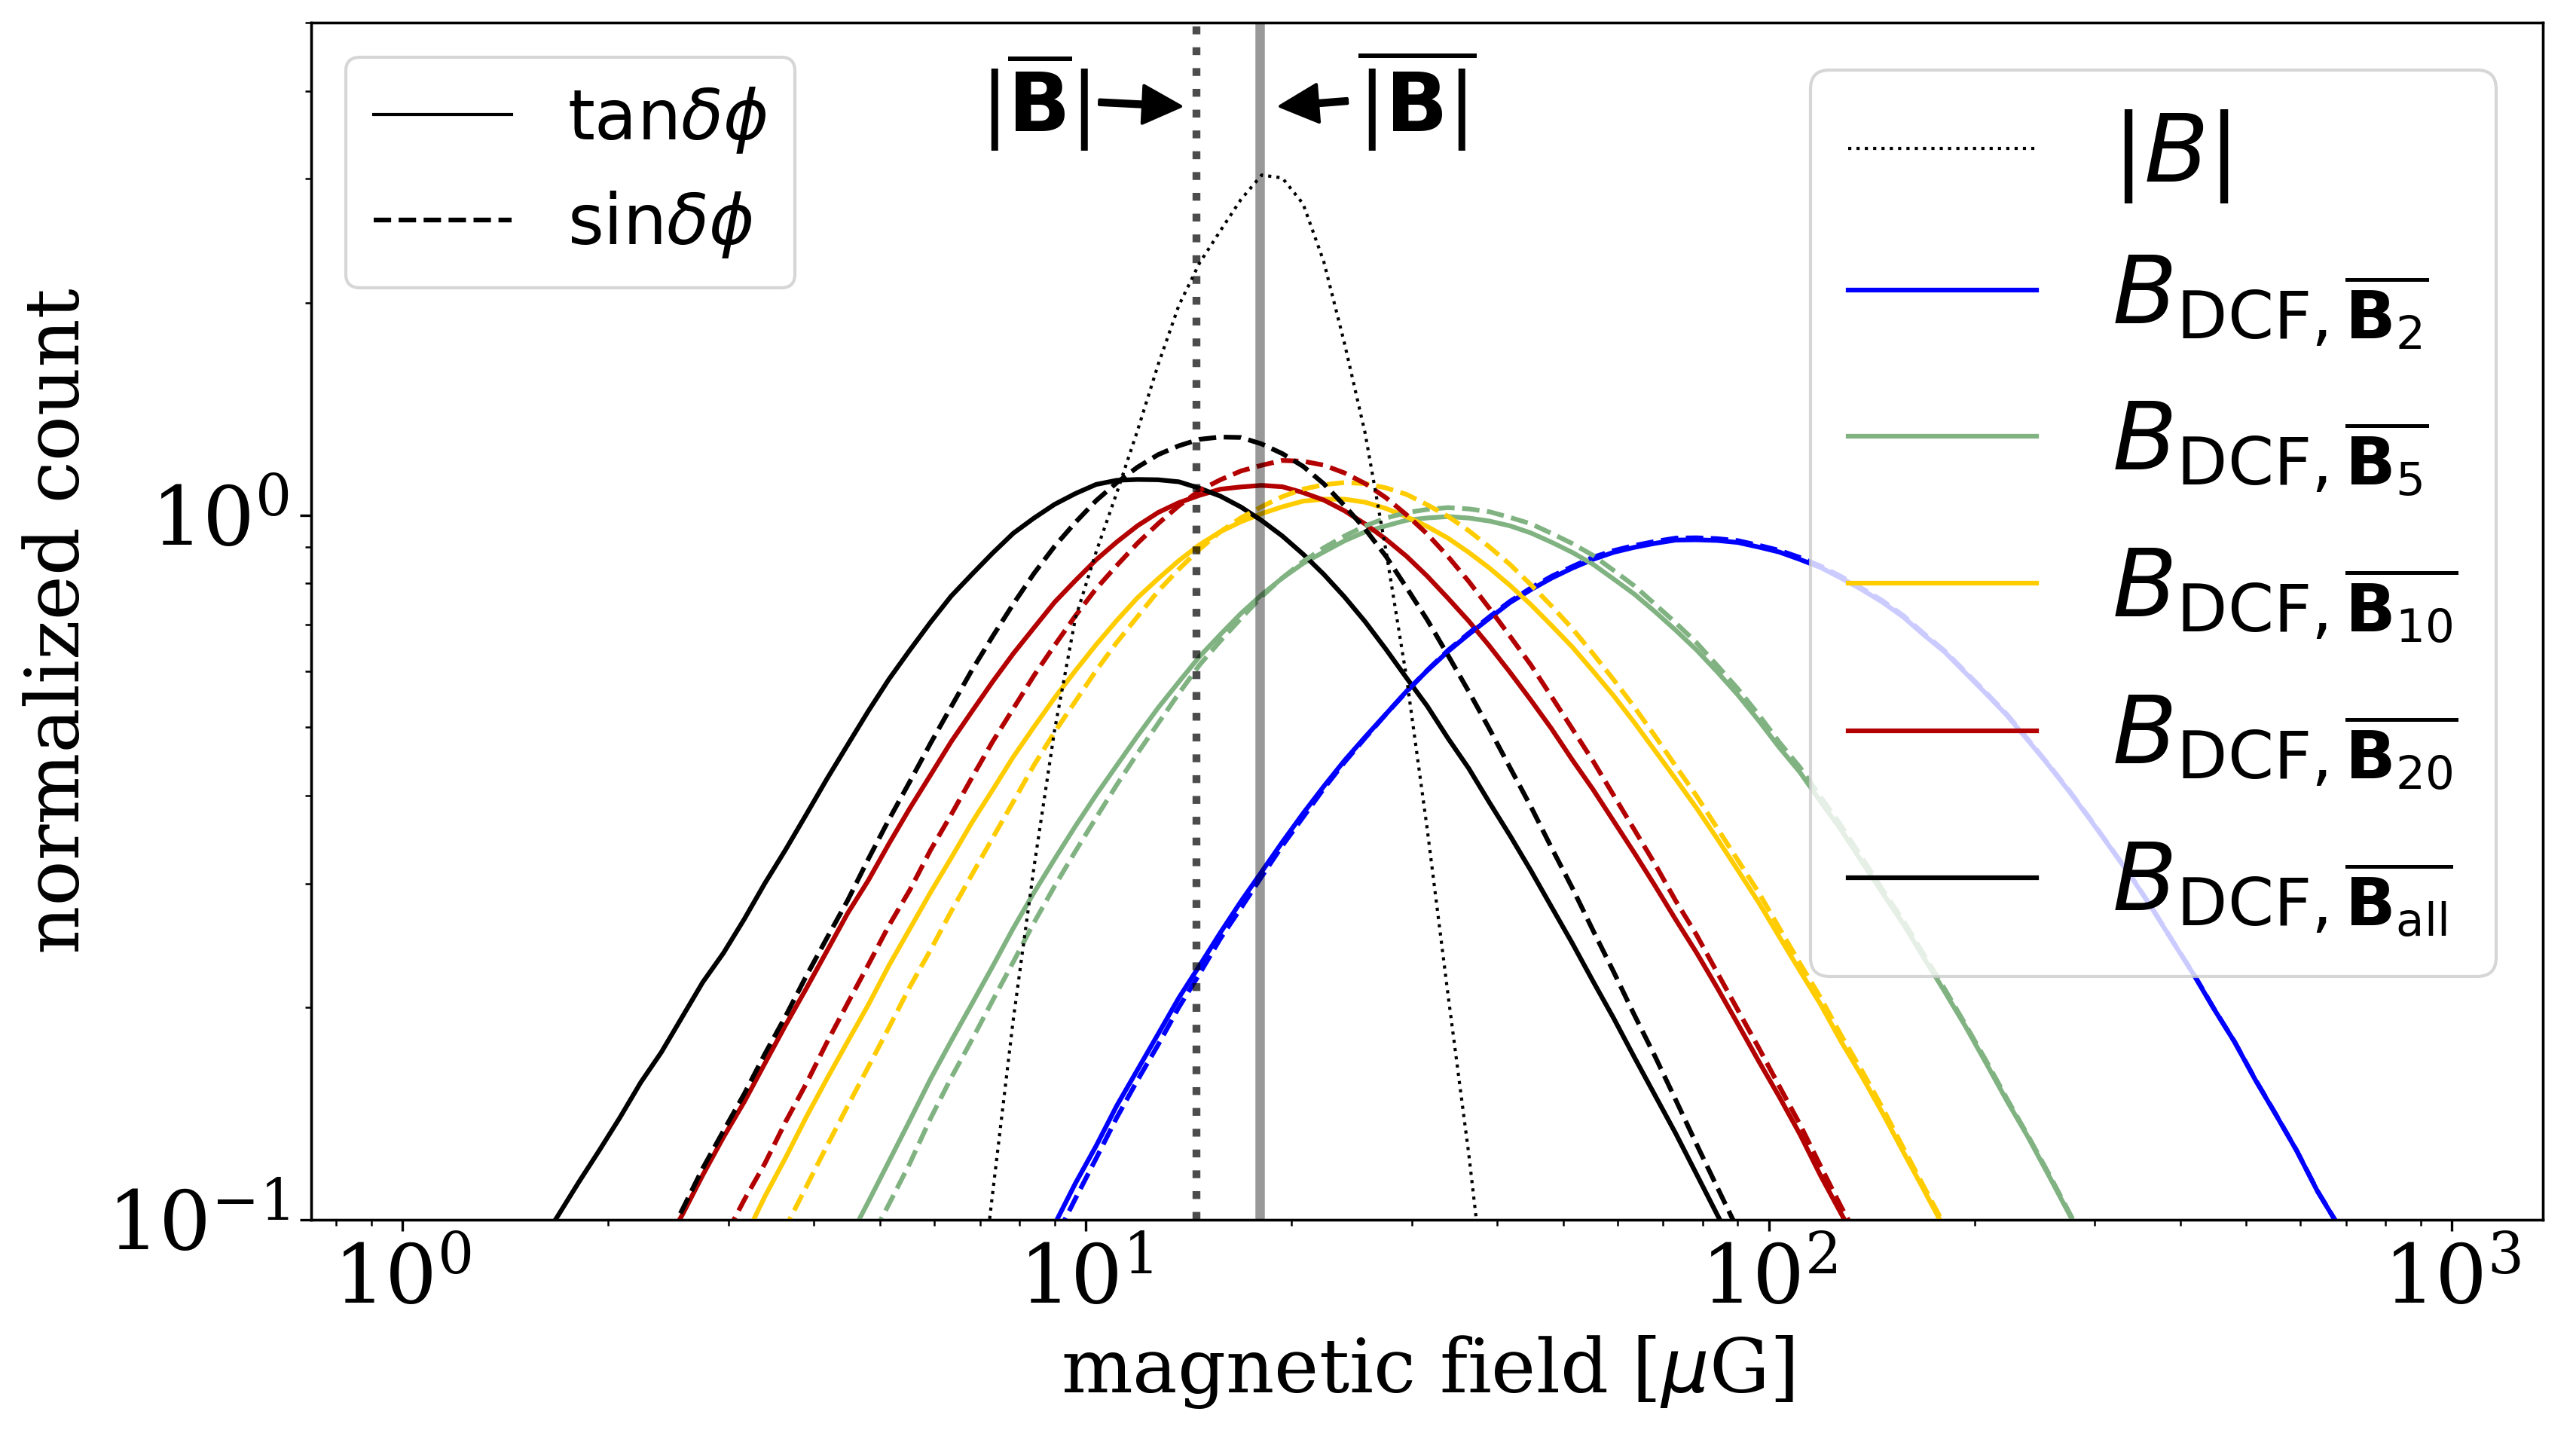
We further use the derived to calculate and , and use those values to calculate the DCF-derived magnetic field strength, , following Eq. (3):
| (15) |
The results are plotted in Fig. 3 (right panel). Interestingly, when looking at the probability distribution of the DCF-derived field strength using the direction of as , it is the large-scale average , or the whole-box average , that has its most probably value around the actual mean field value.333Note that there are two ways to define the mean field strength: the absolute value of the vector-averaged field , or the scalar-average of the magnitude of the field . Both are indicated in the right panel of Fig. 3 (vertical lines in the plot). In contrast, the DCF method tends to overestimate the field strength when the reference field is averaged locally (small for ). This is not surprising, because the locally-averaged magnetic field is more tightly correlated with the local field direction (see Fig. 3, left panel), which means the dispersion angle tends to be small, and thus the derived tends to be large.
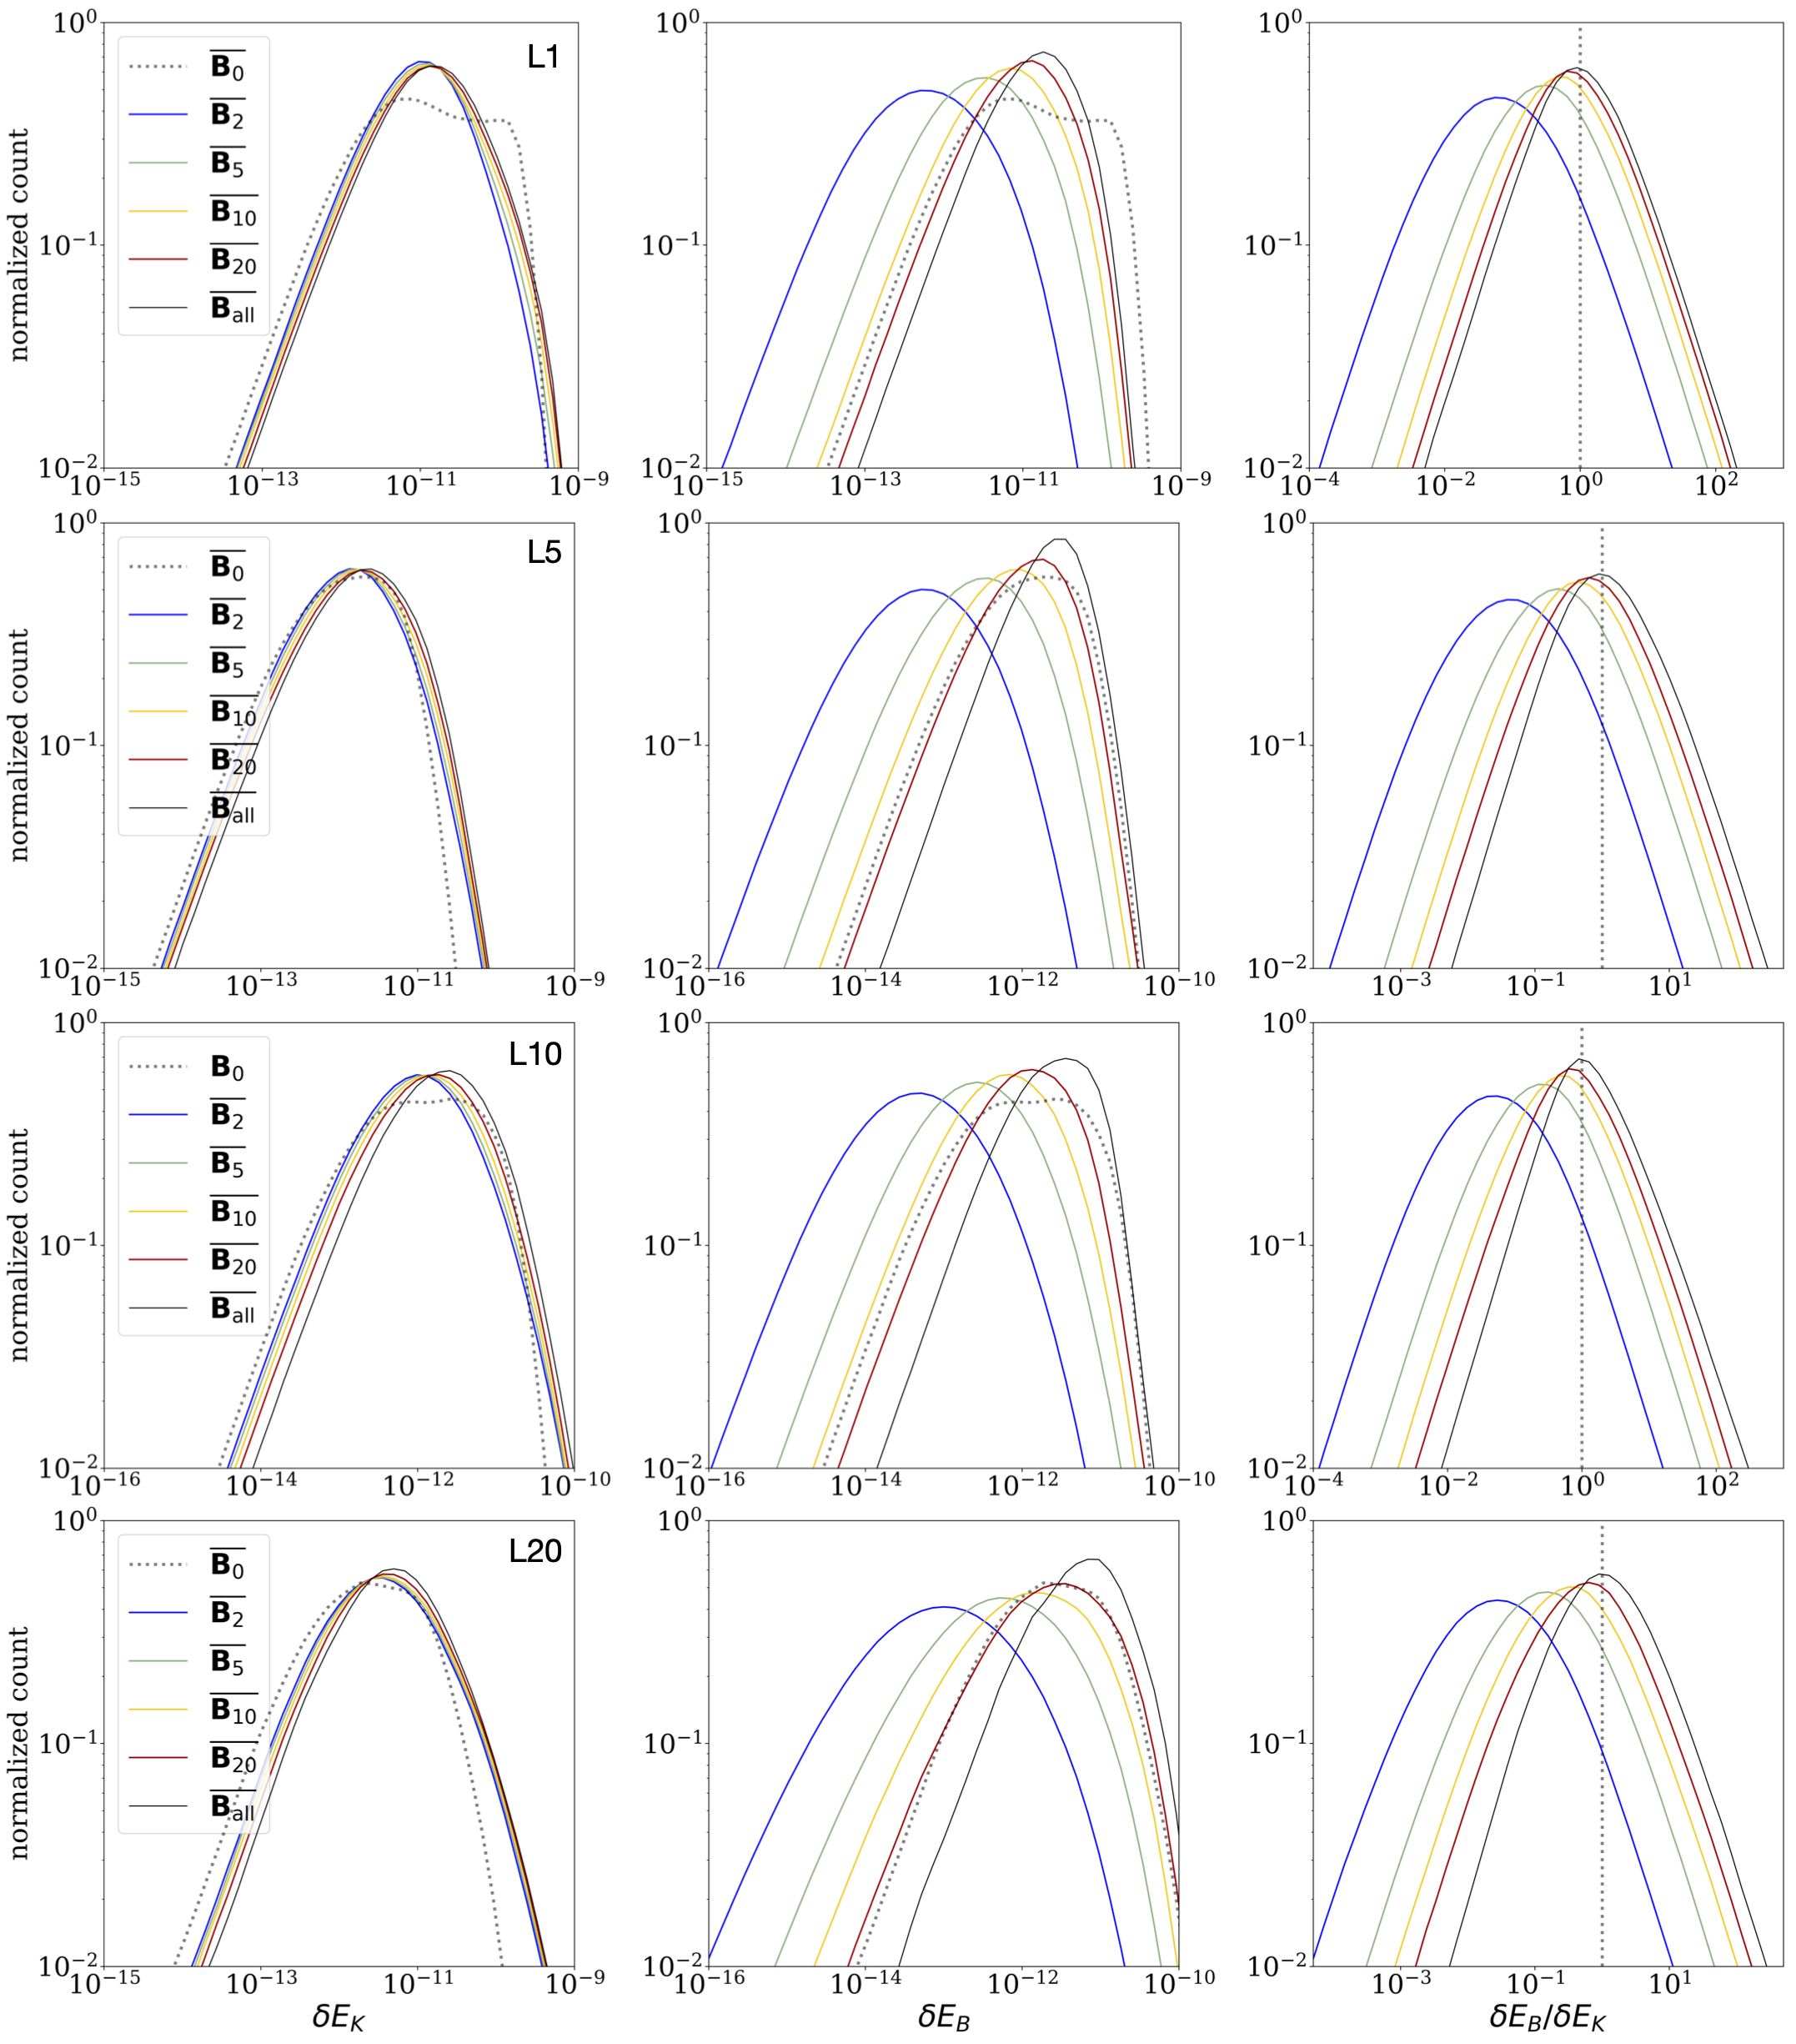
The right panel of Fig. 3 suggests that the vector-averaged field direction over a large scale could be adopted as the “unperturbed” field direction in the DCF equation to provide a good estimate of the mean field strength within the selected region, even though the direction of such averaged field may not agree with everywhere (see the right column of Fig. 2). We note that this can be explained by the distribution of and with respect to the averaged magnetic field direction, which is analogous to the original DCF assumption Eq. (1). Note that the turbulent kinetic energy considered here is the total kinetic energy from the perpendicular component of the gas velocity with respect to various reference magnetic field direction ( and ) within the cloud. As shown in Fig. 4, while the distribution of does not vary much when the referencing direction changes, the distribution of shifted towards larger values when the referencing field direction is derived over larger scales. This is expected, because as we mentioned above, locally-averaged field direction tends to give smaller , and thus is smaller. When we use the entire simulation domain to calculate the reference field direction , the corresponding peaks around 1, consistent with the prerequisite of the DCF method (Eq. (1)), thus provide the most accurate estimate of the field strength in Fig. 3).
We further note that this property of equipartition between the most probable values of and holds in sub-regions as well, and even around dense cores. Fig. 5 illustrates a series of the same analysis (using as the reference field direction) applied on regions of different scales centered at the same dense core. While we clearly see the shape of the distribution becomes more log-normal when including more background clouds around the dense core (from top to bottom rows of Fig. 5), the distribution from the smallest scale that we tested (top row) still peaks very close to 1, which suggests the DCF analysis we performed in Fig. 3 may still be a good approximation even in the immediate surrounding of a dense core.


We would like to point out that the equipartition in and shown in Figs. 4 and 5 could be due to that this simulated cloud, being on the shock front of the collision of two diffuse clumps, is in principle trans-Alfvénic. While this implies that such equipartition may not be a general property for all simulations, it is very possible that in reality, all star-forming regions are indeed trans-Alfvénic, and thus the DCF method could still provide a good approximation of the field strength measurement. This also explains why this equipartition tends to break when only including the immediate surrounding of a dense core, because the gas flows around a dense core are likely affected by the core’s self-gravity, so the assumption of pure MHD turbulence no longer holds.
2.4 The Statistical DCF Method
The DCF method is based on the assumption of the equipartition between the perturbed components of gas velocity and magnetic field, i.e., . As discussed in the previous section, one can use the vector-averaged field as the reference field and achieve the equipartition statistically in log space, i.e., , where we use to represent averaged value in log space. Therefore, the DCF equation should be re-written from Eq. (3) as the following:
| (16) |
Note that we propose here a slightly different process of applying the DCF method. Instead of calculating
| (17) |
(see Sec. 3.1 for more discussions on the DCF equation in 2D), the log-normal shape of shown in Fig. 4 suggests that one should calculate the DCF-derived magnetic field strength at each location using local values of density, velocity, and as
| (18) |
then use as the cloud-scale magnetic field strength.444Note that, in principle, there can be locations where , i.e., . In this case, . These data points should be removed before deriving the averaged value of the magnetic field. Namely, while the DCF method cannot be applied locally at individual cells unless is known, we can take the vector-average of the magnetic field over a large-enough scale to approximate the unperturbed field direction, and use this direction to calculate , , and at each cell. The averaged value of the distribution function of this in log space can then be adopted as the estimated field strength of the system. Note that, by comparing Eq. (16) with Eq. (3), in Eq. (16) we are calculating to approximate , the vector-averaged field strength. However, the cloud-scale mean field strength should be , and obviously . As a result, using as the denominator in Eq. (16) tends to underestimate the field strength.
We further note that, a commonly adopted convention in previous 2D works (e.g., Falceta-Gonçalves et al., 2008) is to consider
| (19) |
where . However, the correct relation should be where is the component of the local magnetic field parallel to , and . This suggests that by adopting in the DCF equation to replace would introduce additional errors. A better way is to consider , i.e., using the local ratio between the perturbed (the component perpendicular to the mean field) and the total magnetic field to replace in Eq. (16). Note that similar concept has been pointed out in Liu et al. (2021). Though could have large variation within the interested region, since we are only considering the peak value in log space and since , Eq. (16) gives . Note that it does not matter if the derived is locally correct or not, as we discussed above. The right panel of Fig. 3 compares the derived values using (solid lines) and (dashed lines). The difference is small for locally-averaged field (small ) due to smaller , but for derived from whole-box averaged field, switching to clearly shift the peak closer to the true value. As we will show in the next section, in projected 2D maps and also have tighter correlation than vs. (see Fig. 7).
3 The DCF Method in 2D: Complications and Modifications
Now that we have validated the DCF relation in 3D space, we extend our investigation of the DCF method to 2D projected systems, i.e., astronomical observations. We note that some extra assumptions are needed to apply the DCF method in observations due to the limited observables. Here, we discuss various ways to improve and/or validate these assumptions before applying the DCF method to synthetic observations from our numerical simulations in the next section.
3.1 Synthetic Polarization
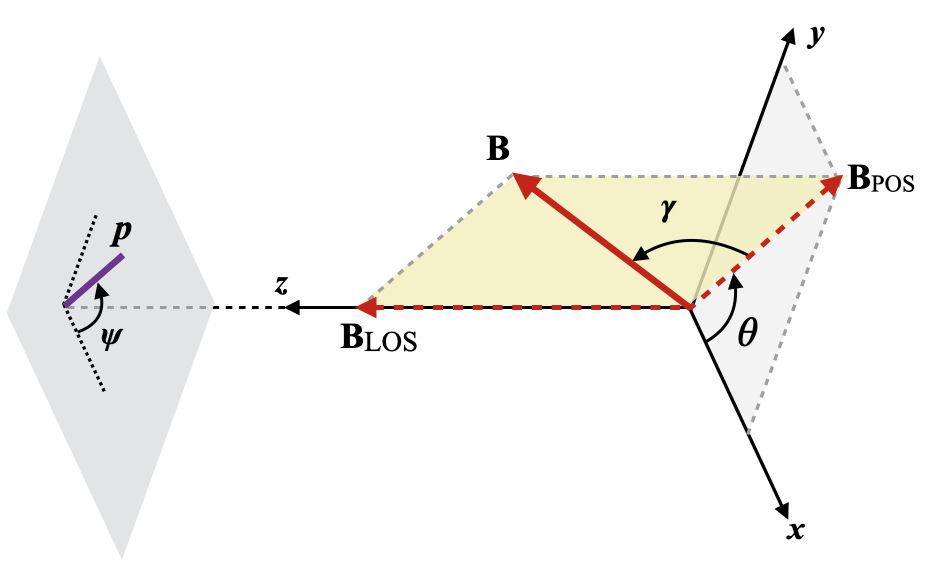
We derived the synthetic polarization as the follows (see e.g., Lee & Draine, 1985; Wardle & Konigl, 1990; Fiege & Pudritz, 2000; Planck Collaboration XIX, 2015; King et al., 2018):
| (20) | ||||
with being the density of the medium (see Fig. 6 for definition of angles). Note that here we use for the position angle of the plane-of-sky component of the magnetic field () instead of the commonly-adopted to avoid confusion with , which measures the angle between and . For simplicity, we assumed homogeneous grain alignment and set the polarization coefficient to be a constant, (see e.g., Chen et al., 2016; Chen et al., 2019). However, we note that non-constant grain alignment efficiency may have effects on the polarization structure, as discussed in e.g., King et al. (2019).
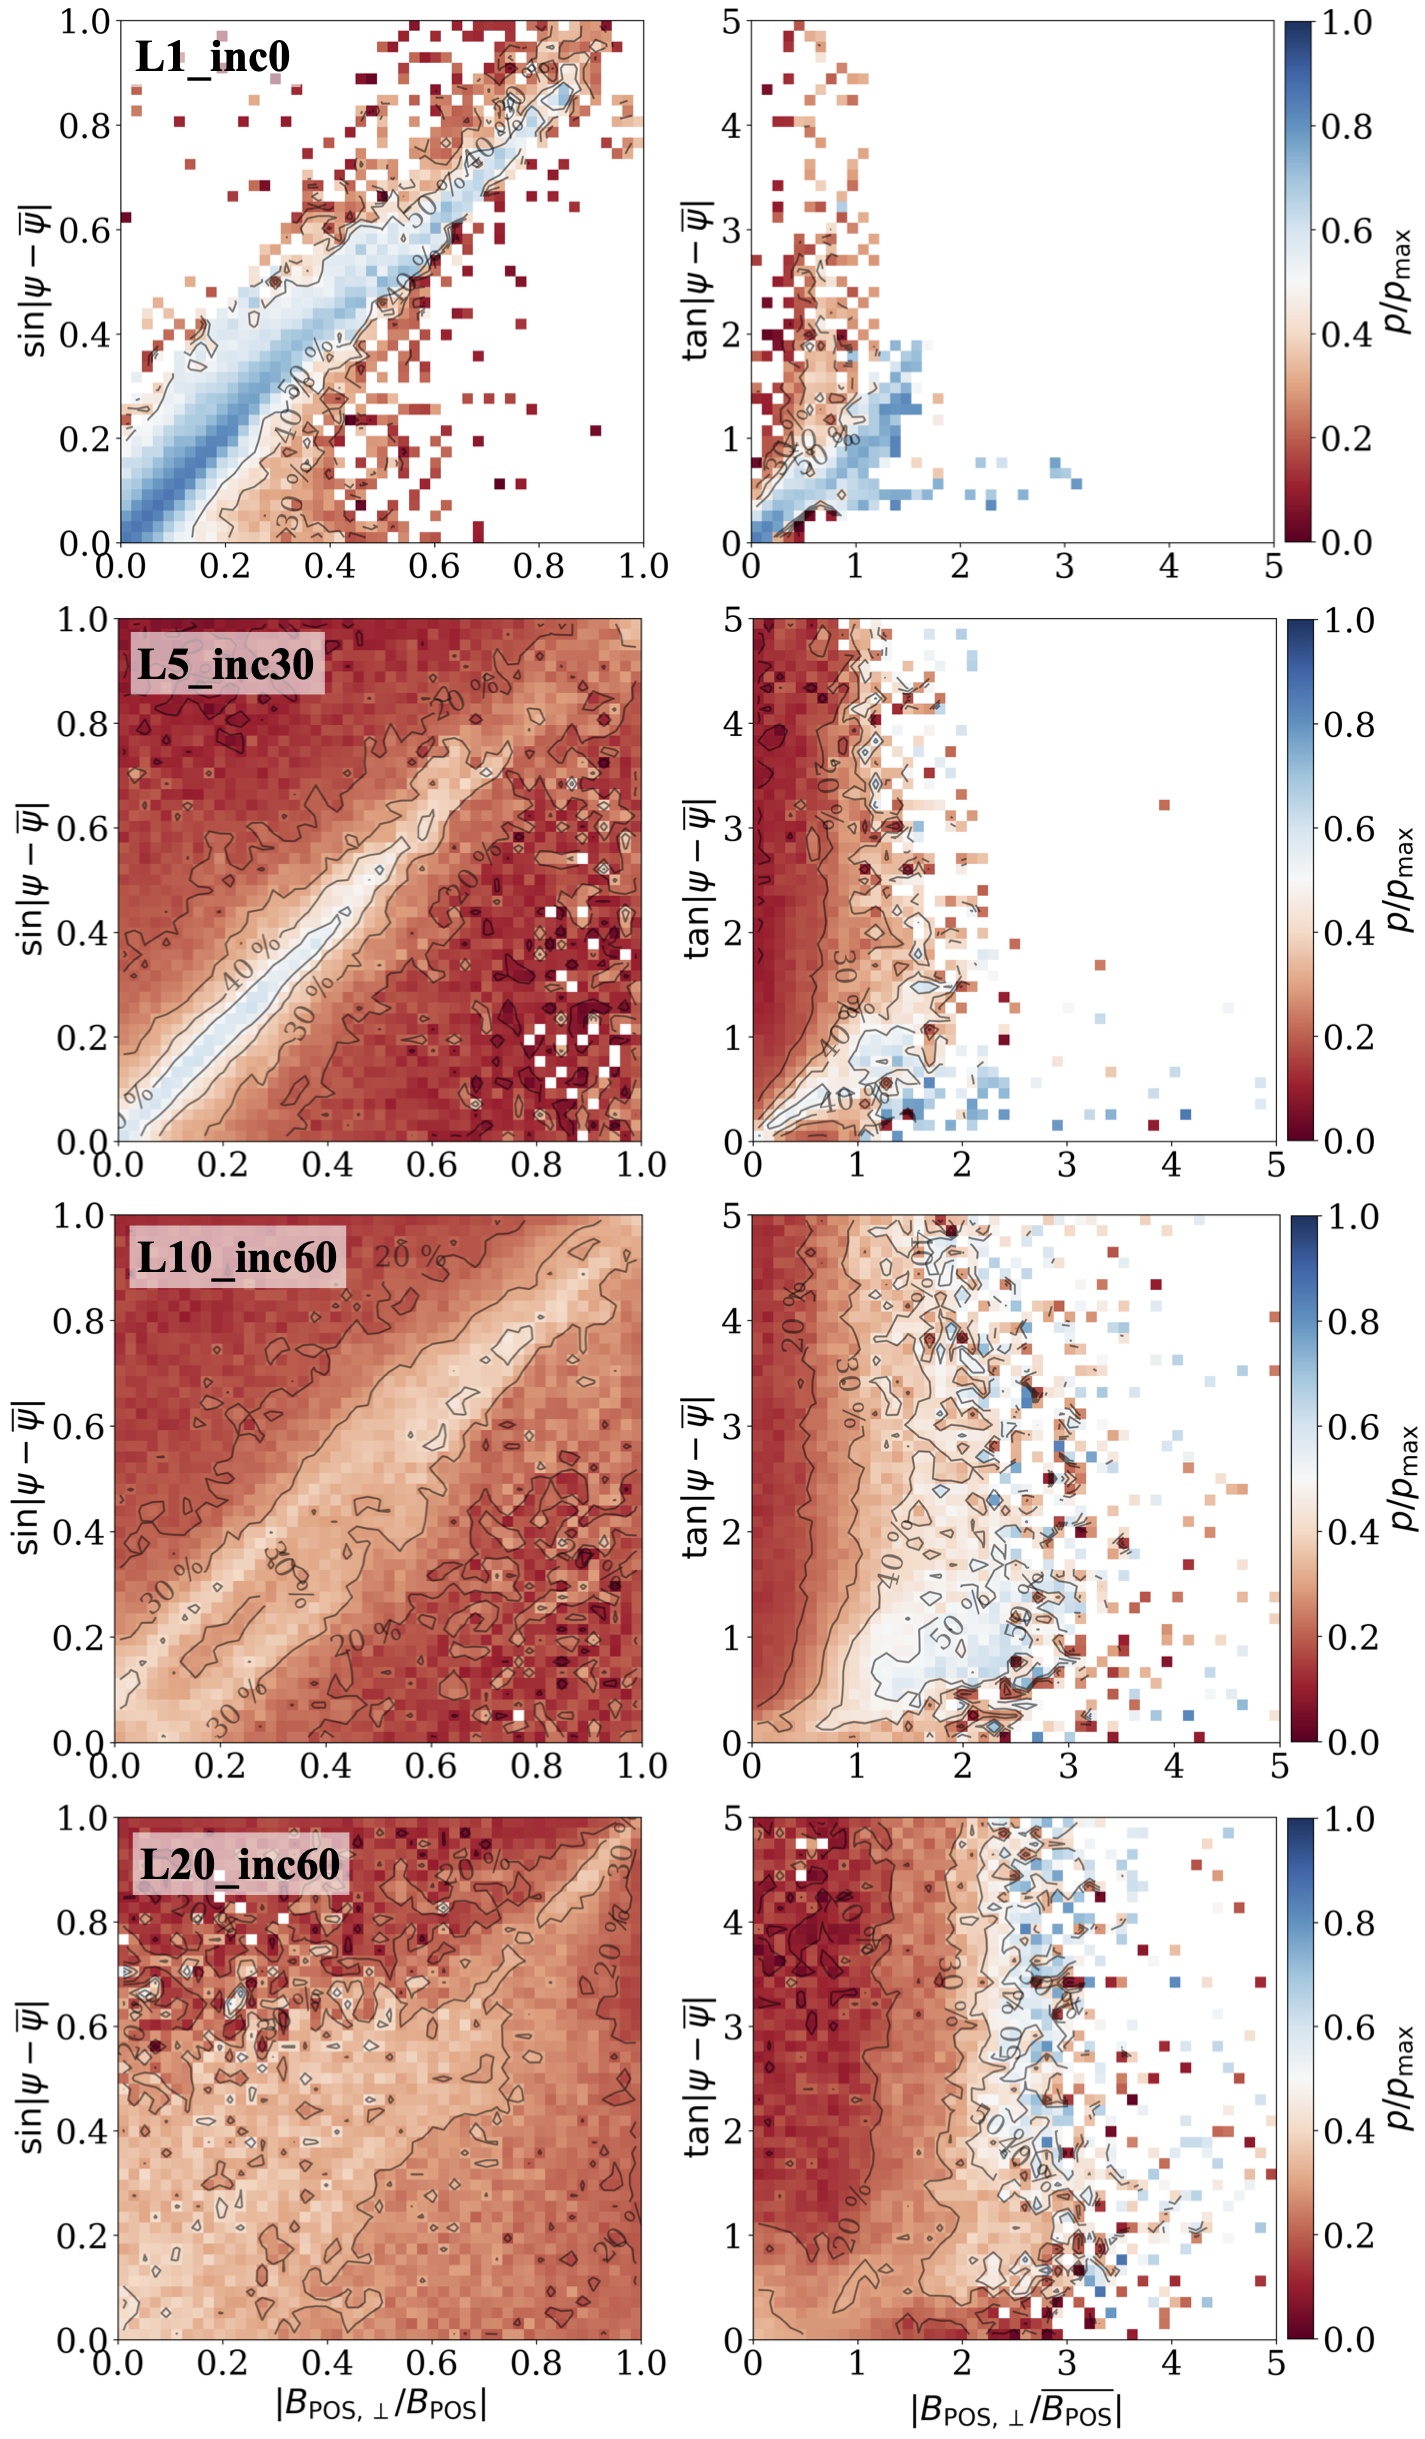
In addition to assuming isotropic turbulence so that where is the observed line-of-sight velocity dispersion, to connect the 3D DCF relation to 2D projected quantities on the plane of sky (POS), we need to assume
| (21) |
where is the angle between and the averaged angle :
| (22) |
With these assumptions, Eq. (3) becomes
| (23) |
Note that there have been several versions of the 2D DCF equation in the past, depending on the interpretation of the magnetic field distortion term . Ostriker et al. (2001) considered , with being the dispersion of observed polarization angle. Heitsch et al. (2001) used , which could be severely contaminated by large angles. First proposed by Falceta-Gonçalves et al. (2008) and recently justified by Li et al. (2021), the now commonly adopted version of the DCF equation in 2D is
| (24) |
The accuracy of Eq. (24) depends on how accurate Eq. (21) is. The first part of Eq. (21) ( to ) depends on the projection effect of the system, which we will discuss shortly in Sec. 3.2. Regarding the second part of Eq. (21) ( to polarization angle), a direct comparison between and , as well as and , is shown in Fig. 7 using several synthetic observations (see Table 2). As we discussed in Sec. 2.4, correlates much better with compared with the correlation between and . This strengthen our argument in Sec. 2.4 that one should consider using in the DCF equation. Fig. 7 also suggests that, in non-extreme conditions (moderate viewing angle with respect to the magnetic field, moderate turbulence, etc.), the polarization orientation follows the actual POS magnetic field structures pretty well when the polarization fraction is high enough, say, , where is the maximum polarization fraction measured from the synthetic polarization map. Since the orientation of polarization segments with polarization fraction below have relatively low correlation with the actual magnetic field direction, we shall neglect those polarization segments when applying the DCF method to the observations. We discuss this in more details in Sec. 4.2 below.
3.2 Angle Correction: 2D Projection of 3D Angle
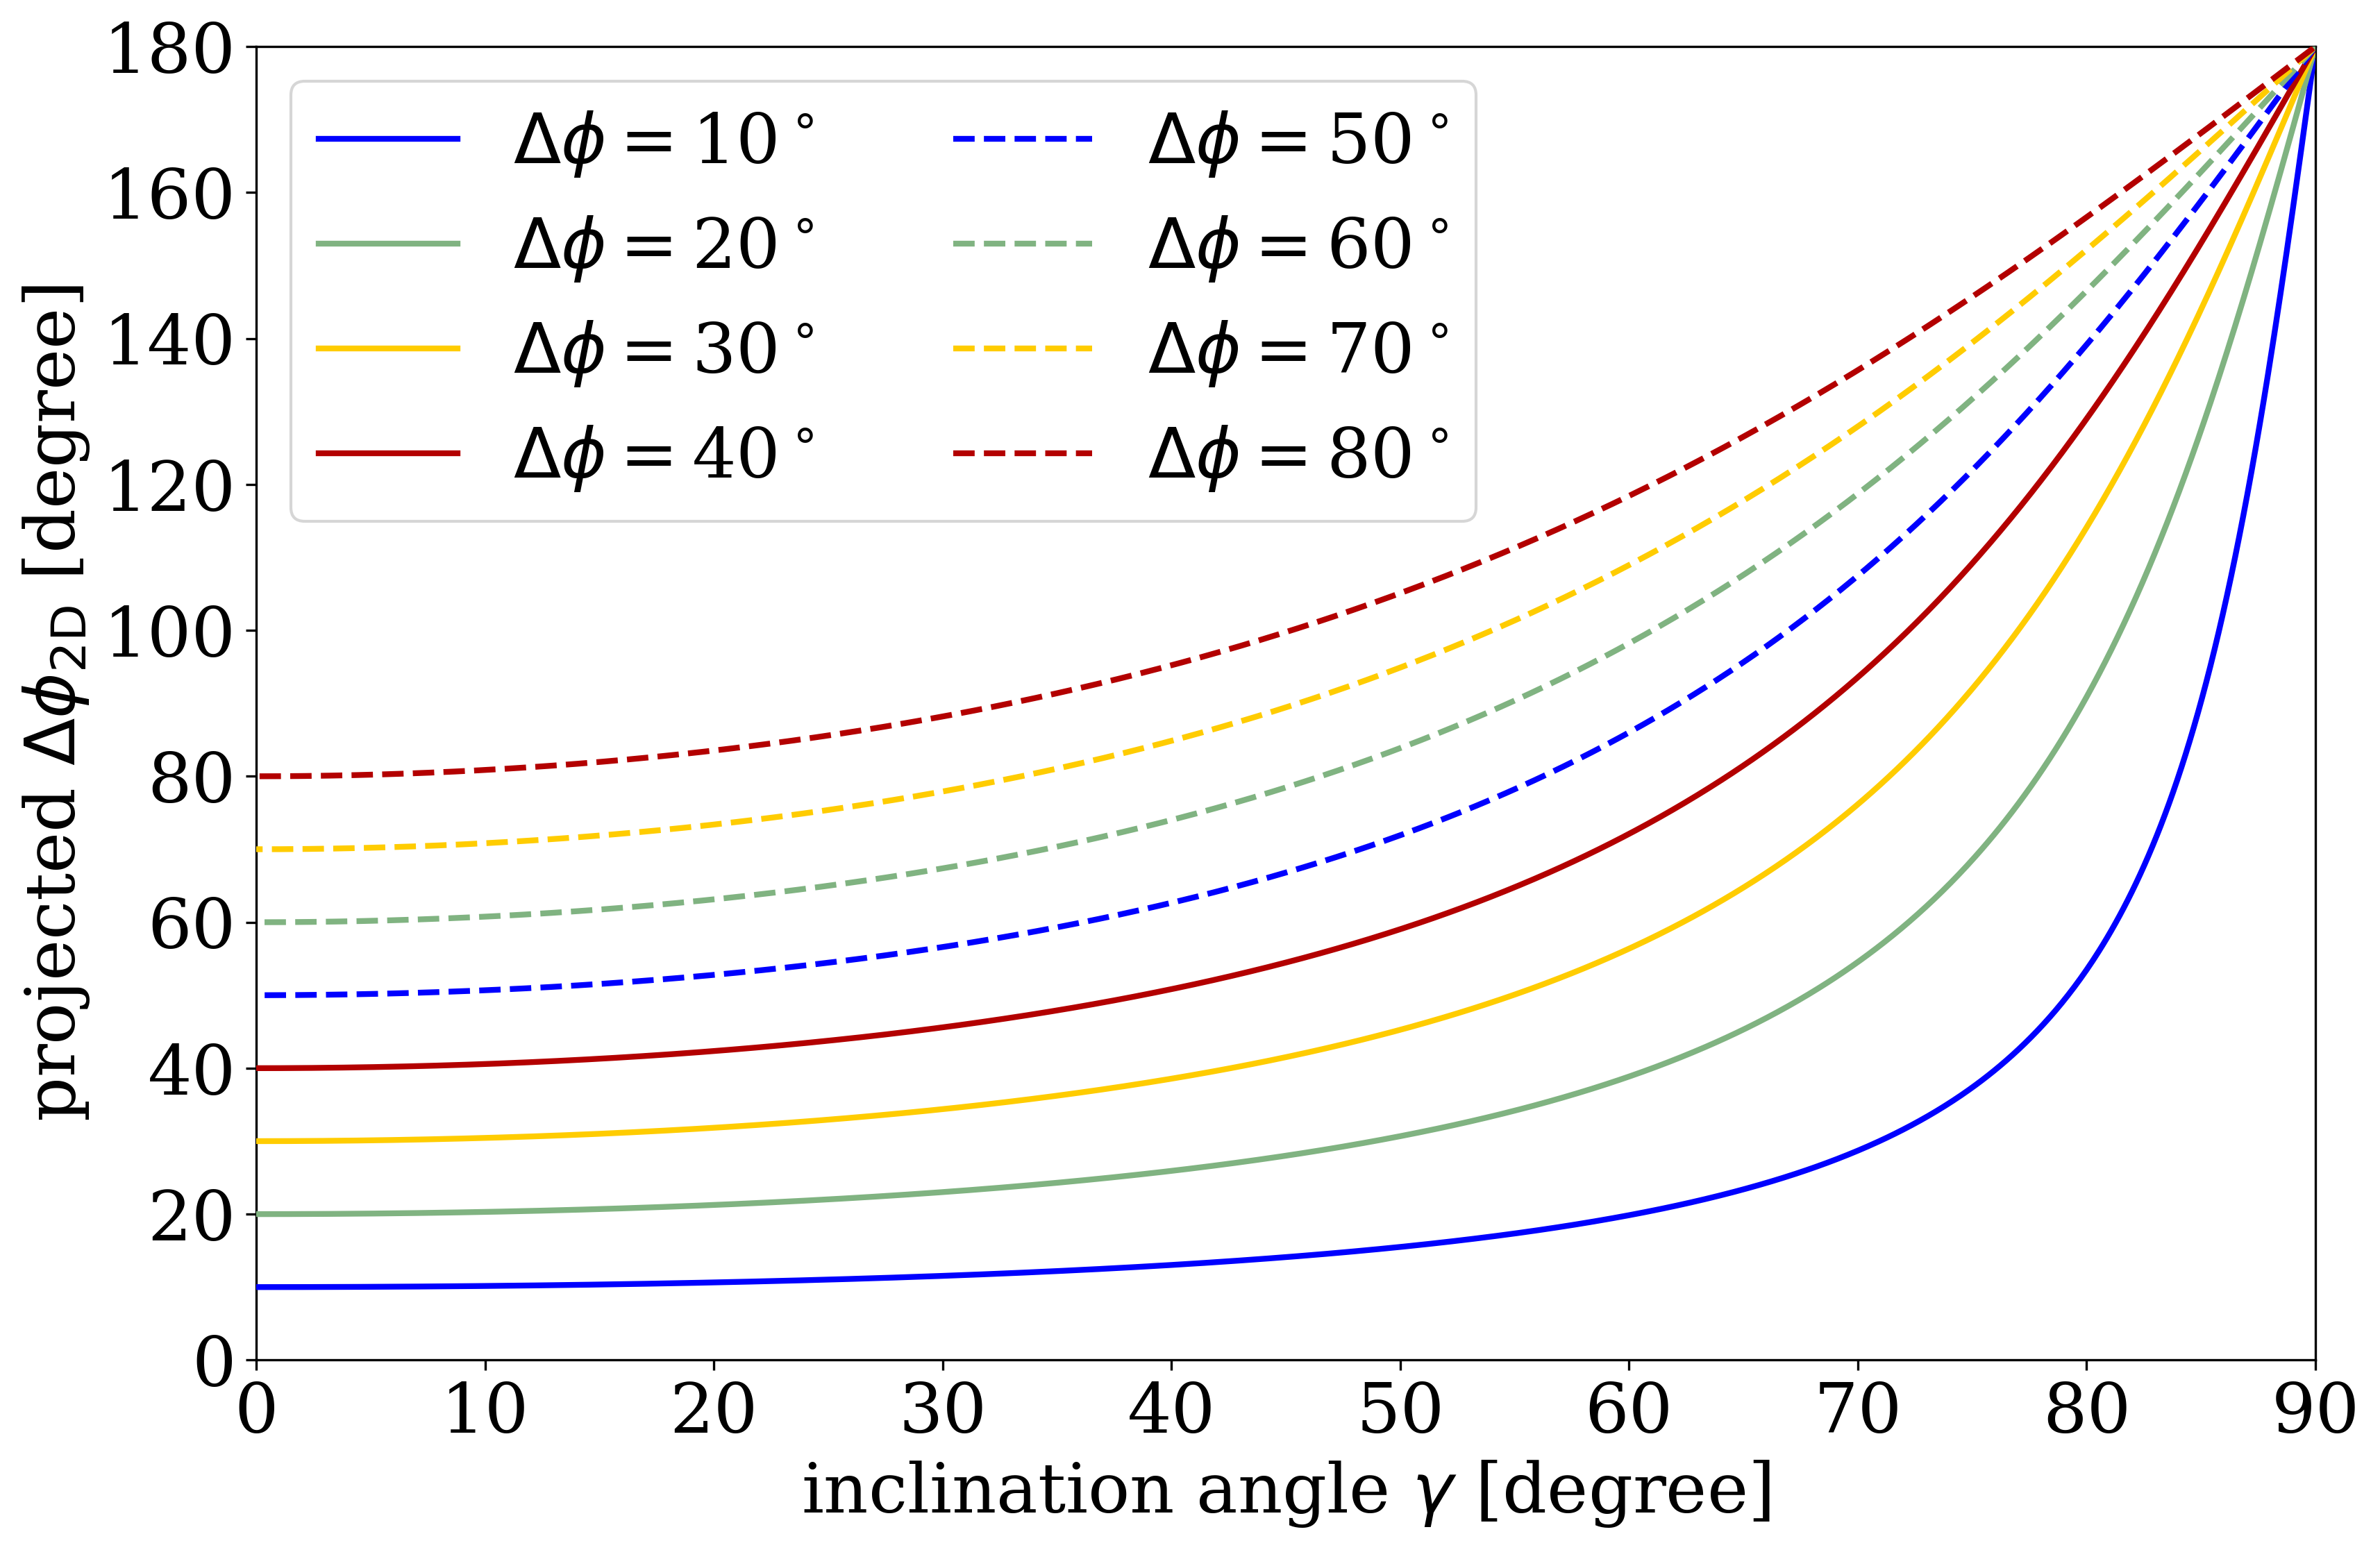
As discussed above, the DCF-derived magnetic field strength depends on the angle between the perturbed component and the mean direction of the magnetic field. However, it is important to note that the angle between two vectors in 3D may not be the same after being projected to 2D plane, and thus the uncertainty increases when applying the DCF method to 2D projected observations. Here we derive the equation for estimating the projection effect from 3D to 2D; i.e., the relation between the projected angle in 2D and the actual angle in 3D.
Consider two unit vectors on 3D Cartesian coordinates with an angle between them. Without loss of generality, we set these two vectors to be on the plane with
| (25) |
After projecting these two vectors to a plane with normal vector , the projected vectors become
| (26) |
Let the angle between the projected vectors be , then we have
| (27) |
Since
| (28) |
we have
| (29) |
and
| (30) |
For projected magnetic field on the plane of sky, represent two 3D vectors with angle between them, and are two vectors on the 2D map with angle difference . If we use the average of the two vectors as the reference direction and let the inclination angle between the mean field direction and the plane of sky be , the normal vector for (the plane of sky) is on the plane with and . Note that since we only consider values within , this means must be within . Eq. (27) thus becomes:
| (31) |
and we now have the correlation between projected angle and the original angle with being the inclination angle of the mean magnetic field with respect to the plane of sky.
Fig. 8 illustrates this projection effect by showing as functions of both and . Note that the projected angle measured in 2D is always larger than the actual angle in 3D, and the difference increases with inclination angle. This suggests that tends to be slightly overestimated, which makes the DCF-derived magnetic field slightly underestimated. However, this effect could be small if the inclination angle is not large (small ) or the actual perturbed field does not deviate much from the mean field in 3D (small ). For example, from Fig. 8, for a dispersion angle in 3D, the DCF method shall remain accurate within a factor of two if the inclination angle is roughly below . Nevertheless, as shown in Sec. 4, this projection correction is critical particularly in cases with large inclination angles (see e.g., Fig. 12).
3.3 Gas Volume Density in the DCF Method
When applying the DCF method on observations, one challenge is the estimate of the gas volume density , which requires additional information either from a chemical network or a measurement of the cloud depth along the line of sight. Here we describe two methods on estimating the cloud depth and hence the gas volume density from observable quantities. We compare them with the actual values and discuss how this affects the accuracy of the DCF method in Sec. 4.1.
3.3.1 Linewidth-Size Correlation
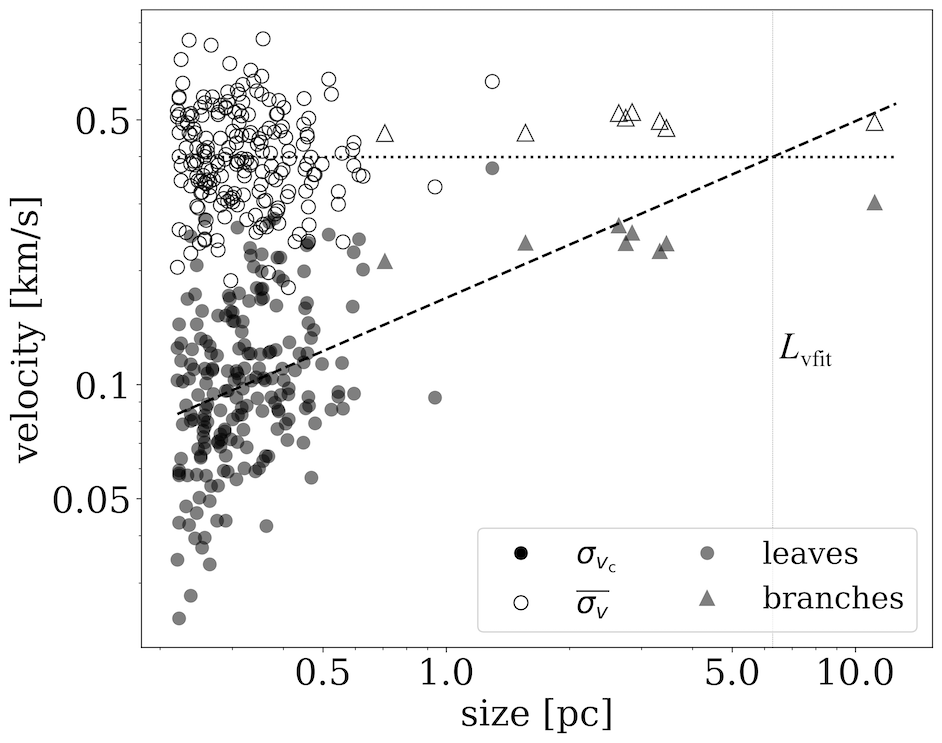
We first consider the method proposed in Storm et al. (2014) to estimate the cloud depth. This method (‘vfit’) is based on the assumption that the observed spectral linewidth traces the velocity dispersion () corresponding to the line-of-sight length scale of the cloud, while the spatial dispersion of the observed centroid velocity () should reflect the plane-of-sky size of the cloud based on Larson’s law on linewidth-size correlation (see Fig. 9 for illustration). We note that this assumption is valid as long as the entire target region belongs to a spatially-connected structure with a power-law correlation between the turbulence amplitude and the physical scale. Such linewidth-size correlation may break down in clouds with significant sub-structures, however.
Following Storm et al. (2014), we identify spatially-coherent structures (cores, branches, trunks) from the column density map using the Python toolkit astrodendro, then calculate the mean linewidth () and the dispersion of centroid velocity () within each structure. We then fit the dispersion of centroid velocity as a power-law function of the physical size of the structure, :
| (32) |
which represents the scale relation of the turbulence of the given system, . We can then use the average value of the line-of-sight velocity dispersion to determine the depth of the cloud under the assumption that the turbulence is isotropic:
| (33) |
Note that, when applying on the DCF analysis, this method is relatively independent of the line-of-sight velocity dispersion if the scale dependence of the centroid velocity roughly follows the Larson’s law, i.e., :
| (34) |
The derived magnetic field strength thus only depends on the fitting result of , the dispersion of centroid velocity within unit-size structures.
3.3.2 Pressure Equilibrium
Alternatively, we can consider the cloud as a layer in hydrostatic equilibrium (see e.g., Elmegreen & Elmegreen, 1978), but in a more general form. Considering a self-gravitating sheet-like cloud where the internal energy density balances the pressure from gravitational potential:
where and . For a magnetized turbulent cloud, we shall have . Assuming constant density, the equation can be simplified as
| (35) |
where is the gravitational pressure in the midplane (see e.g., McKee et al., 1993).
Combining with the 2D DCF equation Eq. (24), we can solve the cloud depth as
| (36) |
The corresponding magnetic field strength is therefore
| (37) |
Note that is basically , the Alfvén Mach number. In the case of magnetic domination over turbulence, , Eq. (37) reduces to
which means the normalized mass-to-flux ratio of the cloud , or the cloud is magnetically critical. We stress that the method described in this subsection is applicable only to self-gravitating sheet-like clouds.
3.4 Density Cutoffs as Synthetic Line Observations
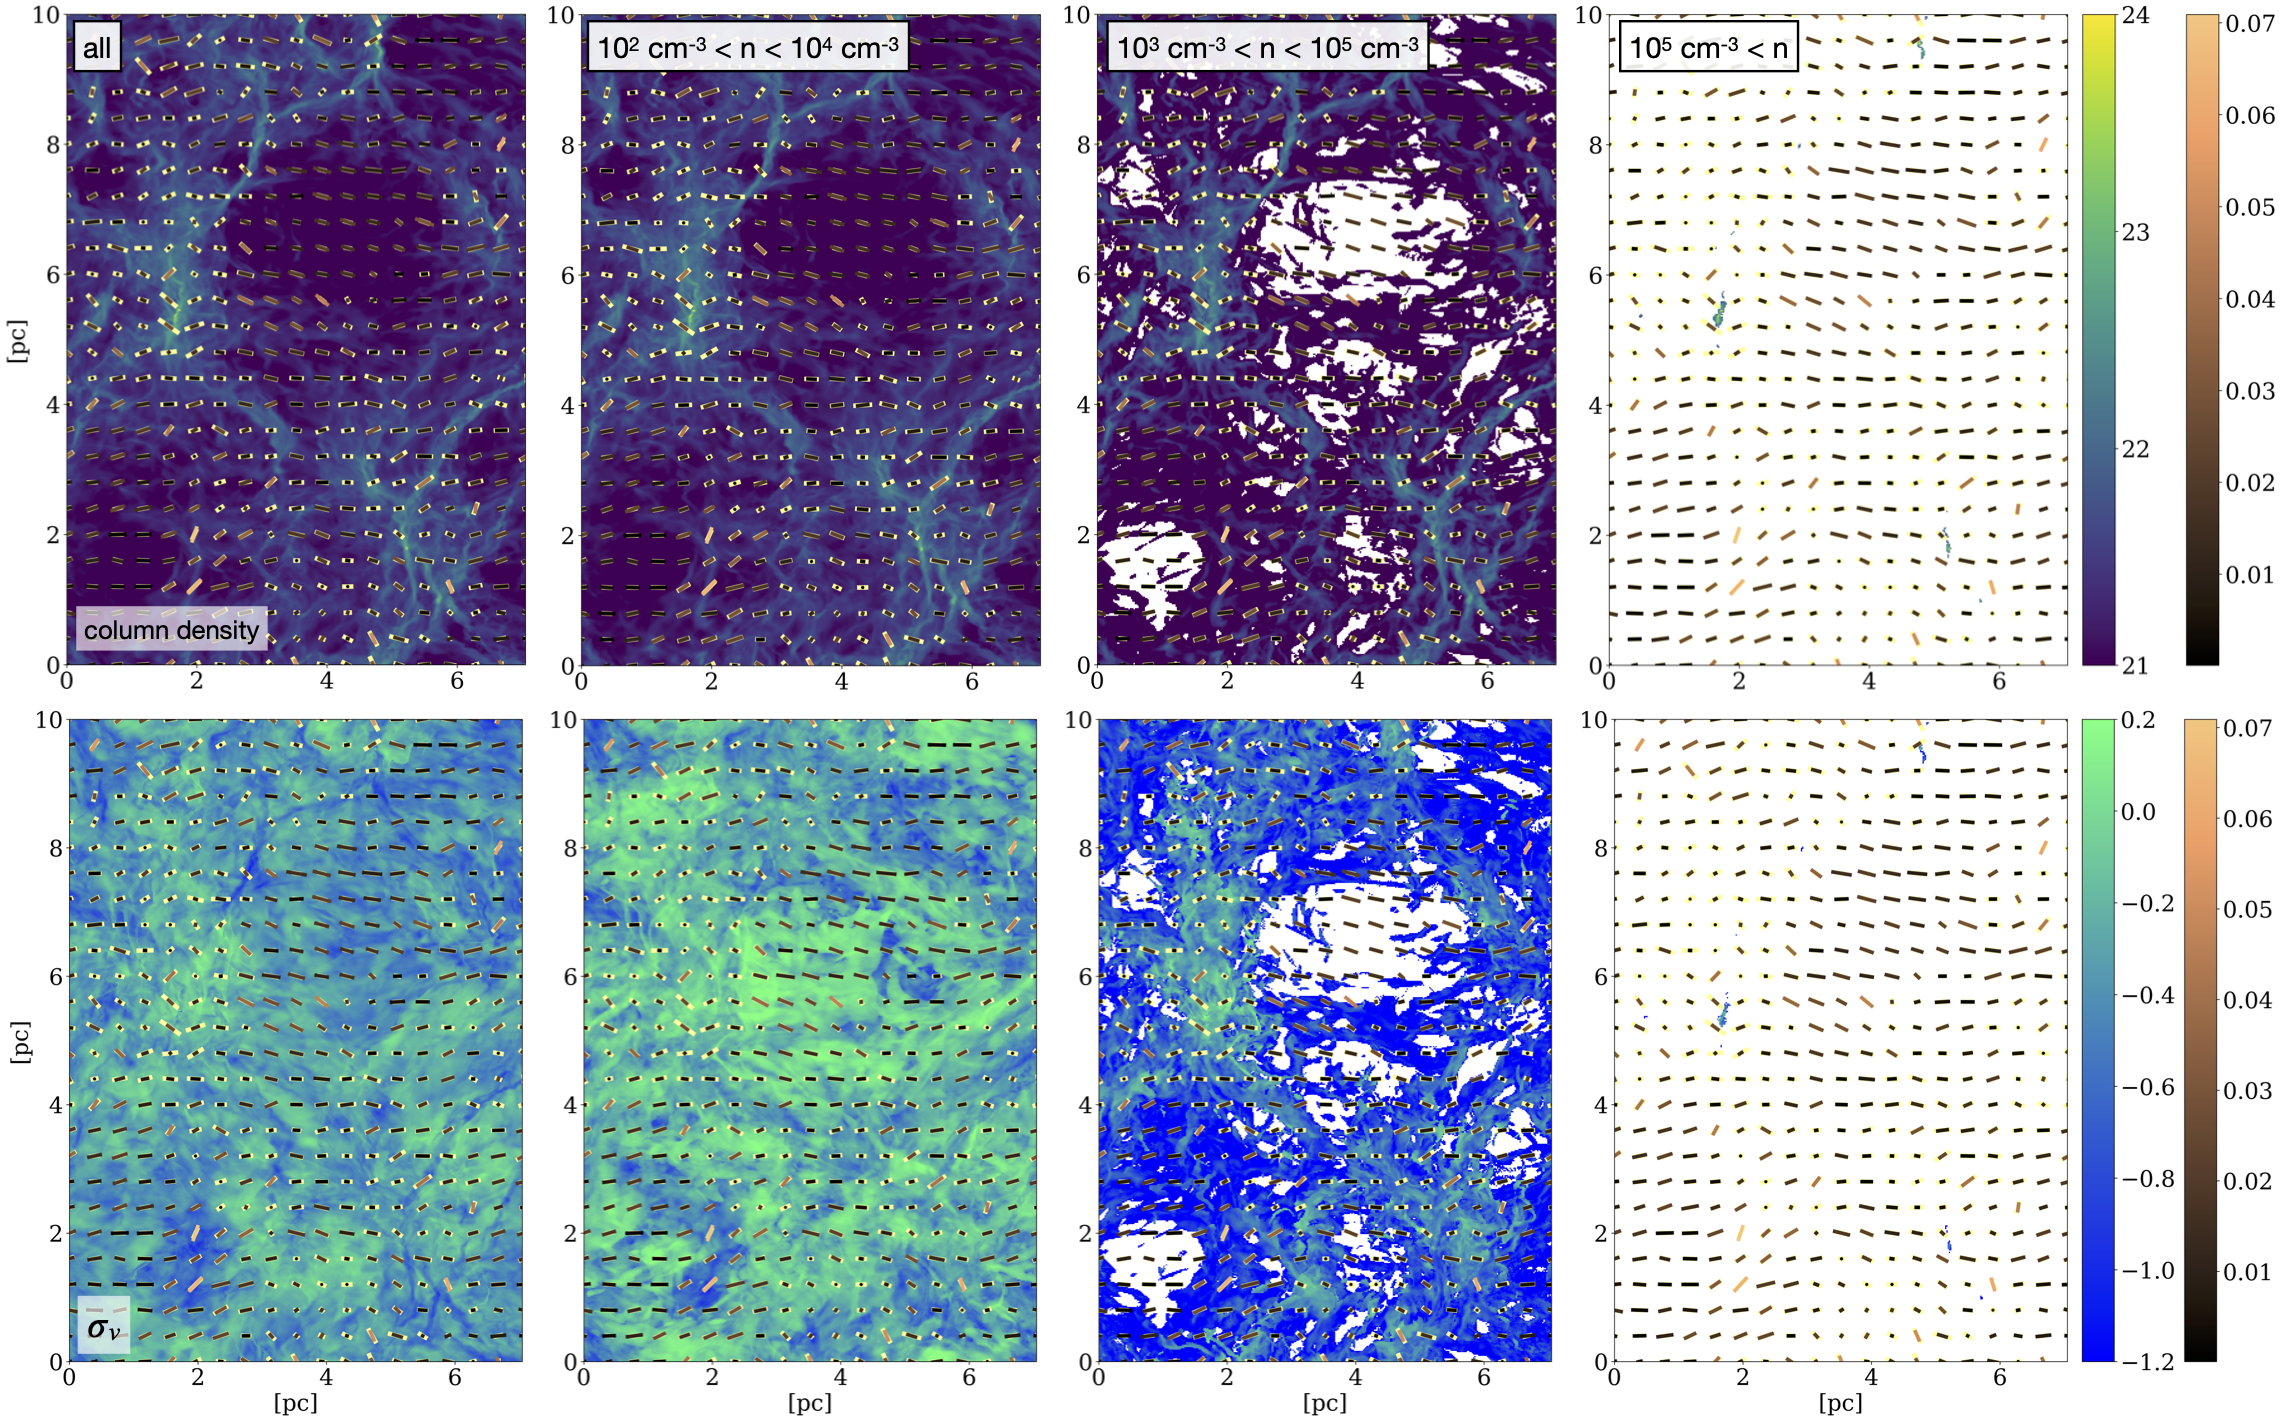
In addition to gas volume density, the DCF method still requires more information than just the polarization morphology. Observationally, the velocity dispersion can be probed by the width of molecular line emission in the velocity space. However, the critical gas densities of various molecular lines are different, and the measured velocity dispersion therefore may highlight different regions of the target cloud that have different densities. Synthetic line observations using tracers with different critical densities may help test how this could affect the accuracy of the DCF method.
We thus consider a simplified method of generating synthetic line observations by applying density masks to all sightlines; i.e., for each sightline, we only include cells with gas volume densities within the specified density range when generating the corresponding synthetic observations. This is illustrated in Fig. 10 using model L10_inc30 as an example. Three density ranges are selected to approximate the typical gas tracers commonly used in line observations towards star-forming regions (see e.g., Shirley, 2015; Fissel et al., 2019): (low to intermediate density regime, e.g., 13CO, C18O), (intermediate to dense gas, e.g., NH3, N2H+), and (the densest gas component, e.g., HCN, H13CO+). Note that we only used our simplified synthetic line observation to calculate the synthetic integrated line intensity (used in defining dendrograms for the ‘vfit’ density-estimating method) and velocity dispersion, but not the column density (which is typically derived from multi-wavelength continuum observations) and polarization angles, because thermal dust emission is independent from the molecular line observations.
Fig. 10 demonstrate this synthetic line observation test by showing the corresponding integrated emission (top row) and velocity dispersion (bottow row) from the three cases described above. Obviously, dense gas tracers () would only follow the densest structures, and thus is not very suitable for our statistical approach of the DCF method. Also, we note that the velocity dispersion traced by the low-density tracer () is higher than that measured in gas with intermediate densities (), which is not surprising because we expect the diffuse gas to be more turbulent. We will discuss the corresponding DCF results in Sec. 4.2 below.
4 Comparisons and Discussions
4.1 Testing density-estimating methods in synthetic observations with the statistical approach
| model | ) | , | , | , | ||||||||||||
| (km/s) | ( cm-2) | vfit | eq | ana | vfit | eq | ana | vfit | eq | ana | vfit | eq | ana | |||
| L1_inc0 | 7 | 8 | 0.18 | 6.54 | 3.1 | 2.6 | 4.3 | 0.4 | 0.5 | 1.6 | 0.9 | 0.5 | 3.9 | 0.9 | 0.5 | 3.8 |
| L1_inc30 | 37 | 11 | 0.28 | 8.80 | 3.3 | 2.7 | 4.3 | 0.8 | 0.9 | 2.4 | 1.8 | 0.9 | 5.8 | 1.5 | 0.7 | 4.7 |
| L1_inc60 | 67 | 27 | 0.41 | 24.0 | 4.0 | 4.0 | 4.3 | 1.5 | 3.2 | 2.2 | 3.3 | 3.0 | 4.7 | 1.8 | 1.8 | 2.5 |
| L5_inc0 | 7 | 17 | 0.31 | 1.41 | 1.7 | 1.5 | 2.9 | 0.4 | 0.7 | 1.8 | 0.9 | 0.7 | 3.9 | 0.9 | 0.7 | 3.8 |
| L5_inc30 | 37 | 24 | 0.31 | 1.85 | 2.0 | 1.9 | 2.9 | 0.6 | 1.2 | 1.8 | 1.5 | 1.2 | 4.2 | 1.3 | 1.1 | 3.7 |
| L5_inc60 | 67 | 43 | 0.42 | 5.12 | 2.4 | 3.2 | 2.9 | 0.5 | 1.5 | 0.9 | 0.8 | 1.2 | 1.5 | 0.7 | 1.7 | 1.3 |
| L10_inc0 | 2 | 24 | 0.51 | 1.71 | 1.8 | 1.6 | 2.7 | 0.6 | 0.6 | 1.2 | 1.2 | 0.6 | 2.5 | 1.3 | 0.6 | 2.7 |
| L10_inc30 | 28 | 28 | 0.49 | 2.22 | 2.1 | 1.9 | 2.7 | 0.6 | 1.0 | 1.4 | 1.4 | 0.9 | 2.9 | 1.4 | 1.0 | 2.8 |
| L10_inc60 | 62 | 45 | 0.75 | 2.53 | 2.1 | 2.2 | 2.8 | 0.8 | 0.9 | 1.5 | 1.2 | 0.7 | 2.2 | 1.2 | 1.1 | 2.1 |
| L20_inc0 | 2 | 37 | 0.68 | 1.68 | 2.2 | 1.7 | 2.4 | 0.5 | 0.4 | 0.6 | 0.8 | 0.3 | 1.1 | 1.1 | 0.5 | 1.4 |
| L20_inc30 | 32 | 42 | 0.56 | 2.13 | 2.3 | 2.2 | 2.4 | 0.5 | 0.6 | 0.6 | 0.9 | 0.5 | 1.0 | 1.1 | 0.8 | 1.2 |
| L20_inc60 | 63 | 47 | 0.75 | 5.17 | 2.2 | 2.8 | 2.3 | 0.3 | 0.8 | 0.4 | 0.5 | 0.6 | 0.6 | 0.6 | 1.1 | 0.7 |
| 0.27 | 0.18 | 0.24 | 0.16 | 0.20 | 0.41 | 0.12 | 0.15 | 0.38 | ||||||||
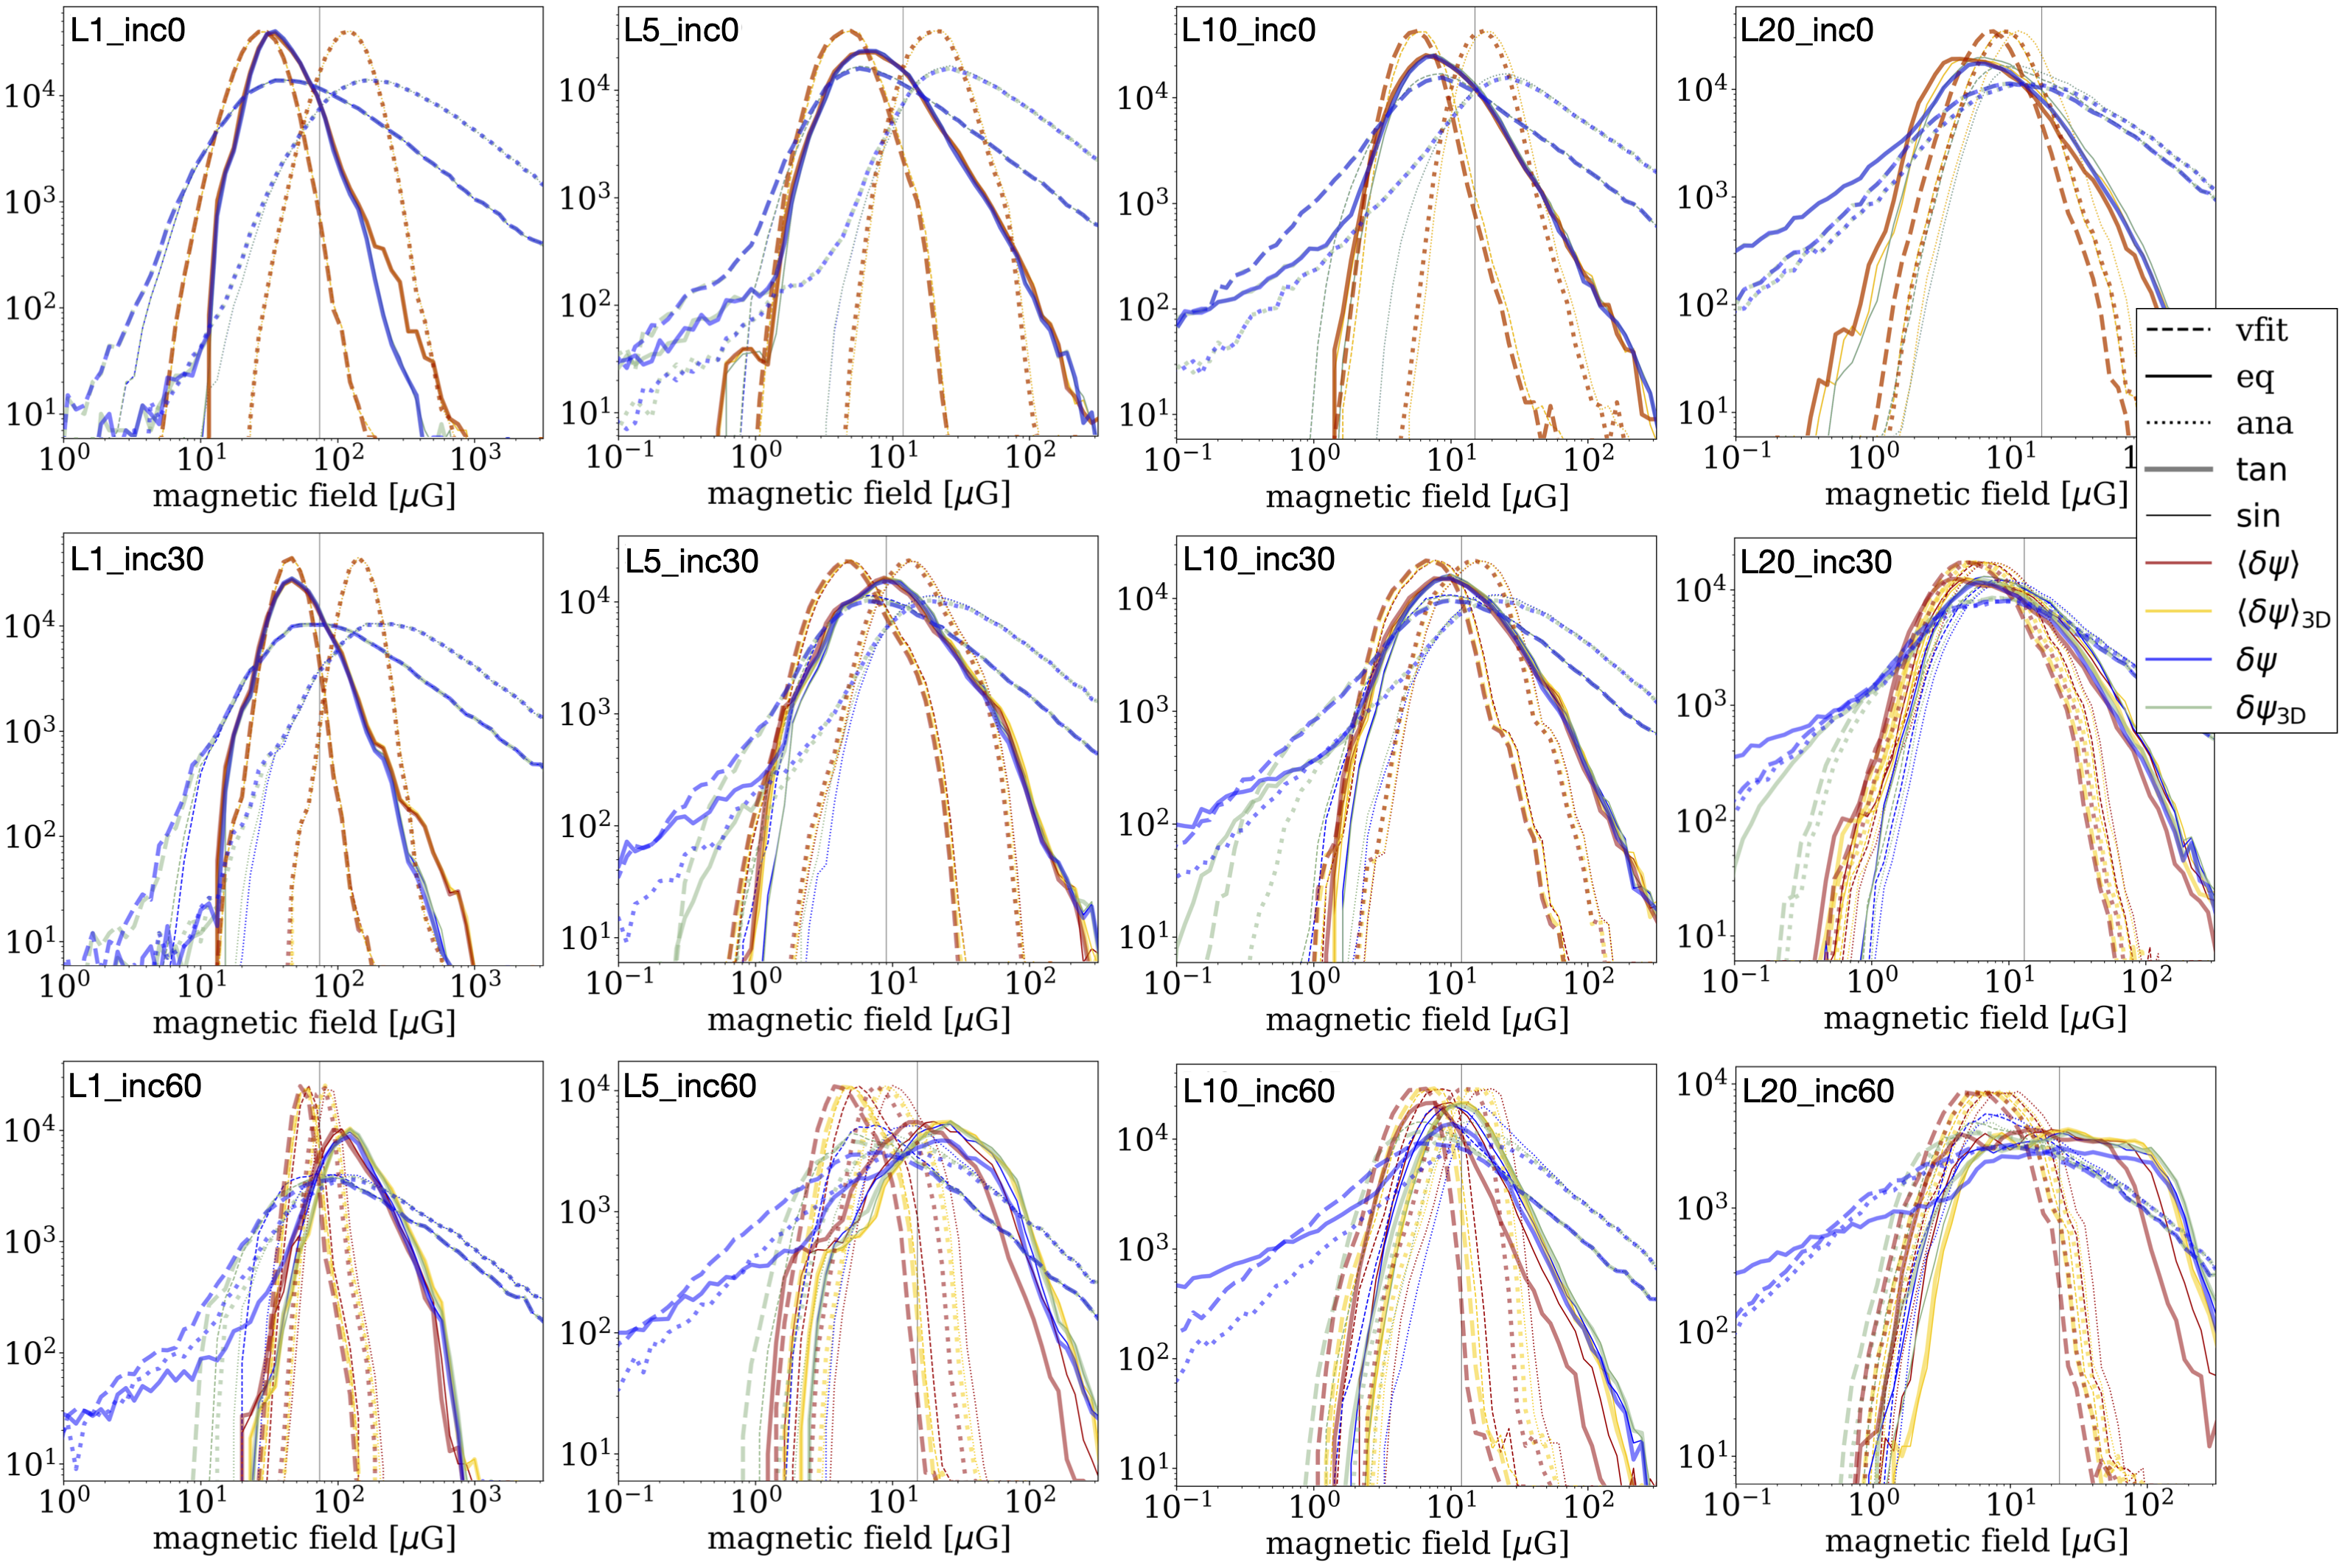
We first focus on comparing the different methods of deriving gas volume density using synthetic observations generated from our 3D MHD simulations. Here, we consider 4 simulation models (L1, L5, L10, and L20; see Table 1) and generate synthetic observations at 3 viewing angles so that the inclination angles of the mean magnetic field are , , . The basic observable properties of these synthetic observations that are important in the DCF analysis (column density, velocity dispersion, and polarization angle dispersion) are listed in Table 2.
The derived mean densities are also listed in Table 2. Besides the two density-estimating methods discussed in Sec. 3.3 (‘vfit’ and ‘eq’), we also provide estimates of the cloud depths and corresponding gas density from our 3D simulation data. Since all models considered here are convergent flow simulations where clouds formed by shock compression, the typical depth of the cloud when viewed face-on is the thickness of the post-shock layer, which is about of the size of the simulation box. For simplicity, we define the ‘analytic’ cloud depth at various inclination angle as
| (38) |
In addition, three more comparisons are considered here: 1) whether or not the previously proposed replacement based on our 3D analysis (see Sec. 2.4) still holds in 2D observations,555Note that this is different from given in Eq. (24), which uses the mean density and velocity dispersion to give one value of the DCF-derived field strength over the entire map. Here, we want to focus on the comparison between and , and thus we keep the local values of and in the calculation and only switch between and (see Eq. (23)). The shape of the distribution of DCF-derived field strength when using therefore completely depends on hydrodynamic properties of the gas (see Fig. 11). 2) whether or not the previously proposed replacement based on our 3D analysis (see Sec. 2.4) still holds in 2D observations, and 3) if the projection correction on 2D dispersion angle could be critical in the DCF analysis. A summary of the synthetic models and corresponding DCF results, including the mean densities derived from the linewidth-size correlation (‘vfit’), the equilibrium (‘eq’), and the analytic solution (‘ana’), the DCF-derived magnetic field strength using both and as the polarization angle dispersion, as well as a projection-corrected DCF result using , can be found in Table 2, while Figs. 11 and 12 provide more detailed comparisons of the results through graphical visualization.
Fig. 11 illustrates our results from the 12 synthetic observations, showing the probability distribution functions of the DCF-derived magnetic field strength 1) using different density-deriving methods, 2) with or without the replacement of or , and 3) with or without the projection correction , which can be derived from Eq. (31):
| (39) |
Note that when considering the projection effect of , we adopted the projection-corrected velocity dispersion to replace in the DCF equation (Eq. (24)). This is to exclude the velocity component parallel to the magnetic field, which does not contribute to the observed field distortion.
Comparing Fig. 11 to the 3D results (right panel of Fig. 3; also see right panel of Fig. 4), we see that the 2D DCF-derived field strengths do not always preserve the nice, symmetric shape of log-normal distribution of the DCF-derived field strengths in 3D. Only synthetic observations with moderate turbulence levels (e.g., models L5 and L10) and inclination angles (e.g., ) seem to recover the log-normal distribution of magnetic field strength, and in fact have more accurate DCF results (also see Table 2). This indicates that the DCF method is less applicable for extreme scenarios with strong turbulence (e.g., model L20) and/or very large inclination angles (e.g., ). This is not surprising, because the main assumptions one needs to make in order to apply the DCF method in 2D (isotropic velocity field and no cancellation along the line of sight) break in these extreme cases.
Another important feature revealed by Fig. 11 is the clear difference in both the value and the shape of the distribution between the three density-deriving methods. We also note, from Table 2, that the derived mean densities from the three different methods are highly inconsistent with each other in many of the synthetic observations we studied here. This in fact provides an important message on applying the DCF method in observations: the biggest uncertainty of calculating DCF-derived magnetic field strength comes from the estimate of gas density, not the polarization measurement. We will discuss this later in this section.
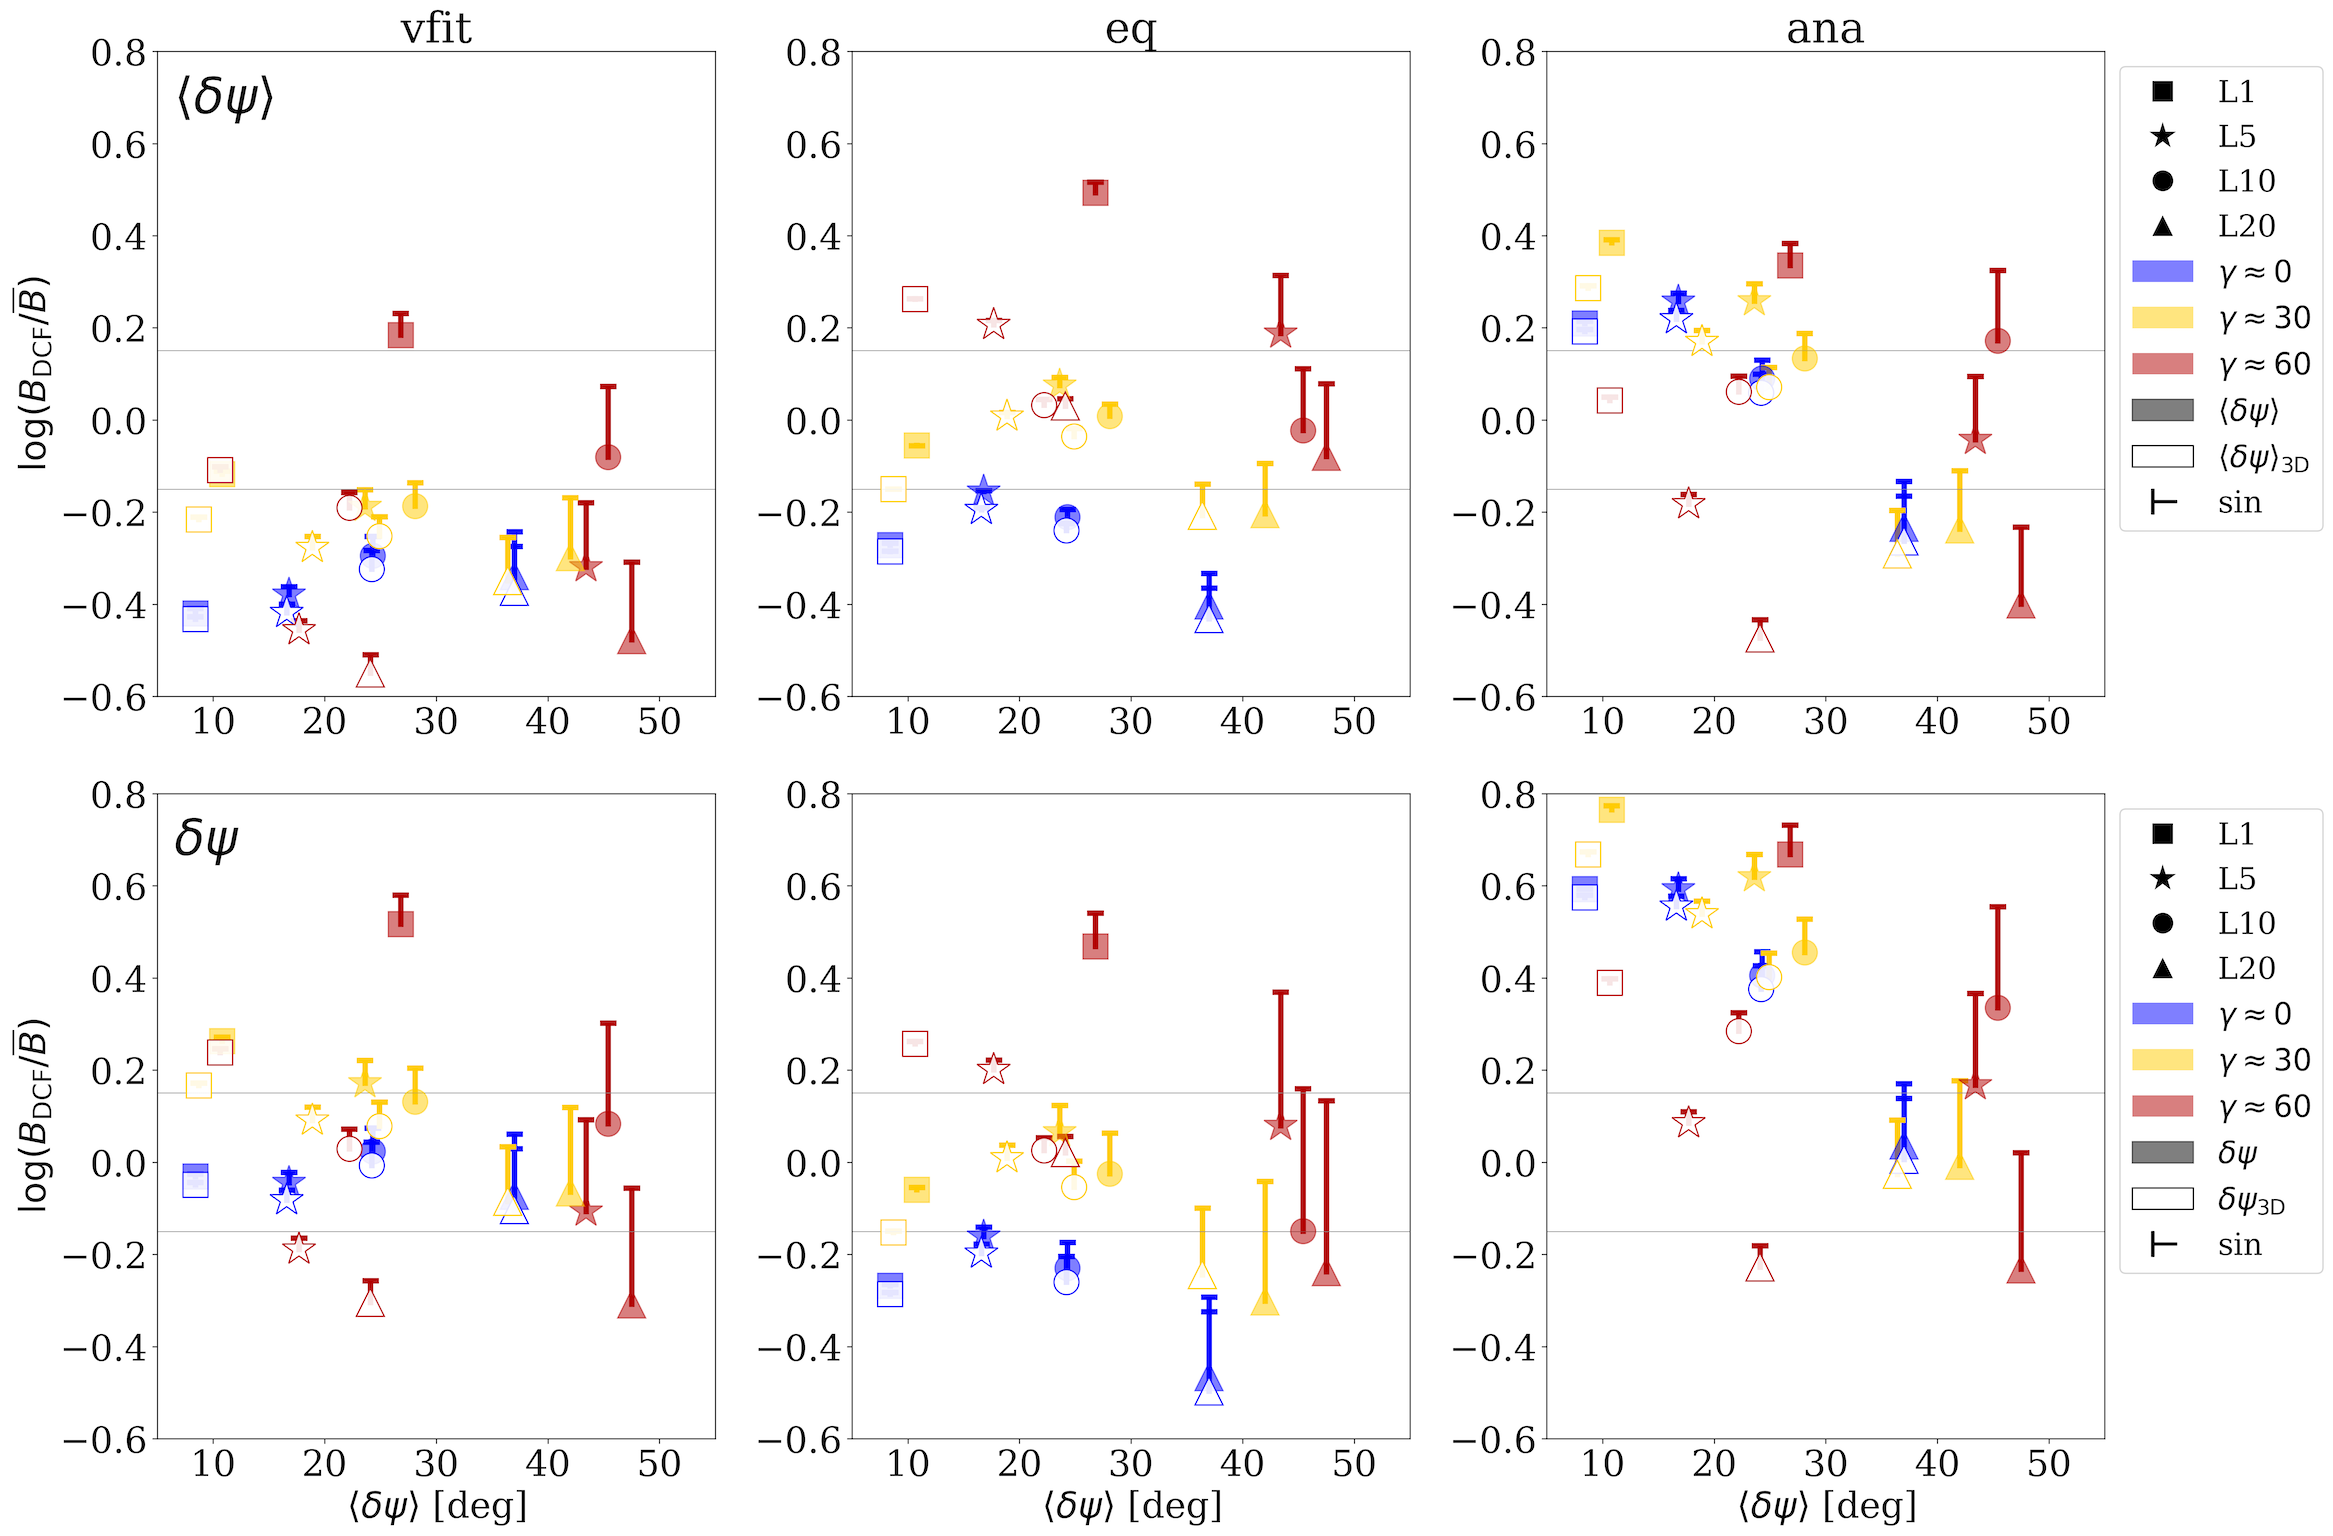
The complete results combining all 12 synthetic observations, 3 density-deriving methods, and 3 proposed modifications (, , and ) are summarized in Fig. 12. Here, we plot in log scale the ratio between the DCF-derived magnetic field strength (from Eq. (24)) and the actual mean field strength, , vs. the mean dispersion of polarization angle , for each model and method. Note that for most of the cases, (and ), but when considering the projected polarization angles , is used. Also, two horizontal lines are drawn at so that if a model has all derived values within these two lines, we can claim this model is accurate within a factor of 2.
We see clear improvement of the accuracy of when switching from (top row) to (bottom row), especially for the ‘vfit’ method (left column). With , the ‘vfit’ method was able to produce within a factor of 2 of the actual value for almost all synthetic observations except those with high inclination angles (; red symbols). On the other hand, the simple method ‘eq’ (middle column) seems to be less impacted by the choice of or , and the DCF-derived magnetic field strengths using this method are also pretty consistent with the actual values especially for moderate inclination angles ().
To quantitatively compare the accuracy of our proposed methods and revisions to the DCF equation, we define the accuracy measurement :
| (40) |
which is always positive and between 0 and 1. Smaller means the estimate of is more accurate. The mean value of for each model is presented in Table 2. Switching from to brings for ‘vfit’ method down to 0.16 from the original 0.27, and if we added the projection correction and the revision, for ‘vfit’ method, which is the best performing model in this test. As mentioned earlier, method ‘eq’ is not affected much by the choices of or . Instead, the accuracy of method ‘eq’ is pretty consistent with when using either , , or in the DCF equation.
The unexpected result is the bad performance of the ‘ana’ method, which theoretically should give the most accurate estimate of the mean gas density. Instead, the derived ratios are very scattered in Fig. 12, and none of our proposed revisions helped reduce such error. Combining with the facts that the density estimates from different methods often vary a lot and the fitting method from linewidth-size correlation gives the best estimates, we believe our results suggest that the line-of-sight velocity dispersion used in the DCF equation cannot properly reflect the actual turbulent component of the velocity in the system, and only the mean density value derived also from velocities (the ‘vfit’ method) could offset this uncertainty. Thus, even though the derived mean density is not accurate, the resulting is closer to the real value than that using the more accurate density from the analytic approach if the line-of-sight velocity dispersion is used, as is commonly the case. We note that though the reasoning differs, this is similar to the argument discussed in Cho & Yoo (2016) that in addition to the commonly-used line-of-sight velocity dispersion, the centroid velocity should also be taken into consideration in the DCF analysis.
Moreover, even though the line-of-sight velocity dispersion is density-weighted, the linewidth could still hugely depend on the low density gas that has larger velocity difference from the density-weighted mean central velocity. Since the mean density is mainly determined by the dense gas, it is less correlated with the velocity dispersion. We thus note that the cloud depth derived from ‘vfit’ method (Eq. (33)) should not be treated as the physical cloud depth; rather, it should be viewed as a characteristic length scale corresponding to the measured line-of-sight velocity dispersion.
The projection effect discussed in Sec. 3.2 is illustrated in Fig. 12 as solid (POS values) vs. open (reprojected) symbols. We see that the best scenario for the projection correction to work is the high-inclination low-perturbation case (model L1_inc60; red squares), which is expected because the mean inclination angle of the magnetic field is more representative in less turbulent environment, and the projection effect is more significant when the field inclination angle is large. We also note that the projection correction seems to work the best with the ‘eq’ density-deriving methods. This could be due to that the ‘eq’ method considers the cloud as an infinite slab with plane-parallel magnetic field (so ; see Eq. (35)), so the actual inclination of the magnetic field plays a more critical role in estimating the field strength using this method, especially since the line-of-sight cloud depth also depends on the inclination angle (Eq. (36)).
Also shown in Fig. 12 is the modification of the DCF method we proposed in Sec. 2.4, that the term should be replaced by (plotted as single-sided errorbars). We found that though seems to be slightly more accurate with , the improvement is small except for cases with large dispersion of polarization angles () because for small angles. While, from the values in Table 2, using is statistically more accurate than the traditional DCF method, the biggest uncertainty in the DCF method seems to be coming from the gas density and turbulence level, and thus the modifications on polarization measurement generally have weak impact on improving the accuracy of the DCF method.
4.2 Testing Density Dependence and Polarization Selection
| model | (km/s) | |||||
|---|---|---|---|---|---|---|
| all | all | |||||
| L10_inc0 | 24 | 23 | 0.51 | 0.70 | 0.17 | 0.22 |
| L10_inc30 | 28 | 26 | 0.49 | 0.66 | 0.20 | 0.24 |
| L10_inc60 | 45 | 44 | 0.75 | 0.83 | 0.27 | 0.22 |
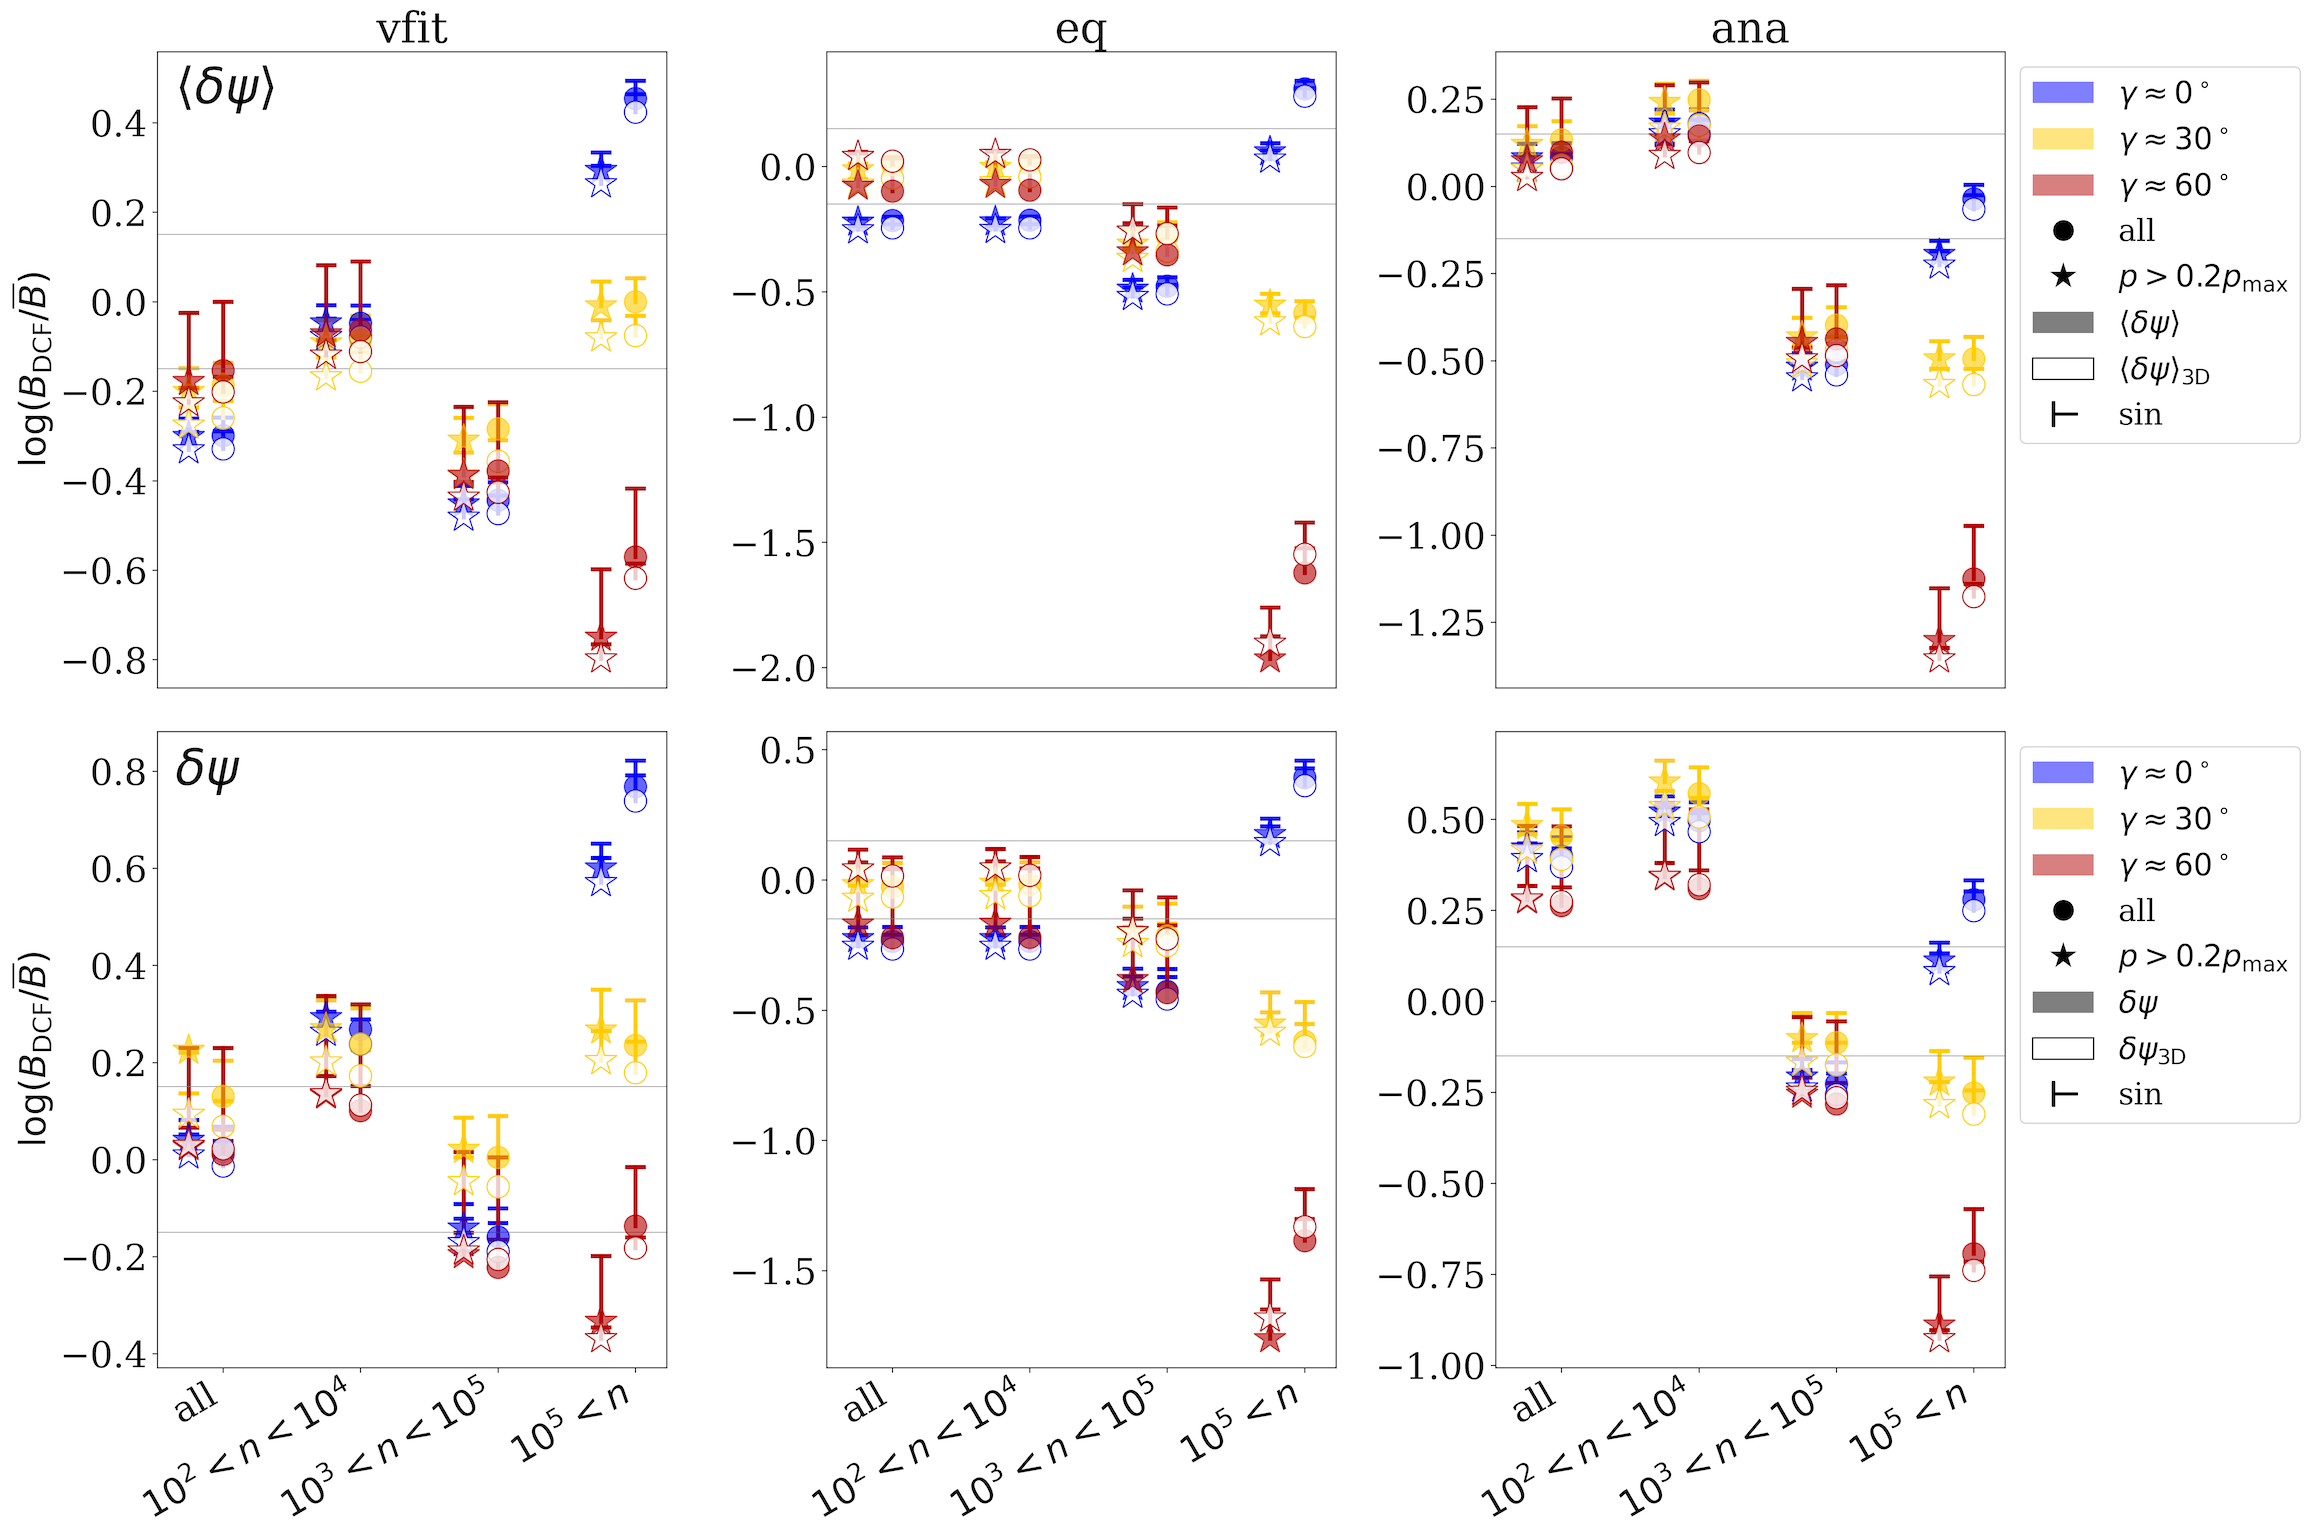
As discussed in Sec. 3.4, density selection effect could also play a critical role in determining the gas turbulence level and thus the DCF analysis. Our simplified synthetic line observations were described in Sec. 3.4, and examples of the corresponding column density and velocity dispersion maps were demonstrated in Fig. 10. Here, we consider three viewing angles of simulation model L10 (synthetic models L10_inc0, L10_inc30, and L10_inc60 in Table 2) with three different density cutoffs adopted in Fig. 10 (, , and ; see Table 3) to investigate what density range could provide the most accurate DCF result in star-forming clouds.
In addition, we examine the effect of limiting the analysis to pixels with polarization fraction above a certain threshold ( here), as we discussed in Sec. 3.1. We would like to point out that this polarization selection effect only has impact on the measured dispersion angle of polarization orientation, while the density selection effect only changes the velocity dispersion. The models considered in this test and the corresponding parameters are listed in Table 3. We note that applying the mask based on polarization fraction does not seem to affect the measured polarization angle dispersion much. On the other hand, the synthetic linewidth hugely depends on the density selection effect, as already suggested in Fig. 10. The velocity dispersion tends to be larger in lower-density gas, which also differs from the values measured without any density selection effect (‘all’ in Table 3; column 4). This suggests that any DCF analysis based on synthetic observations without considering the density selection effect may be inaccurate and incompatible to actual observations.
The results of the DCF analysis are summarized in Fig. 13. Similar to Fig. 12, here we plot the ratio ( for cases without projection correction) in log scale, and draw horizontal lines at to show the boundaries of accuracy of a factor of 2. All values are plotted as functions of the density selection range. We also include the comparisons between using 1) and (top vs. bottom row), 2) and (solid vs. open symbols), and 3) and (symbols vs. errorbars) in the DCF equation Eq. (24).
Interestingly but not surprisingly, the density selection effect does have strong impacts on the accuracy of the DCF result, and the low-to-intermediate density range in general delivers the most accurate DCF-derived field strength to the actual value, regardless the field inclination angle with respect to the plane of sky. As discussed above, such discrepancy could be due to the velocity dispersion being sensitive to the density cuts (see e.g., Table 3 and Fig. 10). Moreover, the high-density tracers tend to recover only the densest structures, and thus do not have sufficient pixels to have good statistics for the DCF method (see Sec. 3.3 and Fig. 10). The low- and intermediate-density tracers (within the range of - cm-3) therefore appear to be the better choices for conducting the DCF analysis in star-forming clouds, which is rational given that this analysis aims to retrieve the cloud-scale magnetic field strength, and - cm-3 is indeed the typical range of cloud-scale density.666We note that it remains an open question that, with enough statistics via high resolution maps, whether the DCF method works in dense, star-forming structures like cores and filaments, in addition to the relatively diffuse and turbulent cloud environment. We shall explore this topic in a following work (J. Park et al., in prep).
We further note that limiting the analysis based on polarization fraction ( adopted here) does not seem to make huge differences (stars vs. circles in Fig. 13). This is consistent to the fact that the mean angle dispersion values remain similar with or without the polarization fraction limitation, as listed in Table 3. This may seem surprising, since Fig. 7 already showed that the observed polarization orientation and the actual plane-of-sky magnetic field structure are only tightly correlated when the polarization fraction is large enough. In fact, we repeated the same analysis with the more strict selection criterion , and found that the accuracy of the DCF method decreased instead. This again suggests that the accuracy of the DCF method is not determined by the polarization measurement, but relies on good statistics as well as good hydrodynamics estimates.
Similar to the discussion in the previous section, the projection correction seems to work better with the ‘eq’ method of density derivation, but is only significant when the inclination angle is large (model L10_inc60; red symbols). Another modification we proposed based on the 3D analysis, , does not seem to show consistent improvement to the DCF-derived field strength, which agrees with the results in the previous section. Combining with the result that the polarization selection effect does not play a huge role in determining the accuracy of the DCF analysis, we conclude that the DCF analysis relies more on the shape and the peak location of the probability distribution instead of the precise measurement at each location. Conceptually, this agrees with our argument based on our 3D analysis that it is not necessary to have the exact solution of everywhere as long as the distribution of peaks around 1 (see Sec. 2.3).
5 Cancellation Effect from Integration
By applying the DCF analysis to their numerical simulations and synthetic polarization measurements, Ostriker et al. (2001) suggested that a factor of should be included in the DCF method as a calibration factor:
| (41) |
Note that the above DCF equation used in Ostriker et al. (2001) differs from the commonly-adopted Eq. (24), because Ostriker et al. (2001) considered instead of (see Li et al. 2021 for derivation and justification). This means that the so-called DCF coefficient of , based on the results of Ostriker et al. (2001), was derived from assuming , and therefore may not be appropriate when is used. Nevertheless, this so-called DCF coefficient has been considered to be a necessary correction factor to acount for the projection/integration effects from inhomogeneities, anisotropies, resolution, and/or variation along the line of sight (see e.g., Zweibel, 1990; Myers & Goodman, 1991; Heitsch et al., 2001).
However, the vs. plot in Fig. 7 shows that the polarization orientation in our synthetic observations generally follow the projected magnetic field direction pretty well. This suggests that the cancellation effect along the line of sight is not significant in our models, and may explain why we did not need to include the so-called DCF coefficient as proposed in Ostriker et al. (2001). More importantly, our results indicate that the DCF coefficient is likely not a constant globally applicable in all environments, and proper calibration is critical in order to increase the accuracy of the DCF method (see recent works e.g., Li et al., 2021; Liu et al., 2021). In this section we examine how cancellation along the line of sight could affect the measured polarization angle dispersion, and provide a way to correct for such effect numerically as an extension to the DCF coefficient.


Because of the integration along the line of sight, the observed angle dispersion of the projected 2D map could differ from the actual angle dispersion in the 3D space. To quantitatively investigate the difference between these two measurements, we designed a numerical test, illustrated in Figure 14. We first generate a set of 2D angles to fill in a 3D cube with size . These angles represent the direction of unit vectors on the plane (plane of sky) in each cell. Note that we ignored the density-dependent weighting (thus unit vectors) to focus on the geometric effect during the integration. We also neglected the line-of-sight (-) component of the vector for simplicity (i.e., is the 2D projection of the actual 3D vector in each cell); the projection effect for angles from 3D to 2D was discussed in Sec. 3.2.
The distribution of the generated angle follows a normal distribution centered at and with FWHM equal to two times of the chosen dispersion of in the cube, . After assigning to each cell to have a 3D array , we can now calculate the polarization angle for each column (line of sight) following the general equations of synthetic polarization:
| (42) |
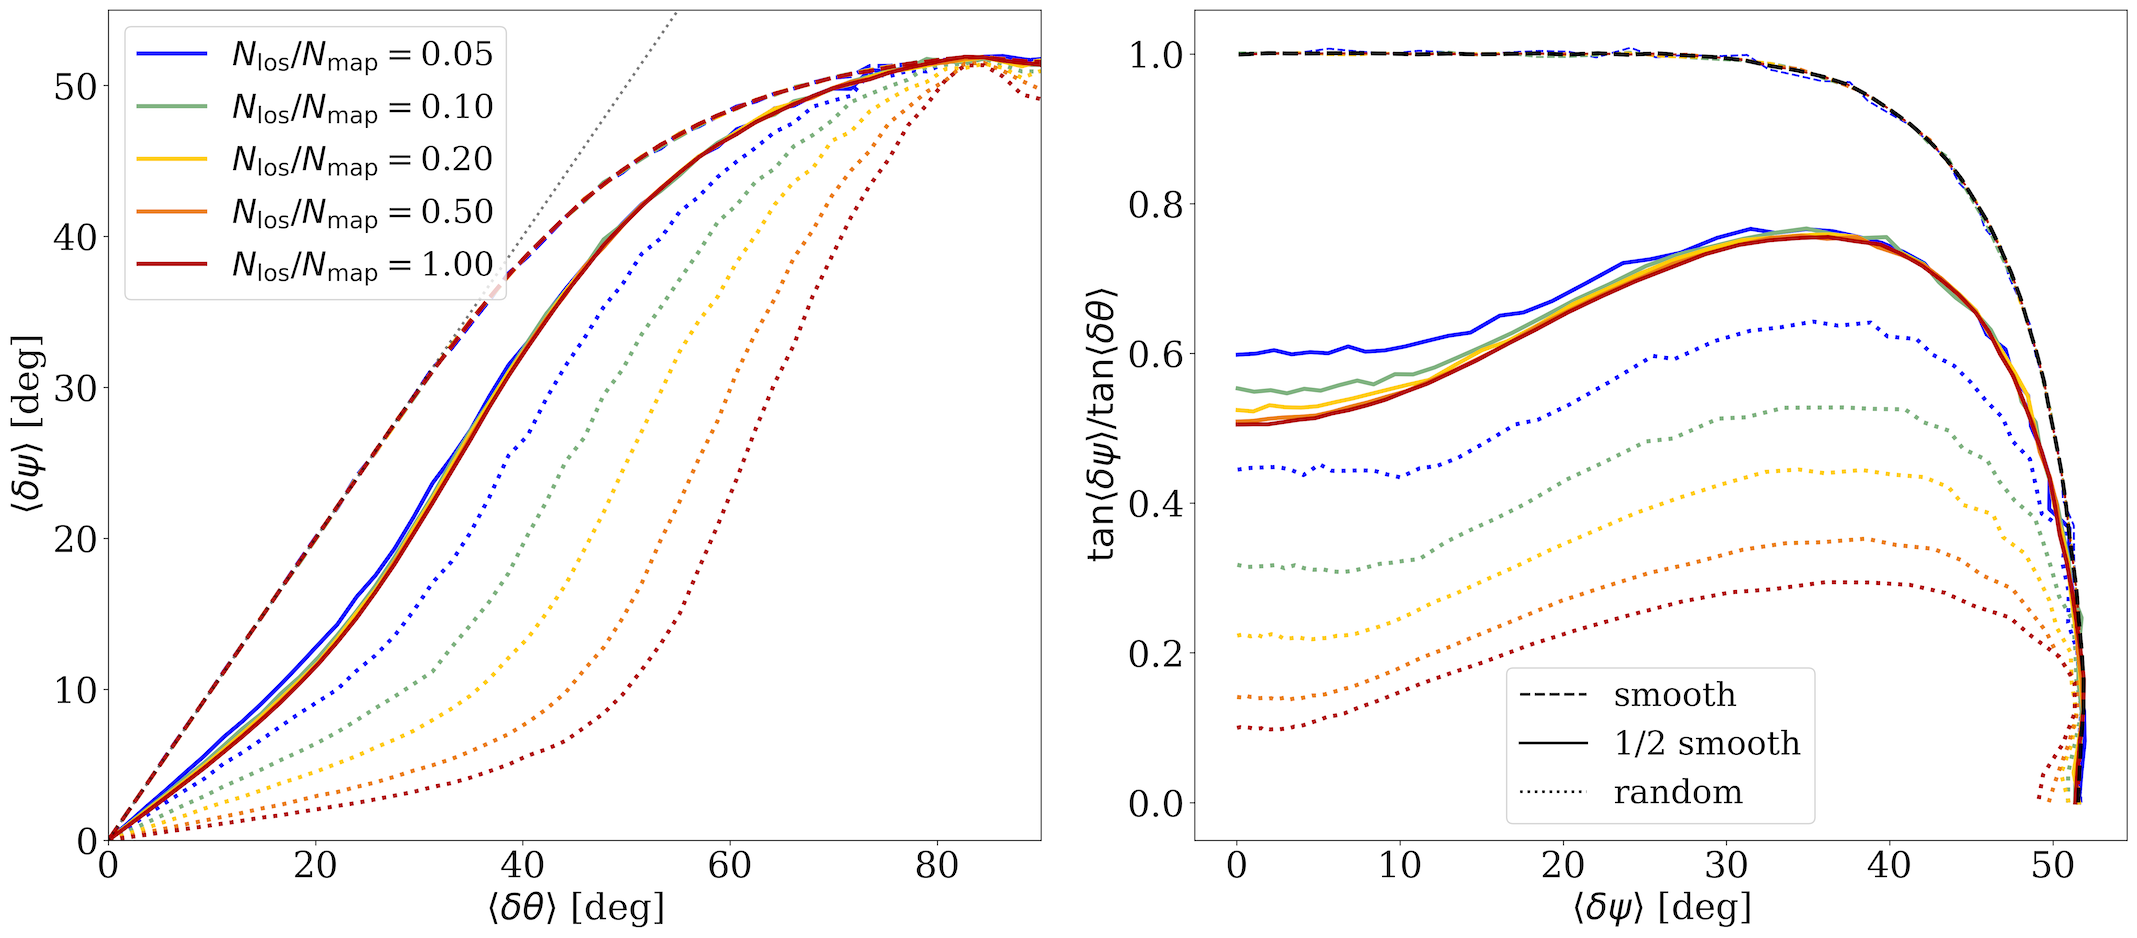
The dispersion of polarization angle can then be derived from the distribution of . The relation between and is illustrated in Figure 15, which plots the distributions of over the plane under three different cases of assignment. For the case ‘random’, is randomly assigned in the box, and thus has the most significant cancellation when integrated along the line of sight. The case ‘smooth’ represent the case when the dataset is sorted before assigning to cells; i.e., the difference in along each sightline is minimum. For the ‘1/2 smooth’ case, we randomly assigned half of the dataset but sorted the other half before assigning them to individual cells (also see Fig. 14 for illustration). Not surprisingly, Fig. 15 suggests that the ‘smooth’ case best recovers the actual dispersion values unless the real field is really disturbed (large , while the case of ‘random’ does not seem to be a good approximation even when the angle dispersion is really small.
The correlation between the projected dispersion, , and the dispersion of the whole cube, , is plotted in the left panel of Figure 16, again for the three cases of assignment. In addition, we tested different numbers of pixels along the line of sight as fractions of the size of the 2D map, and as illustrated in Figure 16, the ratio does not have huge impact except for the case where the angles are completely random, which rarely happens in the real world. Also note that Figure 16 confirms numerically that the maximum possible value of the measured angle dispersion is , as pointed out in Planck Collaboration XIX (2015).
Our results demonstrate that the projected dispersion is always smaller than the actual dispersion in the cube, which is consistent with what has been suggested due to the cancellation effect along the line of sight (see e.g., Ostriker, 2003). Moreover, we can use this numerical test to estimate the corresponding DCF coefficient . Assuming holds,777We note that though we propose to replace (or ) with (or ) to increase the accuracy of the DCF method, as we discussed in Sec. 2.4, our results in Sec. 4.1 and 4.2 show that this modification is not critical. We therefore still use the tangent ratio of the polarization angle dispersion for the DCF coefficient. we have
| (43) |
This ratio is plotted in Figure 16 (right panel) as a function of the observed angle dispersion on the plane of sky . Considering the case of ‘1/2 smooth’ (the most realistic assumption among the three considered here), this shows that if is used in the DCF method instead of , the correction factor is - for small angles. This is indeed in good agreement with Ostriker et al. (2001), who suggested that for polarization dispersion .
We note that our numerical test discussed here is similar to the analytical models examined by Myers & Goodman (1991), who also investigated the distribution of angles after integration along the line of sight. Also, the modified DCF method using the structure functions of the polarization angles (Hildebrand et al., 2009; Houde et al., 2009) also aims at resolving the cancellation effect along the line of sight due to integration. Hildebrand et al. (2009) and Houde et al. (2009) attribute the dispersion of polarization angles to the existence of multiple turbulent cells along the line of sight, which is conceptually similar to our numerical tests: sightlines with more turbulent cells are more similar to the ‘random’ assignment case (see Fig. 14) and would have more severe cancellation effect, thus require a correction coefficient further away from 1 (see Fig. 16), consistent with the method proposed in Hildebrand et al. (2009) and Houde et al. (2009) on estimating the ratio between the turbulent component of the magnetic field to the ordered field. Further discussion on comparisons between the various modifications of the DCF method will be presented in a separate publication (J. Park et al., in prep.).
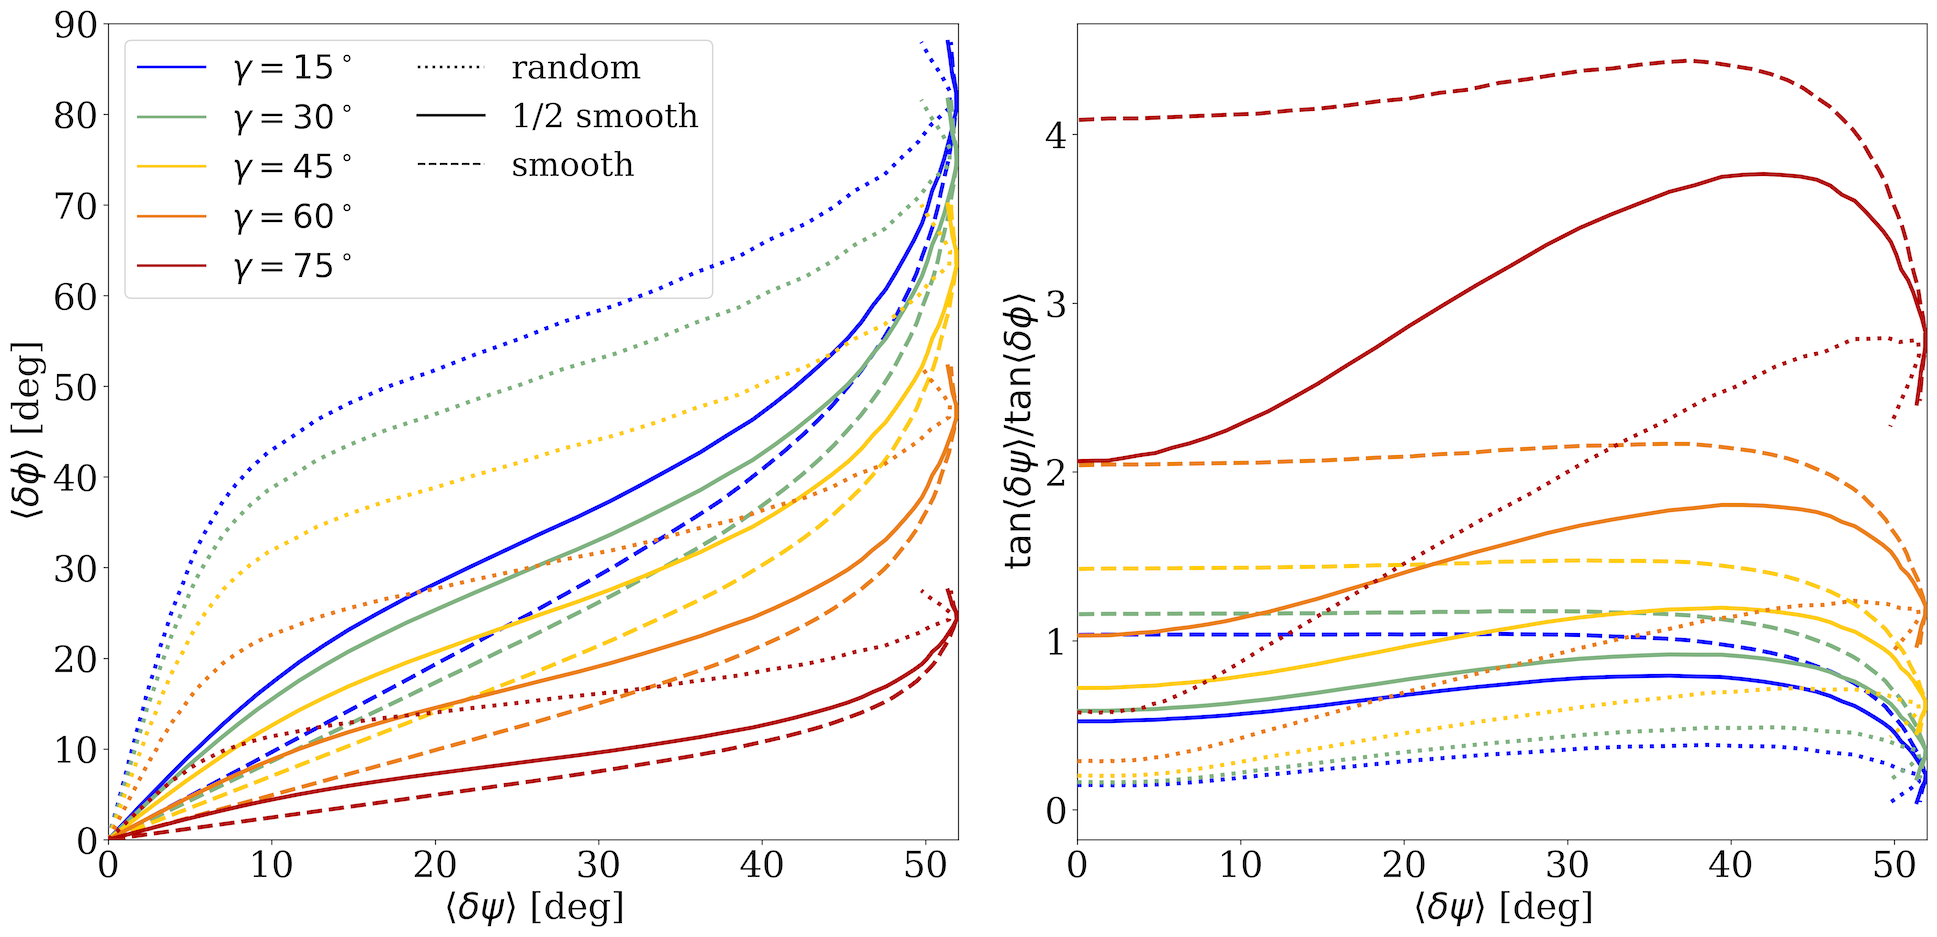
For completeness, we combine the cancellation effect from integration discussed in this section with the projection effect discussed in Sec. 3.2 to provide the total geometrical correction for the DCF method, summarized in Figure 17. The plot shows the correlation between the measured dispersion on the plane-of-sky and the actual angle dispersion of the 3D system (left panel), and the corresponding DCF coefficient (right panel), for the three cases of angle arrangement (dotted, solid, and dashed lines represent the case of random, half-random, and smooth arrangement, respectively) and various inclination angles . Note that since the ratio (i.e., the cloud depth relative to the cloud size) does not have a significant impact on the projection and integration effects (unless the angle arrangement is completely random in space), we only plotted the case here.
Figure 17 thus provides a guideline for better estimates of magnetic field strengths using the DCF method with the mean dispersion of polarization angles . Note that, unlike the results in Fig. 16 with plane-of-sky angles only, utilizing Fig. 17 requires knowing the inclination angle of the magnetic field with respect to the plane of sky, , which can be estimated from the probability distribution function of the observed polarization fraction over the targeted region, as proposed by Chen et al. (2019). Also, though we plotted the three cases of possible magnetic field morphology (different arrangements of in our numerical test) along the line of sight, we note that the ‘smooth’ case (dashed lines) should only be considered when the measured is very small, presumably . Similarly, the case of completely random arrangement of angles (dotted lines) is unlikely to happen in the real world, and should only be considered if is closer to the maximum value . The ‘1/2 smooth’ case (solid lines) is the most appropriate assumption that one should consider adopting when estimating the 3D correction factor (; right panel of Fig. 17) of the DCF analysis.
Nevertheless, we note that the correction factor, or the DCF coefficient , is only applicable when considering the dispersion of polarization angle in the DCF analysis. This is in fact opposite to what we proposed in Sec. 2.4 that one should consider instead of , which we showed in Sec. 4.1 to be more accurate on estimating the field strength. We therefore conclude that one should always consider using in the DCF analysis, and only refer to the correction factor or when the statistics is not good enough to have a log-normal-shaped distribution of the DCF-derived field.
6 Summary and Conclusions
We re-visited the well-known DCF method on deriving magnetic field strength using observed information. Using 3D MHD simulations of star-forming clouds, we tested the fundamental assumption of the DCF method, that the turbulent gas motion is solely responsible for the distortion of the magnetic field morphology, and thus any deviation of the magnetic field from the unperturbed state can be related to the gas velocity through the Alfvén wave equation, . While we found that a uniform, unperturbed field did not exist in simulated clouds nor did the strict relation between gas velocity and magnetic field strength, we were able to find a good substitute of the unperturbed field direction: the vector-averaged magnetic field. Using the vector-averaged magnetic field as the reference direction, the ratio between the ‘perturbed’ components (i.e., perpendicular to the reference field) of gas kinetic energy and magnetic energy becomes a roughly normal distribution in the log space with the peak around unity. This statistical equipartition between and is the key for the DCF method to work with data in the real 3D space.
To extend our analysis to observations, we examined the discrepancies between 3D and 2D systems, and proposed several modifications to the original DCF method. These modified DCF methods were then tested using synthetic observations generated from the aforementioned simulations. Based on our results, we conclude the best practice of the DCF analysis is the following:
-
•
Instead of calculating the DCF-derived field strength using the dispersion of polarization angle and the mean density and velocity dispersion as , we propose to calculate everywhere on the plane of sky and use the distribution of in log space to find the field strength , which is the location of the peak, or the most probable value of (see Sec. 2.4 and Figs. 35).
-
•
The measurement of gas velocity dispersion seems to be critical in the DCF analysis, especially since it can be used in deriving the depth of the cloud and hence the volume density, another essential source of uncertainty in the DCF analysis (see Sec. 4.1). However, the velocity dispersion traced by different molecular tracers could be different (see Table 3), and our results suggest that the low- to intermediate-density ( cm-3) tracers are preferred here (see Fig. 10). We note that this is the density range that traces the cloud to core transition (see e.g., Chen & Ostriker, 2015), hence could provide more accurate estimates on the turbulence level of the star-forming gas (see Sec. 4.2).
-
•
When considering the gas volume density used in the DCF analysis, we recommend to use either the velocity fitting method (Sec. 3.3.1) or the equilibrium layer method (Sec. 3.3.2) to derive the characteristic depth of the cloud (see Fig. 12 and Table 2), assuming the region of interest can be considered to be locally flattened. For the DCF method to work, the gas volume density must be derived from a tracer that is corresponding to the gas traced by polarization measurement, and thus the low- to intermediate-density ( cm-3) tracers are again the preferred choices (also see Sec. 3.4).
-
•
If possible, we recommend using the method proposed in Chen et al. (2019) to estimate the mean inclination angle of the magnetic field with respect to the plane of sky, . If (and only if) is large (), one should consider including the projection correction described in Sec. 3.2 in the DCF analysis by replacing with using Eq. (39), and switching to to only include the component perpendicular to the inclined magnetic field. The projection effect is minor in most of the cases, but could become critical when the magnetic field is far away from the plane of sky (see Sec. 4.1).
-
•
The ‘traditional’ DCF method, , is only recommended when good statistics on is not available, i.e., when the distribution of is far off from a log-normal shape. In this case, one should estimate the correction factor using Fig. 16 to get a better approximation of the field strength as . The projection effect should be considered (Fig. 17) only when the mean inclination angle of the magnetic field is large.
To conclude, good statistics is critical to the DCF analysis, and the biggest uncertainty of the DCF-derived magnetic field strength is actually from the velocity dispersion measurement (especially if the gas volume density is determined using the velocity information), not polarization observation. This explains why neither of our proposed modifications, and adopting a polarization fraction mask , has significant impact on the accuracy of the derived magnetic field strength. Nevertheless, our modified DCF analysis should be able to provide estimates of the magnetic field strength within roughly a factor of 2 in typical star-forming clouds except the extreme cases (highly turbulent, large inclination angle, etc.).
Acknowledgements
We thank the referee for a constructive and thorough report, and Christopher McKee for productive discussions. C-YC and Z-YL acknowledge support from NSF grant AST1815784. ZYL is supported in part by NASA 80NSSC18K1095. RRM acknowledges support from SOFIA grant 07-0235 and NASA 80NSSC18K0481. This research made use of astrodendro, a Python package to compute dendrograms of Astronomical data (http://www.dendrograms.org/). This work was performed under the auspices of the U.S. Department of Energy (DOE) by Lawrence Livermore National Laboratory under Contract DE-AC52-07NA27344 (C.-Y.C and R.I.K.). LLNL-JRNL-832240-DRAFT
Data Availability
The simulations used in this work were previously reported in Chen et al. (2016); Chen et al. (2019); King et al. (2018, 2019). No new data were generated in support of this research. The simulation and synthetic observation data underlying this article will be shared on reasonable request to the corresponding author.
References
- Beattie et al. (2022) Beattie J. R., Krumholz M. R., Skalidis R., Federrath C., Seta A., Crocker R. M., Mocz P., Kriel N., 2022, arXiv e-prints, p. arXiv:2202.13020
- Chandrasekhar & Fermi (1953) Chandrasekhar S., Fermi E., 1953, ApJ, 118, 113
- Chen & Ostriker (2014) Chen C.-Y., Ostriker E. C., 2014, ApJ, 785, 69
- Chen & Ostriker (2015) Chen C.-Y., Ostriker E. C., 2015, ApJ, 810, 126
- Chen et al. (2016) Chen C.-Y., King P. K., Li Z.-Y., 2016, ApJ, 829, 84
- Chen et al. (2019) Chen C.-Y., King P. K., Li Z.-Y., Fissel L. M., Mazzei R. R., 2019, MNRAS, 485, 3499
- Cho (2019) Cho J., 2019, ApJ, 874, 75
- Cho & Yoo (2016) Cho J., Yoo H., 2016, ApJ, 821, 21
- Crutcher (2012) Crutcher R. M., 2012, ARA&A, 50, 29
- Crutcher et al. (2010) Crutcher R. M., Wandelt B., Heiles C., Falgarone E., Troland T. H., 2010, ApJ, 725, 466
- Davis (1951) Davis L., 1951, Physical Review, 81, 890
- Davis & Greenstein (1951) Davis Leverett J., Greenstein J. L., 1951, ApJ, 114, 206
- Elmegreen & Elmegreen (1978) Elmegreen B. G., Elmegreen D. M., 1978, ApJ, 220, 1051
- Falceta-Gonçalves et al. (2008) Falceta-Gonçalves D., Lazarian A., Kowal G., 2008, ApJ, 679, 537
- Falgarone et al. (2008) Falgarone E., Troland T. H., Crutcher R. M., Paubert G., 2008, A&A, 487, 247
- Fiege & Pudritz (2000) Fiege J. D., Pudritz R. E., 2000, ApJ, 544, 830
- Fissel et al. (2016) Fissel L. M., et al., 2016, ApJ, 824, 134
- Fissel et al. (2019) Fissel L. M., et al., 2019, ApJ, 878, 110
- Girart et al. (2006) Girart J. M., Rao R., Marrone D. P., 2006, Science, 313, 812
- Harper et al. (2018) Harper D. A., et al., 2018, Journal of Astronomical Instrumentation, 7, 1840008
- Heitsch et al. (2001) Heitsch F., Zweibel E. G., Mac Low M.-M., Li P., Norman M. L., 2001, ApJ, 561, 800
- Hildebrand et al. (2009) Hildebrand R. H., Kirby L., Dotson J. L., Houde M., Vaillancourt J. E., 2009, ApJ, 696, 567
- Houde et al. (2009) Houde M., Vaillancourt J. E., Hildebrand R. H., Chitsazzadeh S., Kirby L., 2009, ApJ, 706, 1504
- Hull et al. (2013) Hull C. L. H., et al., 2013, ApJ, 768, 159
- King et al. (2018) King P. K., Fissel L. M., Chen C.-Y., Li Z.-Y., 2018, MNRAS, 474, 5122
- King et al. (2019) King P. K., Chen C.-Y., Fissel L. M., Li Z.-Y., 2019, MNRAS, 490, 2760
- Kwon et al. (2019) Kwon W., Stephens I. W., Tobin J. J., Looney L. W., Li Z.-Y., van der Tak F. F. S., Crutcher R. M., 2019, ApJ, 879, 25
- Lazarian (2007) Lazarian A., 2007, J. Quant. Spectrosc. Radiative Transfer, 106, 225
- Lee & Draine (1985) Lee H. M., Draine B. T., 1985, ApJ, 290, 211
- Li et al. (2021) Li P. S., Lopez-Rodriguez E., Ajeddig H., André P., McKee C. F., Rho J., Klein R. I., 2021, MNRAS,
- Liu et al. (2021) Liu J., Zhang Q., Commerçon B., Valdivia V., Maury A., Qiu K., 2021, ApJ, 919, 79
- McKee & Ostriker (2007) McKee C. F., Ostriker E. C., 2007, ARA&A, 45, 565
- McKee et al. (1993) McKee C. F., Zweibel E. G., Goodman A. A., Heiles C., 1993, in Levy E. H., Lunine J. I., eds, Protostars and Planets III. p. 327
- Myers & Goodman (1991) Myers P. C., Goodman A. A., 1991, ApJ, 373, 509
- Ostriker (2003) Ostriker E. C., 2003, Developing Diagnostics of Molecular Clouds Using Numerical MHD Simulations. pp 252–270
- Ostriker et al. (2001) Ostriker E. C., Stone J. M., Gammie C. F., 2001, ApJ, 546, 980
- Padoan et al. (2001) Padoan P., Goodman A., Draine B. T., Juvela M., Nordlund Å., Rögnvaldsson Ö. E., 2001, ApJ, 559, 1005
- Pattle et al. (2017) Pattle K., et al., 2017, ApJ, 846, 122
- Pillai et al. (2015) Pillai T., Kauffmann J., Tan J. C., Goldsmith P. F., Carey S. J., Menten K. M., 2015, ApJ, 799, 74
- Planck Collaboration XIX (2015) Planck Collaboration XIX 2015, A&A, 576, A104
- Planck Collaboration XXXV (2016) Planck Collaboration XXXV 2016, A&A, 586, A138
- Shirley (2015) Shirley Y. L., 2015, PASP, 127, 299
- Skalidis & Tassis (2021) Skalidis R., Tassis K., 2021, A&A, 647, A186
- Skalidis et al. (2021) Skalidis R., Sternberg J., Beattie J. R., Pavlidou V., Tassis K., 2021, A&A, 656, A118
- Soler et al. (2013) Soler J. D., Hennebelle P., Martin P. G., Miville-Deschênes M. A., Netterfield C. B., Fissel L. M., 2013, ApJ, 774, 128
- Stephens et al. (2014) Stephens I. W., et al., 2014, Nature, 514, 597
- Storm et al. (2014) Storm S., et al., 2014, ApJ, 794, 165
- Sullivan et al. (2021) Sullivan C. H., Fissel L. M., King P. K., Chen C. Y., Li Z. Y., Soler J. D., 2021, MNRAS, 503, 5006
- Troland & Crutcher (2008) Troland T. H., Crutcher R. M., 2008, ApJ, 680, 457
- Ward-Thompson et al. (2017) Ward-Thompson D., et al., 2017, ApJ, 842, 66
- Wardle & Konigl (1990) Wardle M., Konigl A., 1990, ApJ, 362, 120
- Zweibel (1990) Zweibel E. G., 1990, ApJ, 362, 545