REDISCUSSION OF ECLIPSING BINARIES. PAPER IX.
THE SOLAR-TYPE SYSTEM KIC 5359678
By John Southworth
Astrophysics Group, Keele University, Staffordshire, ST5 5BG, UK
KIC 5359678 is a 6.231-d period F-type eclipsing binary system whose component stars both show starspot activity. It was observed by the Kepler satellite in long cadence for the full four-year duration of the mission. Wang et al. 1 obtained radial velocity measurements of the two stars and analysed these plus the Kepler data to study their spot activity and measure their physical properties, but left several questions unanswered. We have performed an independent analysis and determined the masses ( and ) and radii ( and ) of the stars to high precision. The distance we find to the system is slightly shorter than that from Gaia EDR3 for unknown reason(s). We also investigated the precision of the numerical integration applied to the model light curve to match the 1765-s sampling cadence of the Kepler observations. We found that ignoring this temporal smearing leads to biased radius measurements for the stars: that for the primary is too small by 4 and that for the secondary is too large by 10. Doubling the sampling rate of the model light curve is sufficient to remove most of this bias, but for precise results a minimum of five samples per observed datapoint is required.
Introduction
Detached eclipsing binaries (dEBs) are crucial to stellar physics because the properties of their component stars can be measured directly from observed light and radial velocity (RV) curves 2; 3. These direct measurements can then be used to constrain and to calibrate theoretical models of stellar evolution 4; 5; 6. Many thousands of dEBs are now known 7; 8; 9; 10. Particularly important contributions to the numbers of dEBs for which good light curves are available have recently been made by space missions such as CoRoT 11, Kepler 12 and TESS 13; 14; 15. An extensive review of the impact of space photometry on binary star science can be found in Southworth 16.
KIC 5359678 was found to be a dEB using data from the Kepler satellite 12; 17; 18; 19 with a morphology value of 0.27 which indicates that it is well-detached 20. Armstrong et al. 21 determined effective temperature () values for the two components of K and K. Qian et al. 22 determined the of the system to be K and its spectral type to be F5 from a medium-resolution () spectrum obtained using the LAMOST spectroscopic telescope 23 survey of the Kepler field 24.
Wang et al. 1 (hereafter W21) presented a detailed study of KIC 5359678 which concentrated on the characteristics of the starspots on the stellar surfaces. To determine the physical properties of the stars, W21 modelled the light curve from the Kepler satellite together with RVs from a set of 58 medium-resolution () LAMOST spectra 25 using the phoebe2 code 26. They gave two sets of physical properties for the system, for eccentric and circular orbits, which are formally identical but with errorbars differing by as much as a factor of three. They also quoted no errorbar for the mass of the secondary star, and did not mention whether they accounted for the cadence of the observations obtained by the Kepler satellite. For these reasons, and to see if the properties of the system can be established to a precision of 2% or better 2; 27, we present below a reanalysis of KIC 5359678. Basic information on the system is summarised in Table I.
| Property | Value | Reference |
| Kepler Input Catalog designation | KIC 5359678 | 28 |
| Kepler Object of Interest designation | KOI 6569 | 29 and updates |
| Gaia EDR3 designation | 2101510803402761344 | 30 |
| Gaia EDR3 parallax | mas | 30 |
| magnitude | 31 | |
| magnitude | 31 | |
| magnitude | 32 | |
| magnitude | 32 | |
| Spectral type | F5 | 1 |
Observational material
The Kepler satellite is a 0.95 m Schmidt reflecting telescope with a focal plane contining 42 CCDs, launched by NASA in March 2009 and placed into an Earth-trailing heliocentric orbit 33; 34. Its mission was to obtain photometric observations of a single patch of sky (the Kepler Field) for four years in order to find transits of extrasolar planets. Due to a limit on the amount of data that could be returned to Earth, Kepler could only be used to observe 170 000 objects simultaneously. Consecutive observations were summed into single “long cadence” observations with an effective duration of 1765.5 s, and the count rates of pixels in the region of selected targets were transmitted to Earth. A subset of 512 of these targets could be observed in “short cadence”, where individual observations were summed into data with an effective duration of 58.8 s. Kepler observations were divided into quarters (three months) due to the rotation of the spacecraft around its optical axis to keep its solar panels illuminated by the Sun. These data were reduced by the Kepler mission Science Operations Center (SOC) 35.

KIC 5359678 was observed for the entirety of the Kepler mission, from quarters Q0 to Q17, in long cadence. The first datapoint was taken on 2009/05/13 and the last on 2013/05/11. Small gaps occured within this time interval when Kepler paused observations for technical reasons or to transmit data to Earth. The data were downloaded from the MAST archive***Mikulski Archive for Space Telescopes,
https://mast.stsci.edu/portal/Mashup/Clients/Mast/Portal.html and converted to relative magnitude. Rejection of unreliable data (typically represented by “Inf” or “Nan”) left 64 073 measurements. We chose to work with the standard aperture photometry (SAP) rather than the pre-search data conditioning (PDC) data, after verifying that the differences were negligible for our purposes. An example light curve, chosen at random to be from Q10, is shown in Fig. 1.
Analysis of the Kepler light curve

The majority of the photometric observations occur outside eclipse, so hold negligible information on the physical properties of the stars. The starspot variation also affects the brightness of the system during eclipse but occurs on much longer timescales. We tackled both problems by extracting the data around each eclipse from the overall light curve, fitting a polynomial to the out-of-eclipse data, and subtracting the polynomial (in magnitude units) to remove the slow variations due to starspots and instrumental effects. All eclipses were manually inspected and those with insufficient data either before or after, or with more than two datapoints missing, were rejected. This left a total of 8106 observations with the main effects of spot activity removed (Fig. 2).
We then proceeded to analyse the data with version 41 of the jktebop†††http://www.astro.keele.ac.uk/jkt/codes/jktebop.html code 36; 37. Fitted parameters included the sum and ratio of the fractional radii ( and where , , and are the radii of the stars, and is the semimajor axis of the relative orbit), the orbital inclination () and period (), a reference time of primary minimum (; when star A is eclipsed by star B), and the central surface brightness ratio of the two stars ().
For limb darkening (LD) we adopted the quadratic law, fitted the linear coefficient for each star ( and ) and fixed the quadratic coefficients ( and ) to theoeretical values from Sing 38. We found third light to be very small so fixed it at zero. One important consideration is the long sampling cadence – one observation every 1765 s – and we accounted for that by numerically integrating the model light curve to match the observed one 39.
We obtained solutions for a circular and an eccentric orbit. In the latter case we fitted for and where is the orbital eccentricity and is the argument of periastron. In both cases we included the RV measurements of the two stars published by W21 in order to measure the masses and radii of the stars. The errorbars on the three datasets (light curve, RVs of star A, RVs of star B) were each scaled to give a reduced of for that dataset.
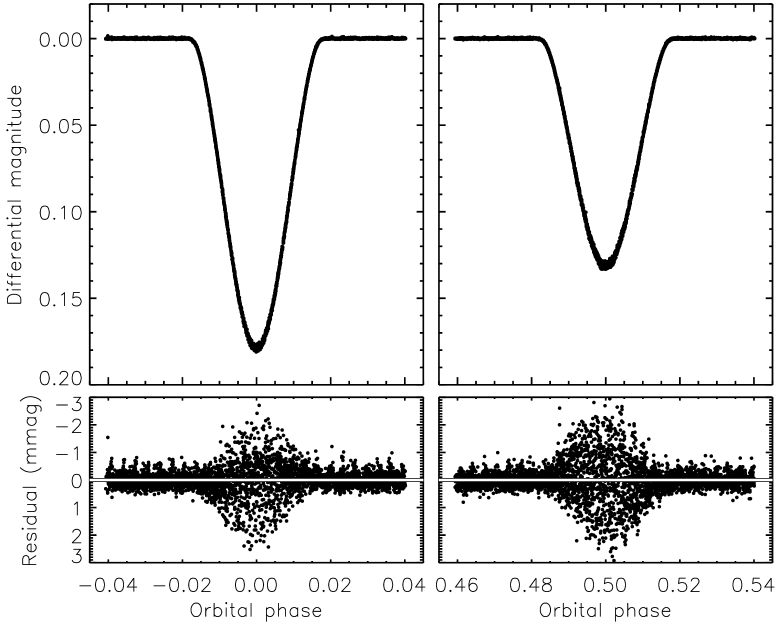
The best fit to the light curve for the circular orbit can been seen in Fig. 2. The residuals in this figure show systematic trends with time which occur because our approach to dealing with the spot activity does not account for the partial obscuration of spots during eclipses. Our best fit therefore systematically over- or under-predicts the eclipse depth in a way which changes on a characteristic timescale of approximately 200 days. This is much longer than the rotation period or the timescale over which individual starspots appear and disappear (see Fig. 1), but is much shorter than the time interval covered by the data.
Another visualisation of the situation is shown in Fig. 3, where the data have been converted into orbital phase and shown in close-up around the eclipses. The best fit is clearly a good representation of the data, but the residuals significantly increase during both eclipses. As changes in eclipse depth are driven primarily by spots on the surface of the eclipsed star, this tells us that both stars show spot activity and that their activity levels are comparable.
| Parameter | Circular orbit | Eccentric orbit |
|---|---|---|
| Fitted parameters: | ||
| Primary eclipse (BJD/TDB) | 2455402.266750.00002 | 2455402.266700.00002 |
| Orbital period (d) | 6.230609940.00000024 | 6.230609910.00000028 |
| Orbital inclination (∘) | ||
| Sum of the fractional radii | ||
| Ratio of the radii | ||
| Central surface brightness ratio | ||
| Third light | 0.0 (fixed) | 0.0 (fixed) |
| Linear LD coefficient star A | ||
| Linear LD coefficient star B | ||
| Quadratic LD coefficient star A | 0.31 (fixed) | 0.31 (fixed) |
| Quadratic LD coefficient star B | 0.29 (fixed) | 0.29 (fixed) |
| 0.0 (fixed) | ||
| 0.0 (fixed) | ||
| Velocity amplitude star A ( km s-1) | ||
| Velocity amplitude star B ( km s-1) | ||
| Systemic velocity star A ( km s-1) | ||
| Systemic velocity star B ( km s-1) | ||
| Derived parameters: | ||
| Fractional radius of star A | ||
| Fractional radius of star B | ||
| Orbital eccentricity | 0.0 (fixed) | |
| Argument of periastron (∘) | n/a | |
| Light ratio |
The uncertainties in the fitted and derived parameters were estimated using Monte Carlo and residual-permutation simulations 36; 40. The Monte Carlo algorithm requires the data errors to be of a correct size, which was achieved by the scaling to force . The residual-permutation algorithm successively shifts the residuals of the best fit along the data strings before refitting, so is by design sensitive to red noise and eclipse depth variations. The larger of the two errorbars was adopted for each parameter. Table II gives the best-fitting parameters and their uncertainties for modelling runs assuming a circular or an eccentric orbit. Fig. 4 shows the RVs and the fitted circular orbits. The parameter values for the circular- and eccentric-orbit cases are almost identical, and their errorbars are similar, so we adopt the circular orbit as our final result. Inspection of the Monte Carlo and residual-permutation results shows that there is a very strong correlation between the ratio of the radii and the light ratio of the system, as is normally seen in cases where eclipses are shallow and partial (e.g. V455 Aur 41). The radius measurements could be improved by obtaining a spectroscopic light ratio, although this will need a large telescope given the relative faintness of KIC 5359678.

How much numerical integration is needed?
The Kepler long-cadence light curve of KIC 5359678 is sampled at a cadence of s (Borucki 34) so each eclipse of this EB is covered by only nine or ten datapoints. It is therefore important to account for this when fitting the data, by numerically integrating the model light curve. The method implemented in jktebop is to divide each datapoint up into time intervals of equal duration , calculate the model light curve at the midpoint of each time interval, and then take the mean of the fluxes as the predicted value for that datapoint 39. An obvious question is: what is a suitable value of ? Smaller values risk undersampling the light curve and biasing the best-fitting parameters, whereas larger values take proportionally more computing time. A value of was used in the jktebop analysis above.

We therefore ran a set of solutions of the Kepler light curve (eclipses only) with running from one (equivalent to no numerical integration) to nine (the value used for the main analysis). The results are shown in Fig. 5 for the radii of the stars, in the expectation that these are the properties whose measurement is most affected by the sampling rate of the observations. It can be seen that ignoring numerical integration leads to results that are very biased: is too small by 4.1 and is too large by 10.6. This arises because the smearing of the eclipse shape is best matched using a larger and a slightly smaller . Using immediately leads to a big improvement in the results, and is sufficient to bring both radius measurements within the errorbars of the final result. Larger values of , perhaps 5 or 8 depending on one’s science goals, are needed to measure reliable parameter values. However, the errorbars are reliably measured for much coarser sampling: . It is therefore acceptable to measure parameter values with a larger , but then run the error analysis algorithms with a lower to save computing time.
These conclusions are specific to KIC 5359678 but are likely to hold for most EBs with eclipses of similar duration. They are comparable to what Southworth 39 found for the synthetic light curve of a transiting extrasolar planetary system resembling Kepler-6. Similar conclusions were also reached by Kipping 42. The most important point is that if the data have been temporally averaged then the model one fits to it must be treated in the same way.
Physical properties of KIC 5359678
To determine the physical properties of the KIC 5359678 system we used the values and uncertainties of , , , , and from Table II. The calculations were performed with the jktabsdim code 43, which calculates the physical properties using standard formulae and propagates uncertainties via perturbation. We adopted the values of the stars from W21, but increased the errorbar for star B because the quoted value is measured relative to the of star A so therefore should include its uncertainty. The ratio of the s is consistent with the surface brightness ratio measured from the light curve (Table II). The results are given in Table III.
To determine the distance to the system we used its apparent magnitudes in and from APASS DR9 and in and from 2MASS (see Table I); the 2MASS magnitude is unreliable 32. The interstellar extinction was estimated as mag obtained using the stilism‡‡‡https://stilism.obspm.fr online tool (Lallement et al. 44; 45). Its distance of pc was calculated using the surface brightness method from Southworth et al. 43 and the -band surface brightness calibrations from Kervella et al. 46. This is significantly smaller than the distance of pc from the parallax of the system in Gaia EDR3 30.
We are unable to deduce the reason why our distance is discrepant with that from Gaia. The 2MASS apparent magnitudes are single-epoch so may have been obtained at a time of particularly strong starspot activity – we have no data available to provide an independent cross-check but the required change of approximately mag in is much larger than the brightness modulation due to starspot activity seen in Fig. 1. The 2MASS observations were taken at phase based on our ephemeris in Table II, which is close to but confidently outside primary eclipse (see Fig. 3). The APASS magnitudes come from six epochs so are very unlikely to be made significantly fainter by eclipses. A larger set of values allied with stronger reddening also requires implausible changes – increases of 1300 K in both s and 0.23 mag in – to fix the discrepancy. Stellar radii larger by 5% would also be sufficient, but far beyond our 1 errorbars in Table III and significantly greater than those found by W21. We leave this mystery for future study.
| Parameter | Star A | Star B | ||
| Mass ratio | ||||
| Semimajor axis of relative orbit () | ||||
| Mass () | 1.252 | 0.018 | 1.065 | 0.013 |
| Radius () | 1.449 | 0.012 | 1.048 | 0.017 |
| Surface gravity ([cgs]) | 4.214 | 0.007 | 4.424 | 0.013 |
| Density () | 0.412 | 0.009 | 0.924 | 0.043 |
| Synchronous rotational velocity ( km s-1) | 11.76 | 0.10 | 8.51 | 0.14 |
| Effective temperature (K) | 6500 | 50 | 5980 | 70 |
| Luminosity | 0.555 | 0.014 | 0.103 | 0.025 |
| (mag) | 3.353 | 0.037 | 4.483 | 0.061 |
| Distance (pc) | ||||
Summary and conclusions
KIC 5359678 is a dEB containing two F-type stars that both show brightness variations due to starspots. We have extracted the data around eclipse from the light curve of this system obtained using the Kepler satellite and fitted them with jktebop to determine the photometric properties of the system. Numerical integration was used to account for the low sampling rate of the Kepler long-cadence data. We included published RVs for the two stars to determine their masses and radii. With the inclusion of spectroscopic measurements of the s of the two stars, we determined their luminosities and the distance to the system. The distance measurement is slightly shorter than that from Gaia EDR3 – at the level of 2.0 – and we have not found a good explanation for this minor discrepancy.
We investigated the amount of numerical integration needed to fit the Kepler data for KIC 5359678. We found that ignoring the sampling rate leads to radius measurements that are wrong by (for ) and (for ). These biases are fixed by the application of only a small amount of numerical integration to the model light curve during the fitting process: merely doubling the model sampling rate is sufficient for approximate solutions but more precision is needed for final results.
We can now turn to the original prompt of this work: the analysis of W21 presented very different errorbars for circular- and eccentric-orbit solutions; no uncertainty was given for the mass of star B; and there was no mention of the sampling cadence. For the first point, we find very similar results for the two options and adopted the circular-orbit results for our own calculations. For the second, the uncertainty in the mass of star B is 1.2%. For the third, the results of W21 are much closer to our own when we used numerical integration so we conclude that they did account for this effect in their analysis.
A wider comparison between the results of W21 (adopting the circular-orbit values) and our own shows good agreement for the radius of star B: (this work) versus (W21); but not star A: (this work) versus (W21). The reason is not clear but could be related to the different ways in which the spot activity was accounted for. Our mass measurements, though, are in unexpectedly poor accord: versus for star A, and versus 1.12 (W21, no errorbar quoted) for star B. As the mass measurements are primarily dependent on the RVs, and both studies used the same ones, it is not clear how this discrepancy could have occurred. Our results have come from extensively-tested codes and analysis methods 37; 48; 49 so should be reliable.
The final motivation for the current study was to see if the available data were sufficient to establish the masses and radii of the component stars of KIC 5359678 to 2% or better. Table III shows that it was indeed possible. This dEB has now been added to the Detached Eclipsing Binary Catalogue (DEBCat§§§https://www.astro.keele.ac.uk/jkt/debcat/, Ref. 50) and can in future be used to help calibrate theoretical models of stars with masses close to that of our Sun.
Acknowledgements
This paper includes data collected by the Kepler mission and obtained from the MAST data archive at the Space Telescope Science Institute (STScI). Funding for the Kepler mission is provided by the NASA Science Mission Directorate. STScI is operated by the Association of Universities for Research in Astronomy, Inc., under NASA contract NAS 5–26555. The following resources were used in the course of this work: the NASA Astrophysics Data System; the SIMBAD database operated at CDS, Strasbourg, France; and the ariv scientific paper preprint service operated by Cornell University.
References
- 1 J. Wang et al., MNRAS, 504, 4302, 2021.
- 2 J. Andersen, A&ARv, 3, 91, 1991.
- 3 G. Torres, J. Andersen & A. Giménez, A&ARv, 18, 67, 2010.
- 4 A. Claret & G. Torres, ApJ, 859, 100, 2018.
- 5 G. Valle et al., A&A, 615, A62, 2018.
- 6 A. Tkachenko et al., A&A, 637, A60, 2020.
- 7 C. L. Watson, A. A. Henden & A. Price, Society for Astronomical Sciences Annual Symposium, 25, 47, 2006.
- 8 N. N. Samus et al., Astronomy Reports, 61, 80, 2017.
- 9 T. Jayasinghe et al., MNRAS, 477, 3145, 2018.
- 10 H. B. Thiemann et al., MNRAS, 502, 1299, 2021.
- 11 M. Deleuil et al., A&A, 619, A97, 2018.
- 12 B. Kirk et al., AJ, 151, 68, 2016.
- 13 A. B. Justesen & S. Albrecht, ApJ, 912, 123, 2021.
- 14 L. W. IJspeert et al., A&A, 652, A120, 2021.
- 15 A. Prša et al., ApJS, in press, arXiv:2110.13382, 2021.
- 16 J. Southworth, Universe, 7, 369, 2021.
- 17 A. Prša et al., AJ, 141, 83, 2011.
- 18 R. W. Slawson et al., AJ, 142, 160, 2011.
- 19 J. Debosscher et al., A&A, 529, A89, 2011.
- 20 G. Matijevič et al., AJ, 143, 123, 2012.
- 21 D. J. Armstrong et al., MNRAS, 437, 3473, 2014.
- 22 S. B. Qian et al., ApJS, 235, 5, 2018.
- 23 X.-Q. Cui et al., Research in Astronomy and Astrophysics, 12, 1197, 2012.
- 24 P. De Cat et al., ApJS, 220, 19, 2015.
- 25 W. Zong et al., ApJS, 251, 15, 2020.
- 26 A. Prša et al., ApJS, 227, 29, 2016.
- 27 J. Southworth, The Observatory, 140, 247, 2020.
- 28 T. M. Brown et al., AJ, 142, 112, 2011.
- 29 W. J. Borucki et al., ApJ, 728, 117, 2011.
- 30 Gaia Collaboration, A&A, 649, A1, 2021.
- 31 A. A. Henden et al., in American Astronomical Society Meeting Abstracts #225, 2015, American Astronomical Society Meeting Abstracts, vol. 225, p. 336.16.
- 32 R. M. Cutri et al., 2MASS All Sky Catalogue of Point Sources (The IRSA 2MASS All-Sky Point Source Catalogue, NASA/IPAC Infrared Science Archive, Caltech, US), 2003.
- 33 W. J. Borucki et al., Science, 327, 977, 2010.
- 34 W. J. Borucki, Reports on Progress in Physics, 79, 036901, 2016.
- 35 J. M. Jenkins et al., ApJ, 713, L87, 2010.
- 36 J. Southworth, P. F. L. Maxted & B. Smalley, MNRAS, 351, 1277, 2004.
- 37 J. Southworth, A&A, 557, A119, 2013.
- 38 D. K. Sing, A&A, 510, A21, 2010.
- 39 J. Southworth, MNRAS, 417, 2166, 2011.
- 40 J. Southworth, MNRAS, 386, 1644, 2008.
- 41 J. Southworth, The Observatory, 141, 190, 2021.
- 42 D. M. Kipping, MNRAS, 408, 1758, 2010.
- 43 J. Southworth, P. F. L. Maxted & B. Smalley, A&A, 429, 645, 2005.
- 44 R. Lallement et al., A&A, 561, A91, 2014.
- 45 R. Lallement et al., A&A, 616, A132, 2018.
- 46 P. Kervella et al., A&A, 426, 297, 2004.
- 47 A. Prša et al., AJ, 152, 41, 2016.
- 48 P. F. L. Maxted et al., MNRAS, 498, 332, 2020.
- 49 J. Southworth, The Observatory, 141, 234, 2021.
- 50 J. Southworth, in Living Together: Planets, Host Stars and Binaries (S. M. Rucinski, G. Torres & M. Zejda, eds.), 2015, Astronomical Society of the Pacific Conference Series, vol. 496, p. 321.