Present address: ]Department of Physics, McGill University, Montréal, Québec, Canada H3A 2T8.
Proton capture on 30P in novae: On the existence of states at MeV and MeV in 31S
Abstract
We use a high resolution measurement to investigate the claimed existence of a 6401(3) keV state in 31S that may affect the nuclear reaction rate in oxygen-neon (ONe) novae. Our data are shown to exclude the null hypothesis - that the state does not exist - with high significance. Additionally, the data also suggest the existence of a hitherto unreported state at 6648(4) keV. This state corresponds to a resonance at keV, located below the higher edge of the Gamow window for peak nova temperatures of about 0.4 GK.
I Introduction
A current topic of interest in nuclear astrophysics is nucleosynthesis in novae José et al. (2001); José and Hernanz (2007). The latter are transient explosive phenomena that occur in binary star systems, which comprise white dwarfs and their companion main-sequence stars. In this context, observational data from space and terrestrial based telescopes Hayward et al. (1996); Snijders et al. (1987), isotopic analyses of presolar meteoritic grains Amari et al. (2001) and hydrodynamic modeling of nova explosions José et al. (1999); Iliadis et al. (2002) have played a critical role towards a better understanding of classical novae. An important ingredient in one class of nova models (ONe novae) is the nuclear reaction rate José et al. (2001). This reaction rate significantly impacts nucleosynthesis in the Si-Ca mass region José et al. (2001) and has a large uncertainty, mainly because of the present unavailability of intense 30P beams for both direct and indirect measurements. Nevertheless, despite this limitation, there has been considerable progress in constraining the reaction rate using indirect probes Budner et al. (2022); Bennett et al. (2016); Ma et al. (2007); Wrede et al. (2007, 2009); Parikh et al. (2011); Irvine et al. (2013); Kankainen et al. (2006); Bennett et al. (2018); Kankainen et al. (2017); Doherty et al. (2012, 2014); Setoodehnia et al. (2020); Jenkins et al. (2006).
Resonances in the reaction compete with 30P decay ( min) at peak nova temperatures of around – GK, thereby controlling the nucleosynthesis path towards heavier species José et al. (2001). The dominant resonances are expected to be in the range of 600 keV Jordi José (2016) above the 6131 keV proton emission threshold in 31S. This corresponds to an excitation region MeV in 31S. Consequently, there have been several experimental investigations Budner et al. (2022); Bennett et al. (2016); Ma et al. (2007); Wrede et al. (2007, 2009); Parikh et al. (2011); Irvine et al. (2013); Kankainen et al. (2006); Bennett et al. (2018); Kankainen et al. (2017); Doherty et al. (2012, 2014); Setoodehnia et al. (2020); Jenkins et al. (2006) of 31S excited states in this energy range, to indirectly determine resonance strengths to these states. Available spectroscopic information from these experiments have led to a debate about the existence of a possible state at 6.4 MeV, which may significantly contribute to the total reaction rate.
A 6400(3) keV state was first reported by Wrede et al. Wrede et al. (2007), who used a experiment. It was identified as a -wave () resonance and shown to dominate the reaction rate in the temperature range of interest. Subsequent work at the same facility reported the state at keV Wrede et al. (2009). Shortly after, Parikh et al. Parikh et al. (2011) used a higher resolution measurement to report the same level at 6403(2) keV. This was followed by a high resolution experiment Irvine et al. (2013) that confirmed its existence at 6402(2) keV. Unfortunately, the above claims were not adequately supported by a rigorous description of the statistical analyses performed on their data sets. Nevertheless, the state is now listed at keV on the Evaluated Nuclear Structure Data File (ENSDF) ens at the National Nuclear Data Center (NNDC). This corresponds to a resonance at keV.
Contrary to the above, extensive -ray spectroscopy experiments with the GAMMASPHERE and the GRETINA arrays, following the Doherty et al. (2012, 2014), Jenkins et al. (2006) and the Kankainen et al. (2017) reactions111The experiment was performed in inverse kinematics. did not show any evidence of -transitions from the claimed 6.4 MeV state. More recently, -ray spectroscopy following 31S decay Bennett et al. (2016, 2018) and independent studies Setoodehnia et al. (2020); Burcher et al. (2022) also did not confirm the existence of this level.
Motivated by these inconsistent observations and the lack of sufficient detail provided for the statistical analysis in the transfer/charge-exchange work Wrede et al. (2007, 2009); Parikh et al. (2011); Irvine et al. (2013), we investigated the relevant excitation energy region in 31S with a high resolution measurement.
II Apparatus
The experiment was performed at the Maier-Leibnitz-Laboratorium (MLL) tandem accelerator facility in Garching, Germany. Approximately 400 nA of 23 MeV deuterons were incident on an g/cm2-thick natural ZnS target, that was evaporated on an 20 g/cm2 natural carbon backing. The reaction products were momentum analyzed with the Q3D magnetic spectrograph Löffler et al. (1973); Dollinger and Faestermann (2018), whose solid angle acceptance was kept fixed at msr throughout the experiment. The focal plane detector for the spectrograph consisted of two gas proportional counters (with 500 mbar of isobutane gas) and a 7-mm-thick plastic scintillator Dollinger and Faestermann (2018). The energy losses registered in the proportional counters and the residual energy deposited in the plastic scintillator were used to discriminate the tritons from other ejectiles, while a cathode strip foil in the second proportional counter provided high-resolution position information for the tritons. Since a previous experiment at the same facility (Irvine et al. Irvine et al. (2013)) claimed a signal for the 6.4 MeV state at , we acquired data at . For comparison, additional data were also acquired at , albeit with significantly lower statistics.
III Data analysis
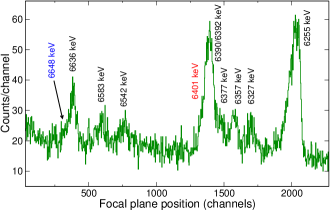
Figure 1 shows the triton spectrum from this experiment, with statistics comparable to those reported by Irvine et al. Irvine et al. (2013). The triton peaks in our data had full widths at half maximum (FWHM) of 12-15 keV, their resolution being mainly limited by the target thickness. Unlike Fig. 1, the histograms used for data analysis were not rebinned to avoid spurious binning artefacts. These had the original binning provided by the data acquisition system, with each bin corresponding to 0.35 mm in the focal plane. The spectra were analyzed assuming a model
| (1) |
for each peak. In the above, , where is the convolution of a Gaussian with a low (particle) energy exponential tail, being its relative strength with respect to the pure Gaussian, . The functional form of is described in Refs. Triambak et al. (2006a, b). contains the maximum likelihood estimators (MLEs) Glen Cowan (1998), , , and . Here, represents the peak amplitude, is its centroid, is a flat background, the peak FWHM = , and is the decay length of the exponential tail. The tail parameters, and mainly depend on the detector response function. The dispersion of the Q3D is known to change in a manner such that larger tail components are observed for higher energy particles, compared to particles with lower energy. This is evident in Fig. 1, where the 6255 keV peak with the highest triton energy has a prominently visible low-energy tail compared to the others.
In the first stage of analysis, the triton peaks were fit using a Levenberg-Marquardt algorithm Press et al. (2007), assuming that the entries in each bin () are independent and Poisson distributed. In such a scenario, one obtains the MLEs via a minimization of the quantity Baker and Cousins (1984); Zyla et al. (2020),
| (2) |
where is the likelihood ratio defined in Refs. Baker and Cousins (1984); Zyla et al. (2020). From this analysis we obtained the and MLEs for the 6255 keV peak to be about and channels, for the data set.222Similar values were obtained for the data. However, given the modest statistics in our spectra (c.f. Fig. 1), we could not fit the other peaks similarly, with the tail parameters kept free. Consequently, we used other Q3D data Rebeiro et al. (2020, 2021, 2016); Nzobadila Ondze et al. (2021); Kamil et al. (2021) to determine and for peaks in the 6400 keV region of interest (ROI). These independent data sets Rebeiro et al. (2020, 2021, 2016); Nzobadila Ondze et al. (2021); Kamil et al. (2021) showed that peaks located at about the same focal plane position required and channels to correctly describe their lineshapes. This information allowed a realistic response function to be incorporated in our analysis. The initial fits to the peaks in the spectrum were performed with the FWHM as unconstrained free parameters. This preliminary analysis provided critical guidance to proceed to the next stage. For the null hypothesis , we assume the absence of a state at 6401 keV. Although the fits yielded reasonably good agreement with the data, the extracted FWHM was 80(3) channels for the 6390/6392 keV peak333In actuality there are three closely-spaced states reported at 6390 keV Bennett et al. (2016, 2018), 6392 Doherty et al. (2012, 2014) and 6394 ens keV. A recent measurement Setoodehnia et al. (2020) did not show a strong population of the 6394 keV state. Since the other two states are only 2 keV apart and we are limited by experimental resolution, we assume a single peak in this energy region, with its centroid as a free parameter.. This is unexpectedly large, and may be compared to FWHM values of 52(10) channels and 43(3) channels for the 6357 and 6255 keV states, respectively. As we describe in greater detail below, the nearly factor-of-two larger peak width at around channel 1400 (compared to channel 2000) is contrary to expectations, given the known variation in the Q3D dispersion with particle energy. These results already suggested the possibility of an additional peak in the 6400 keV ROI.
Considering the above, a more reasonable approach would be to assume that the lineshape parameters do not vary appreciably for the three triton peaks corresponding to the 6390/6392, 6377 and 6357 keV states (c.f. Fig. 1). Based on this premise we fitted the peaks corresponding to the 6390/6392 and 6377 keV states, with their FWHM fixed at 52 channels, the MLE value for the 6357 keV peak. Next, the maximum likelihood (ML) estimation procedure was used to perform a goodness-of-fit (GOF) test, with the test-statistic being Baker and Cousins (1984), where the represent ML values of the parameters. Here again the null hypothesis assumed only two peaks (corresponding to the 6390/6392 and 6377 keV states) in the ROI. The significance of such a GOF test was obtained from its -value, the probability of obtaining data with . Under certain conditions this can be evaluated by assuming Wilks’ theorem Wilks (1938), which states that follows an asymptotic distribution, for degrees of freedom. Based on this, we obtain the null hypothesis -value to be for the data. On the other hand, including an additional peak for the 6401 keV state (the alternative hypothesis, ) yielded . This clearly showed that under the assumptions mentioned above, the null hypothesis does not adequately describe the observed data.
However, despite the seemingly plausible analysis described above, it can be critiqued that the GOF test relies heavily on the presence of a nearby high-statistics singlet peak. It is also evident that the 6357 keV peak had insufficient counts to determine its FWHM with reasonable precision, while being separated from the peak of interest by more than 100 channels. More importantly, Wilks’ theorem does not hold in scenarios when parameters are at boundary points Chernoff (1954); Self and Liang (1987) or when the model is expressed as a mixture of probability density functions (pdfs) McLachlan (1987). Due to these considerations we reanalyzed the data using a more rigorous approach, described below.
The first step was to extract a more reliable estimate of the peak FWHM parameter for the ROI. For this we resort to the other Q3D data mentioned previously Rebeiro et al. (2020, 2021, 2016); Nzobadila Ondze et al. (2021); Kamil et al. (2021), because of the dearth of high-statistics singlet peaks in our spectra. The FWHM values obtained from these independent data sets were recorded and fitted to a quadratic function to quantify the variation in peak widths with focal plane position. We find that in all data sets the peak FWHMs reduce with decreasing particle energy, by around 22-26%, in the range from 2000 channels to 200 channels. This reduction is consistent with expectations Löffler et al. (1973). Once this information was determined, we extracted the expected FWHM for the 6390/6392 keV peak, using the measured width of the 6255 keV peak as a reference. For the data, we conservatively determine this expected FWHM to be 37(6) channels. Next we fitted the peaks in the ROI using an extended maximum likelihood procedure, placing approximately confidence level (CL) constraints on the FWHM. Assuming that the FWHM parameter is normally distributed, such a scenario required a modification of Eq. (2) to
| (3) |
where is the expected value of the FWHM and is a variable within the interval . The fit results for the data are shown in the left panel of Fig. 2.
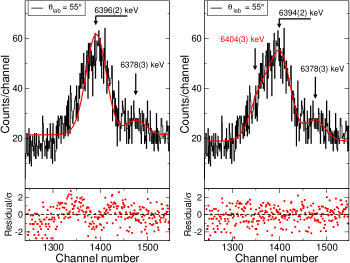
Due to the various pitfalls associated with the validity of Wilks’ theorem, we next used toy Monte Carlo simulations to generate synthetic data sets for the GOF tests. These data were used to determine the distribution of , under the assumption that was the true model to describe the data. For this scenario, the GOF analysis yielded for the data. This invalidates the null hypothesis with high significance. On repeating the analysis with an additional 6401 keV state peak within this ROI, we obtained a -value of 0.54.

Complementary to the above approach, one can alternatively (and more robustly) quantify a discovery significance for the 6401 keV state, using the test statistic Cowan et al. (2011), where is the profile likelihood ratio (LR)
| (4) |
In the above, represents the signal strength of the 6401 keV peak, and is characterized by its area. is the profile likelihood Zyla et al. (2020); Cowan et al. (2011) evaluated with , the values of that maximize the likelihood , for a specified . The denominator is the best-fit likelihood function under , with . The advantage of such a LR test is that it provides the highest power444The power of a test relates to the probability of rejecting the null-hypothesis when it is false. Neyman and Pearson (1933); Zyla et al. (2020) test of with respect of the alternative , for a given significance level . Additionally, the ratio also nullifies any systematic effect contributions from assumed peak lineshape parameters, etc.
The -value associated with the test-statistic is simply Cowan et al. (2011)
| (5) |
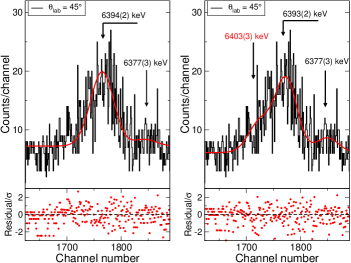
where is the pdf that describes , under the assumption of the background-only () hypothesis. Here again, considering the limited applicability of Wilks’ theorem for likelihood ratio tests Algeri et al. (2020), we fall back on Monte Carlo simulations to determine the distribution of . Fig. 3 compares the values obtained from toy Monte Carlo data sets, with the measured value of for . These results yield a -value , which rules out the null hypothesis at the level. A similar analysis for the low-statistics data at also yields a small probability . We show the fits to these data in Fig. 4 for completeness, despite the meager statistics at this angle.
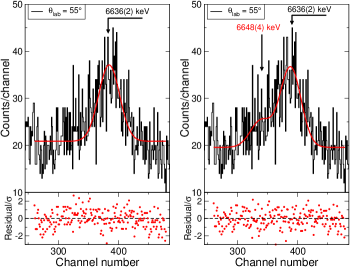
In addition to the above, we note that our higher statistics spectrum shows an excess of counts in the low energy region of the triton peak corresponding to the 6636 keV state (c.f. Fig. 1). Close inspection of the spectra from the previous experiment by Parikh et al. (Fig. 1 in Ref. Parikh et al. (2011)) and the work by Irvine et al. (Fig. 1 in Ref. Irvine et al. (2013)) shows some evidence of similar structure. We thus analyzed the data in this ROI similarly as with the 6400 keV region. Available data from Refs. Rebeiro et al. (2020, 2021, 2016); Nzobadila Ondze et al. (2021); Kamil et al. (2021) clearly indicated that the peaks in this region ought to have nearly Gaussian lineshapes. Using the same approach as before, we first fitted the 6636 keV peak with its width as a free parameter. This yielded an anomalously large FWHM of 65(6) channels, which is nearly twice the expected value of 33(4) channels, and about 1.5 times larger than the 6255 keV peak. This disagreement prompted us to proceed as previously, incorporating the extended maximum likelihood method in Eq. (3), again with conservative CL constraints on the FWHM parameter. The null hypothesis fit results, together with a new set of toy Monte Carlo simulations for these data, yielded . This small -value strongly suggests an additional state in the region, shown in the right panel of Fig. 5. On including this extra peak in our analysis, we determine the excitation energy of the state to be 6648(4) keV. This corresponds to a resonance at keV, towards the higher edge of the Gamow window for the reaction at peak nova temperatures. Similarly significant results (that implied new features in the peak structures) were not obtained for any of the other observed triton groups555We also do not see any signature of the , isobaric analog state, which is known to have considerable isospin mixing with the state at 6390 keV Bennett et al. (2016). This may be because we were limited by experimental sensitivity. in Fig. 1.
IV Astrophysical implications
The contribution of resonances can be determined from their individual resonance strengths
| (6) |
where is the spin of the resonance, and are the partial proton and gamma widths of the resonant state in 31S, and is its total width. Although past experimental investigations Bennett et al. (2016); Ma et al. (2007); Wrede et al. (2007, 2009); Parikh et al. (2011); Irvine et al. (2013); Kankainen et al. (2006); Bennett et al. (2018); Kankainen et al. (2017); Doherty et al. (2012, 2014); Setoodehnia et al. (2020); Jenkins et al. (2006) have provided invaluable information in this regard, the spins and parities of only three of these levels are known with certainty at present. These include ens the isobaric analog state (IAS) at 6281 keV, the state at 6255 keV and a recently reported state at 6390 keV Bennett et al. (2016). The latter was identified via accurate measurements of -delayed ray intensities, together with shell model calculations that showed significant isospin mixing of the () state with the IAS. This 6390 keV state (at keV) is arguably the most important resonance Bennett et al. (2016) known at the present time, with a calculated resonance strength of 24 eV Bennett et al. (2016). Very recently a revised eV Budner et al. (2022) was reported for this resonance, from a measurement of the proton branching ratio for the state.
Because of the limited available experimental information regarding most the proton unbound states in 31S, the authors of Refs. Brown et al. (2014, 2015) performed comprehensive shell model calculations using the USDB-cdpn Hamiltonian, that included a description of several negative parity states. They matched around 20 theoretically predicted levels (in the 5.9–7 MeV range) with experiment, and calculated the for each of the resonances to obtain the reaction rate over . In their analysis, the 6401 keV resonance was matched to a state predicted at 6298 keV, with calculated keV and keV. However, two states predicted at 6247 and 6602 keV could not be associated with any experimentally levels reported during the time. It is therefore quite likely that the latter level is the 6648(4) keV state identified in this work. Its resonance strength was calculated to be keV.
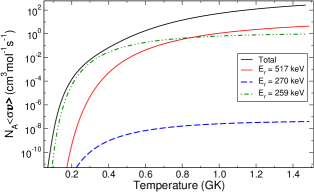
Fig. 6 compares the individual contributions of the 270 and 517 keV resonances to the recently reported 259 keV resonance Bennett et al. (2016, 2018) that is expected to significantly contribute to the total reaction rate over . We note that with the recent shell-model-evaluated resonance strength, the contribution of the 6401 keV state ( keV) is much smaller than the other two resonances over a large range of temperatures. In comparison, our matched 6648 keV level has a relatively larger contribution, beginning to get influential around . This may have significant repercussions. While most nova models show maximum peak temperatures of about 0.4 GK, it has been shown that cold massive white dwarfs () with low accretion rates Townsley and Bildsten (2004) can lead to peak nova temperatures of around 0.5 GK Glasner and Truran (2009). In such cases the contribution of this resonance cannot be neglected. Furthermore, the reaction rate is also an important ingredient in the modeling of X-ray bursts José et al. (2010), where the peak temperatures approach around 1.4 GK. At these temperatures the fractional contribution of our proposed 517 keV resonance to the total reaction rate is much higher.
V Summary
We used a measurement to study the excitation energy region in 31S relevant for the reaction in classical novae. A likelihood ratio analysis of our data supports the existence of a 6401 keV state in 31S, claimed to be observed in previous and work. The data also suggest, with high significance, an additional state in 31S at about 6648 keV. This corresponds to a resonance at around 517 keV, towards the higher edge of the Gamow window at peak nova temperatures of 0.4 GK.
In light of these results, further investigations to corroborate the existence of 6648 keV state in 31S and determine its properties (spin-parity, lifetime, proton width, etc.) would be welcome. Similar work related to the 6401 keV state also remain well motivated.
Acknowledgements.
We thank Alex Brown for the sharing with us the complete shell model results from Refs. Brown et al. (2014, 2015). Useful discussions with Chris Koen, Alejandro García and Werner Richter are gratefully acknowledged. This work was partially funded by the National Research Foundation (NRF), South Africa under Grant No. 85100 and the Natural Sciences and Engineering Research Council (NSERC) Canada.References
- José et al. (2001) J. José, A. Coc, and M. Hernanz, Astrophys. J. 560, 897 (2001).
- José and Hernanz (2007) J. José and M. Hernanz, J. Phys. G: Nucl. Part. Phys. 34, R431 (2007).
- Hayward et al. (1996) T. L. Hayward, P. Saizar, R. D. Gehrz, R. A. Benjamin, C. G. Mason, J. R. Houck, J. W. Miles, G. E. Gull, and J. Schoenwald, Astrophys. J. 469, 854 (1996).
- Snijders et al. (1987) M. A. J. Snijders, T. J. Batt, P. F. Roche, M. J. Seaton, D. C. Morton, T. A. T. Spoelstra, and J. C. Blades, MNRAS 228, 329 (1987).
- Amari et al. (2001) S. Amari, X. Gao, L. R. Nittler, E. Zinner, J. Jose, M. Hernanz, and R. S. Lewis, Astrophys. J. 551, 1065 (2001).
- José et al. (1999) J. José, A. Coc, and M. Hernanz, Astrophys. J. 520, 347 (1999).
- Iliadis et al. (2002) C. Iliadis, A. Champagne, J. Jose, S. Starrfield, and P. Tupper, Astrophys. J. Supp. 142, 105 (2002).
- Budner et al. (2022) T. Budner, M. Friedman, C. Wrede, B. A. Brown, J. José, D. Pérez-Loureiro, L. J. Sun, J. Surbrook, Y. Ayyad, D. W. Bardayan, K. Chae, A. A. Chen, K. A. Chipps, M. Cortesi, B. Glassman, M. R. Hall, M. Janasik, J. Liang, P. O’Malley, E. Pollacco, A. Psaltis, J. Stomps, and T. Wheeler, Phys. Rev. Lett. 128, 182701 (2022).
- Bennett et al. (2016) M. B. Bennett, C. Wrede, B. A. Brown, S. N. Liddick, D. Pérez-Loureiro, D. W. Bardayan, A. A. Chen, K. A. Chipps, C. Fry, B. E. Glassman, C. Langer, N. R. Larson, E. I. McNeice, Z. Meisel, W. Ong, P. D. O’Malley, S. D. Pain, C. J. Prokop, H. Schatz, S. B. Schwartz, S. Suchyta, P. Thompson, M. Walters, and X. Xu, Phys. Rev. Lett. 116, 102502 (2016).
- Ma et al. (2007) Z. Ma, D. W. Bardayan, J. C. Blackmon, R. P. Fitzgerald, M. W. Guidry, W. R. Hix, K. L. Jones, R. L. Kozub, R. J. Livesay, M. S. Smith, J. S. Thomas, and D. W. Visser, Phys. Rev. C 76, 015803 (2007).
- Wrede et al. (2007) C. Wrede, J. A. Caggiano, J. A. Clark, C. Deibel, A. Parikh, and P. D. Parker, Phys. Rev. C 76, 052802 (2007).
- Wrede et al. (2009) C. Wrede, J. A. Caggiano, J. A. Clark, C. M. Deibel, A. Parikh, and P. D. Parker, Phys. Rev. C 79, 045803 (2009).
- Parikh et al. (2011) A. Parikh, K. Wimmer, T. Faestermann, R. Hertenberger, J. José, R. Longland, H.-F. Wirth, V. Bildstein, S. Bishop, A. A. Chen, J. A. Clark, C. M. Deibel, C. Herlitzius, R. Krücken, D. Seiler, K. Straub, and C. Wrede, Phys. Rev. C 83, 045806 (2011).
- Irvine et al. (2013) D. Irvine, A. A. Chen, A. Parikh, K. Setoodehnia, T. Faestermann, R. Hertenberger, H.-F. Wirth, V. Bildstein, S. Bishop, J. A. Clark, C. M. Deibel, J. Hendriks, C. Herlitzius, R. Krücken, W. N. Lennard, O. Lepyoshkina, R. Longland, G. Rugel, D. Seiler, K. Straub, and C. Wrede, Phys. Rev. C 88, 055803 (2013).
- Kankainen et al. (2006) A. Kankainen, T. Eronen, S. P. Fox, H. O. U. Fynbo, U. Hager, J. Hakala, J. Huikari, D. G. Jenkins, A. Jokinen, S. Kopecky, I. Moore, A. Nieminen, H. Penttilä, S. Rinta-Antila, O. Tengblad, Y. Wang, and J. Äystö, Eur. Phys. J. A 27, 67 (2006).
- Bennett et al. (2018) M. B. Bennett, C. Wrede, S. N. Liddick, D. Pérez-Loureiro, D. W. Bardayan, B. A. Brown, A. A. Chen, K. A. Chipps, C. Fry, B. E. Glassman, C. Langer, N. R. Larson, E. I. McNeice, Z. Meisel, W. Ong, P. D. O’Malley, S. D. Pain, C. J. Prokop, H. Schatz, S. B. Schwartz, S. Suchyta, P. Thompson, M. Walters, and X. Xu, Phys. Rev. C 97, 065803 (2018).
- Kankainen et al. (2017) A. Kankainen, P. Woods, H. Schatz, T. Poxon-Pearson, D. Doherty, V. Bader, T. Baugher, D. Bazin, B. Brown, J. Browne, A. Estrade, A. Gade, J. José, A. Kontos, C. Langer, G. Lotay, Z. Meisel, F. Montes, S. Noji, F. Nunes, G. Perdikakis, J. Pereira, F. Recchia, T. Redpath, R. Stroberg, M. Scott, D. Seweryniak, J. Stevens, D. Weisshaar, K. Wimmer, and R. Zegers, Phys. Lett. B 769, 549 (2017).
- Doherty et al. (2012) D. T. Doherty, G. Lotay, P. J. Woods, D. Seweryniak, M. P. Carpenter, C. J. Chiara, H. M. David, R. V. F. Janssens, L. Trache, and S. Zhu, Phys. Rev. Lett. 108, 262502 (2012).
- Doherty et al. (2014) D. T. Doherty, P. J. Woods, G. Lotay, D. Seweryniak, M. P. Carpenter, C. J. Chiara, H. M. David, R. V. F. Janssens, L. Trache, and S. Zhu, Phys. Rev. C 89, 045804 (2014).
- Setoodehnia et al. (2020) K. Setoodehnia, A. A. Chen, J. Chen, J. A. Clark, C. M. Deibel, J. Hendriks, D. Kahl, W. N. Lennard, P. D. Parker, D. Seiler, and C. Wrede, Phys. Rev. C 102, 045806 (2020).
- Jenkins et al. (2006) D. G. Jenkins, A. Meadowcroft, C. J. Lister, M. P. Carpenter, P. Chowdhury, N. J. Hammond, R. V. F. Janssens, T. L. Khoo, T. Lauritsen, D. Seweryniak, T. Davinson, P. J. Woods, A. Jokinen, H. Penttila, G. Martínez-Pinedo, and J. José, Phys. Rev. C 73, 065802 (2006).
- Jordi José (2016) Jordi José, Stellar Explosions, Hydrodynamics and Nucleosynthesis (CRC Press, Taylor and Francis group, 2016).
- (23) https://www.nndc.bnl.gov/ensdf/.
- Burcher et al. (2022) S. Burcher, K. A. Chipps, R. O. Hughes, C. S. Reingold, A. Saastamoinen, J. T. Harke, N. Cooper, S. Ahn, J. M. Allmond, H. Clark, J. A. Cizewski, M. R. Hall, J. Hooker, H. Jayatissa, K. L. Jones, S. Ota, S. D. Pain, K. Schmidt, A. Simon, and S. Upadhyayula, Phys. Rev. C 105, 045805 (2022).
- Löffler et al. (1973) M. Löffler, H. Scheerer, and H. Vonach, Nucl. Instr. Meth. 111, 1 (1973).
- Dollinger and Faestermann (2018) G. Dollinger and T. Faestermann, Nuclear Physics News 28, 5 (2018).
- Triambak et al. (2006a) S. Triambak, A. García, E. G. Adelberger, G. J. P. Hodges, D. Melconian, H. E. Swanson, S. A. Hoedl, S. K. L. Sjue, A. L. Sallaska, and H. Iwamoto, Phys. Rev. C 73, 054313 (2006a).
- Triambak et al. (2006b) S. Triambak, A. García, D. Melconian, M. Mella, and O. Biesel, Phys. Rev. C 74, 054306 (2006b).
- Glen Cowan (1998) Glen Cowan, Statistical Data Analysis (Oxford University Press, 1998).
- Press et al. (2007) W. Press, S. Teukolsky, W. Vetterling, and B. Flannery, Numerical Recipes: The Art of Scientific Computing (Cambridge University Press, 2007).
- Baker and Cousins (1984) S. Baker and R. D. Cousins, Nucl. Instrum. Meth. Phys. Res. 221, 437 (1984).
- Zyla et al. (2020) P. Zyla et al. (Particle Data Group), Prog. Theo. Exp. Phys. 2020, 083C01 (2020).
- Rebeiro et al. (2020) B. M. Rebeiro, S. Triambak, P. E. Garrett, B. A. Brown, G. C. Ball, R. Lindsay, P. Adsley, V. Bildstein, C. Burbadge, A. Diaz Varela, T. Faestermann, D. L. Fang, R. Hertenberger, M. Horoi, B. Jigmeddorj, M. Kamil, K. G. Leach, P. Z. Mabika, J. C. Nzobadila Ondze, J. N. Orce, and H.-F. Wirth, Phys. Lett. B 809, 135702 (2020).
- Rebeiro et al. (2021) B. M. Rebeiro, S. Triambak, P. E. Garrett, B. A. Brown, G. C. Ball, R. Lindsay, P. Adsley, V. Bildstein, C. Burbadge, A. Diaz-Varela, T. Faestermann, R. Hertenberger, B. Jigmeddorj, M. Kamil, K. G. Leach, P. Z. Mabika, J. C. N. Ondze, J. N. Orce, A. Radich, and H.-F. Wirth, Phys. Rev. C 104, 034309 (2021).
- Rebeiro et al. (2016) B. Rebeiro, S. Triambak, R. Lindsay, P. Adsley, C. Burbadge, G. Ball, V. Bildstein, T. Faestermann, P. E. Garrett, R. Hertenberger, A. Radich, E. Rand, A. Varela, and H.-F. Wirth, Journal of Physics: Conference Series 689, 012026 (2016).
- Nzobadila Ondze et al. (2021) J. C. Nzobadila Ondze, B. M. Rebeiro, S. Triambak, L. Atar, G. C. Ball, V. Bildstein, C. Burbadge, A. Diaz Varela, T. Faestermann, P. E. Garrett, R. Hertenberger, M. Kamil, R. Lindsay, J. N. Orce, A. Radich, and H.-F. Wirth, Phys. Rev. C 103, 034329 (2021).
- Kamil et al. (2021) M. Kamil, S. Triambak, A. Magilligan, A. García, B. A. Brown, P. Adsley, V. Bildstein, C. Burbadge, A. Diaz Varela, T. Faestermann, P. E. Garrett, R. Hertenberger, N. Y. Kheswa, K. G. Leach, R. Lindsay, D. J. Marín-Lámbarri, F. Ghazi Moradi, N. J. Mukwevho, R. Neveling, J. C. Nzobadila Ondze, P. Papka, L. Pellegri, V. Pesudo, B. M. Rebeiro, M. Scheck, F. D. Smit, and H.-F. Wirth, Phys. Rev. C 104, L061303 (2021).
- Wilks (1938) S. S. Wilks, Ann. Math. Statist. 9, 60 (1938).
- Chernoff (1954) H. Chernoff, The Annals of Mathematical Statistics 25, 573 (1954).
- Self and Liang (1987) S. G. Self and K.-Y. Liang, Journal of the American Statistical Association 82, 605 (1987).
- McLachlan (1987) G. J. McLachlan, Journal of the Royal Statistical Society. Series C (Applied Statistics) 36, 318 (1987).
- Cowan et al. (2011) G. Cowan, K. Cranmer, E. Gross, and O. Vitells, Eur. Phys. J. C 71, 1554 (2011).
- Neyman and Pearson (1933) J. Neyman and E. S. Pearson, Philosophical Transactions of the Royal Society of London. Series A, Containing Papers of a Mathematical or Physical Character 231, 289 (1933).
- Algeri et al. (2020) S. Algeri, J. Aalbers, K. D. Morå, and J. Conrad, Nature Reviews Physics 2, 245 (2020).
- Iliadis et al. (2010) C. Iliadis, R. Longland, A. Champagne, A. Coc, and R. Fitzgerald, Nuclear Physics A 841, 31 (2010), the 2010 Evaluation of Monte Carlo based Thermonuclear Reaction Rates.
- Brown et al. (2014) B. A. Brown, W. A. Richter, and C. Wrede, Phys. Rev. C 89, 062801 (2014).
- Brown et al. (2015) B. A. Brown, W. A. Richter, and C. Wrede, Phys. Rev. C 92, 069901 (2015).
- Townsley and Bildsten (2004) D. M. Townsley and L. Bildsten, The Astrophysical Journal 600, 390 (2004).
- Glasner and Truran (2009) S. A. Glasner and J. W. Truran, The Astrophysical Journal 692, L58 (2009).
- José et al. (2010) J. José, F. Moreno, A. Parikh, and C. Iliadis, The Astrophysical Journal Supplement Series 189, 204 (2010).