Galaxy cluster aperture masses are more robust to baryonic effects than 3D halo masses
Abstract
Systematic uncertainties in the mass measurement of galaxy clusters limit the cosmological constraining power of future surveys that will detect more than clusters. Previously, we argued that aperture masses can be inferred more accurately and precisely than 3D masses without loss of cosmological constraining power. Here, we use the Baryons and Haloes of Massive Systems (BAHAMAS) cosmological, hydrodynamical simulations to show that aperture masses are also less sensitive to changes in mass caused by galaxy formation processes. For haloes with , binned by their 3D halo mass, baryonic physics affects aperture masses and 3D halo masses similarly when measured within apertures similar to the halo virial radius, reaching a maximum reduction of . For lower-mass haloes, , and aperture sizes , representative of weak lensing observations, the aperture mass is consistently reduced less () than the 3D halo mass ( for ). The halo mass reduction evolves only slightly, by up to age points, between redshift and for both the aperture mass and . Varying the simulated feedback strength so the mean simulated hot gas fraction covers the observed scatter inferred from X-ray observations, we find that the aperture mass is consistently less biased than the 3D halo mass, by up to age points at . Therefore, aperture mass calibrations provide a fruitful path to reduce the sensitivity of future cluster surveys to systematic uncertainties.
keywords:
cosmology: observations, cosmology: theory, large-scale structure of Universe, cosmological parameters, gravitational lensing: weak, galaxies: clusters: general1 Introduction
Future large-scale surveys such as Euclid111https://www.euclid-ec.org and the Rubin Observatory Legacy Survey of Space and Time (LSST)222https://www.lsst.org/ will study the competition between the growth of structure from the gravitational collapse of matter, and the accelerated expansion of the Universe due to dark energy or modified gravity (e.g. LSST Science Collaboration et al., 2009; Amendola et al., 2018). Galaxy clusters probe this effect particularly well because they are still actively forming due to the hierarchical growth of structure. Hence, the cluster abundance as a function of mass and time is sensitive to the amount of matter and the cosmological expansion history (e.g. Haiman et al., 2001; Allen et al., 2011).
The statistical power of current cluster surveys is still limited by their modest sample sizes. However, the recently released Atacama Cosmology Telescope (ACT) cluster sample already contains objects (Hilton et al., 2021) and for Euclid and the LSST sample sizes of objects are expected (e.g. Tyson et al., 2003; Sartoris et al., 2016), ushering in the era of cluster surveys that will be limited by systematic uncertainties (Köhlinger et al., 2015).
Currently, building a cluster sample for a cosmology analysis requires three steps. First, clusters need to be detected in the data by identifying large matter overdensities either through the clustering of galaxies in space and redshift in optical images or through peaks in the X-ray emission, the Sunyaev-Zel’dovich effect or the weak lensing shear. Second, measures of cluster masses are calibrated, usually, by measuring the mass–observable relation that links the survey detection observable to the cluster mass derived from weak lensing observations. Third, by modelling the cluster selection through the survey observable, the measured abundance can be compared to predictions based on the theoretical, cosmology-dependent halo mass function to constrain the cosmological parameters of the Universe.
The exponential sensitivity of the cluster abundance to the cluster mass means that the accuracy of the cluster mass calibration limits the cosmological constraining power of cluster surveys. In Debackere et al. (2022), hereafter Paper I, we argued that aperture mass calibrations can greatly reduce the systematic uncertainty of cluster cosmology analyses. Aperture masses can be measured directly from weak lensing observations and in simulations, which avoids the deprojection of the observations and, hence, bypasses the additional biases and uncertainties introduced by the assumed spherically symmetric density profile in the deprojection. Moreover, aperture masses can be measured within fixed angular or physical apertures, with no need to derive an overdensity radius that depends on the assumed density profile. The aperture mass measurement uncertainty depends solely on the number of background galaxies used to sample the shear field and is times smaller than the uncertainty in the inferred 3D halo masses. We also showed that, compared to the 3D halo mass function, the aperture mass function is more sensitive to changes in and , similarly sensitive to changes in , , and , and slightly less sensitive to changes in . Hence, the aperture mass function can also constrain the cosmological evolution of the Universe.
Since the projected mass within an aperture is actually derived from the weak lensing signal of galaxies outside of the aperture, the measured aperture mass is also less sensitive to sources of systematic error near the cluster centre such as miscentring and contamination of the lensing signal due to cluster galaxies (e.g. Mandelbaum et al., 2010; Hoekstra et al., 2012). Moreover, aperture masses can be measured unambiguously, even for triaxial and disturbed systems. Hence, the aperture mass measurement is relatively robust to different sources of systematic uncertainty.
One source of systematic uncertainty that will become important for future surveys, is the impact of baryonic physics on the inferred cluster mass compared with a universe containing only dark matter. All currently available theoretical predictions of the halo abundance rely on suites of large-volume dark matter-only (DMO) simulations (e.g. Tinker et al., 2008; Nishimichi et al., 2018; McClintock et al., 2019; Bocquet et al., 2020). However, we have known for a long time that baryonic processes related to galaxy formation can significantly modify cluster masses (e.g. Rudd et al., 2008; Stanek et al., 2009; Cui et al., 2012; Martizzi et al., 2014; Velliscig et al., 2014; Bocquet et al., 2016). To ensure realistic cluster gas fractions—and to prevent overcooling—simulations with subgrid models for radiative cooling and star formation also need to include the feedback from Active Galactic Nuclei (AGN, e.g. McCarthy et al., 2010). For clusters with masses between , where is the mass within a radius enclosing an average overdensity 333In Debackere et al. (2021), we wrongly defined this spherical overdensity as . However, the actual mass calculations used in that paper did use the correct overdensity definition , as can be seen from the publicly available code. of , AGN feedback reduces the total halo mass by with a larger impact for lower halo masses, compared to the same halo in a universe comprising only dark matter (e.g. Velliscig et al., 2014; Bocquet et al., 2016). This mass reduction will become an important systematic uncertainty due to the increased statistical power of future surveys. Since the aperture mass measures the projected mass, it should be less sensitive to baryonic processes that dominate the cluster density profile on small scales (see e.g. Henson et al., 2017; Lee et al., 2018; Debackere et al., 2021).
To include the effect of baryons in a traditional cluster cosmology analysis that relies on DMO simulations to predict the cosmology dependence of the halo mass function, we need to include a baryonic correction in the theoretical halo mass to infer unbiased cosmological parameters (e.g. Balaguera-Antolínez & Porciani, 2013; Debackere et al., 2021). Thus, to write down the full forward model of the observed cluster number counts, we need a calibrated mass–observable relation, , a theoretical prediction of the cosmology-dependent halo abundance, , where indicates the cosmological parameters, and a conversion between the observed cluster mass, , and the theoretical halo mass, . This conversion includes the baryonic mass correction if the theoretical halo abundance was predicted using DMO simulations. We can then write the number counts, , within the observable bin, , and redshift bin, , for the assumed cosmology, , as
| (1) |
Here, the observable and the redshift are integrated over their respective bins and the different halo masses from to . The theoretical halo mass function, , is calculated per unit survey area and redshift interval. We have introduced a redshift-dependent conversion between the theoretical halo mass from DMO simulations, , and the mass of the same halo in a universe containing baryons, . Moreover, we explicitly differentiate between , the cluster mass measured observationally, and , the total halo mass measured in the hydrodynamical simulation, since is a noisy measurement of due to observational systematic uncertainties. We will assume perfect knowledge of the selection function to simplify the analysis, but we refer the interested reader to Section 5.1 of Paper I for a discussion about how the selection function will impact a cosmological analysis relying on aperture mass calibrations.
One straightforward way to eliminate the systematic uncertainty in converting halo masses from the DMO to the hydrodynamical simulation, is to predict the cosmology dependence of the halo abundance directly from large-volume hydrodynamical simulations for a grid of cosmological parameters, i.e. to predict . However, due to the computational expense and the uncertain astrophysics, such an effort has so far not been undertaken.
The relation between the measured observable and halo mass, can be measured observationally, with the caveat that the inferred 3D halo mass depends on the density profile assumed in the deprojection, thus introducing a significant modelling uncertainty. The measurement uncertainty, , can be calibrated using simulations for both the aperture mass and the 3D halo mass. In Paper I, we emphasized that the measurement uncertainty in the aperture mass, , depends only on the number density of background galaxies used to reconstruct the weak lensing shear. For 3D halo masses, on the other hand, the assumption of a density profile to deproject the observations and to infer the mass within a fixed overdensity radius, introduces a model-dependent bias in the inferred halo mass due to the mismatch between the spherically symmetric density profile and the true, triaxial halo, including substructure and correlated structure. Uncorrelated structure along the line-of-sight introduces an additional uncertainty (e.g. Hoekstra, 2001).
We use the Baryons and Haloes of Massive Systems (BAHAMAS) suite of large-volume cosmological, hydrodynamical simulations (McCarthy et al., 2017; McCarthy et al., 2018) to study the effect of feedback processes related to galaxy formation on halo aperture masses, that is, the term in Eq. (1). The BAHAMAS simulations have been calibrated to reproduce the observed galaxy stellar mass function and the cluster hot gas fractions derived from X-ray observations, and they reproduce a wide range of observed properties of massive systems, enabling realistic cosmology forecasts that include the effect of baryons. We quantify the change in the aperture mass in BAHAMAS, and examine how it depends on the strength of the implemented feedback. We compare our results to the baryonic correction to the 3D DMO halo mass.
This paper is structured as follows: in Section 2, we introduce the BAHAMAS simulations, describe the aperture mass measurement, and we discuss the matching between haloes in the hydrodynamical and DMO simulations. In Section 3, we show the relation between the aperture mass and the 3D halo mass. In Section 4, we compare the mean change in the halo mass when including baryons and its scatter for both aperture masses and 3D halo masses, we study its redshift evolution and sensitivity to different baryonic physics models that bracket the observationally allowed range of cluster gas fractions derived from X-ray observations. We conclude in Section 5.
2 Simulations
We measured the projected aperture masses of group and cluster-sized haloes from the BAHAMAS suite of cosmological hydrodynamical simulations (McCarthy et al., 2017). This suite of simulations is well-suited for our aims for several reasons. First, due to the volume, we obtain a sufficiently large sample of massive haloes with . Second, the subgrid model parameters for the feedback from supernovae and AGN of the fiducial simulation have been calibrated to reproduce the present-day galaxy stellar mass function (GSMF), and, crucially for our work, the hot gas mass fractions of groups and clusters of galaxies. Moreover, variations of both the cosmological model and of the non-resolved, subgrid physics model parameters are available.
2.1 Simulation set
The BAHAMAS model remains unchanged from its predecessors OWLS (Schaye et al., 2010) and cosmo-OWLS (Le Brun et al., 2014), except for the values of the subgrid model parameters, which were chosen to reproduce the observed large-scale mass distribution of the Universe. Hence, we refer the interested reader to Schaye et al. (2010) for a detailed description of the different subgrid physics models.
The BAHAMAS suite consists of simulations run with a modified version of the Lagrangian TreePM-SPH code Gadget-3 (unpublished–for Gadget-2, see Springel, 2005) in boxes with a periodic side length of with initial conditions matching the maximum-likelihood cosmological parameter values from the WMAP9 data (Hinshaw et al., 2013), i.e. . The initial linear power spectrum is generated at using CAMB444https://camb.info/ (Lewis et al., 2000) and converted into particle positions using S-GenIC555https://github.com/sbird/S-GenIC, a modified version of NGenIC666https://www.h-its.org/2014/11/05/ngenic-code/, that includes second-order Lagrangian perturbation theory and supports massive neutrinos. The hydrodynamical and their corresponding dark matter-only (DMO) simulations contain and particles, respectively. This results in dark matter and (initial) baryonic particle masses of and , respectively, for the WMAP9 cosmology (the dark matter particle mass in the DMO simulations is ). The gravitational softening length is set to in physical (comoving) coordinates for .
Haloes are identified using the Friends-of-Friends (FoF) algorithm with a linking length of and their spherical overdensity masses are calculated from all the particles within the FoF halo, including particles that are not gravitationally bound, centred on the minimum of the gravitational potential using Subfind (Springel et al., 2001). The so-called subgrid models for non-resolved physical processes were taken from the preceding OWLS and cosmo-OWLS projects (Schaye et al., 2010; Le Brun et al., 2014, respectively). These models include recipes for the radiative heating and cooling of the 11 dominant elements tracked in the simulations (H, He, C, N, O, Ne, Mg, Si, S, Ca, Fe), by interpolating the tabulated Cloudy (Ferland et al., 1998) rates of Wiersma et al. (2009a) as a function of density, temperature and redshift. Star formation follows the implementation of Schaye & Dalla Vecchia (2008), fixing the unresolved cold interstellar medium (ISM) gas to an effective equation of state and a pressure-dependent star formation efficiency in order to reproduce the observed Kennicut–Schmidt star formation law. Stellar evolution and the chemical enrichment of gas due to both type Ia and type II supernovae, stellar winds, and asymptotic giant branch (AGB) stars are implemented following Wiersma et al. (2009b). Supernova feedback is implemented kinetically, following Dalla Vecchia & Schaye (2008). Finally, black hole seeding in low-mass galaxies, black hole growth through mergers and gas accretion, and the feedback from active galactic nuclei are modelled following Booth & Schaye (2009).
In Table 1, we list the specific simulations of the BAHAMAS suite that we use in this work. We list the DMO simulation and the hydrodynamical simulations with identical initial conditions and possible variations in the subgrid model assumptions. We will investigate the impact of variations in the strength of the AGN feedback by increasing (decreasing) the heating temperature by relative to the calibrated, fiducial value of . This results in lower (higher) hot gas mass fractions in groups and clusters of galaxies (see McCarthy et al., 2017).
| simulation | redshifts | variation |
|---|---|---|
| DMONLY_nu0_WMAP9 | 0.25, 0.5, 1 | — |
| AGN_TUNED_nu0_WMAP9 | 0.25, 0.5, 1 | |
| AGN_7p6_nu0_WMAP9 | 0.25, 0.5, 1 | |
| AGN_8p0_nu0_WMAP9 | 0.25, 0.5, 1 |
2.2 Aperture mass measurement
We follow the literature and refer to the excess projected mass within an aperture of size , defined as
| (2) | ||||
as the aperture mass (e.g. Bartelmann & Schneider, 2001). The background surface mass density within is inferred from the annulus between and . We have introduced the mean surface mass density
| (3) |
In Appendix A of Paper I, we showed that this definition of the aperture mass matches the -statistic (Clowe et al., 1998), which measures the enclosed excess surface mass density within from the observed weak lensing galaxy shears between and .
For our analysis, we generated projected surface mass density maps from the full simulation volume for each simulation in Table 1. First, we projected all the particles along the three principal axes of the simulation box. Then, we binned the projected particles into a pixel grid of resolution and obtained the surface mass density for pixel by summing the masses for all particles with coordinates belonging to the pixel and dividing by the pixel area. From the surface mass density, we calculated the aperture mass using Eq. (2) with and , centred on the potential minimum, for all haloes with . The chosen apertures are representative of weak lensing observations (e.g. Hoekstra et al., 2012; Applegate et al., 2014).
2.3 Matching haloes to their DMO counterparts
To quantify the influence of baryons on the halo aperture masses, we compare the aperture masses from haloes in the hydrodynamical simulations to those of their counterparts in a universe including only dark matter particles. (Technically, baryons are included in the transfer function used to calculate the initial conditions.) Since all BAHAMAS simulations with the same cosmological model have identical initial conditions and consistent, unique dark matter particle identification numbers, we can link haloes between the DMO and hydrodynamical simulations. We follow the linking method of Velliscig et al. (2014). Briefly, we identify each halo in the reference simulation to the halo in the matching simulation that contains at least half of its most-bound particles. Only if the same haloes are also linked when swapping the reference and the matching simulation in this procedure, do we consider them genuine counterparts. Haloes with are matched with a success rate higher than in all simulations.
One important caveat, which is especially important for aperture mass measurements, is that the dynamical history can differ between matched haloes in the hydrodynamical and the DMO simulation. Star formation and feedback processes modify the matter distribution, even though the distribution of haloes statistically remains the same on scales larger than the halo virial radius (e.g. van Daalen et al., 2014). The median 3D offset, , between the matched haloes with is , with haloes having . Upon visual inspection, the majority of the systems with large offsets are mergers where the haloes are identified as different components between the hydrodynamical and the DMO simulation, resulting in significantly different aperture mass measurements.
We exclude all haloes with 3D offsets from our sample. Given the minimum aperture size of , this cutoff ensures that the aperture mass measurements are not significantly affected by possibly misidentified haloes. The main effect of this selection criterion is to slightly reduce the scatter in the baryonic mass correction at the high 3D halo mass end, as some of the most massive haloes in BAHAMAS are merging and do not visually match between the hydrodynamical and the DMO simulation.
3 The relation between aperture mass and 3D halo mass
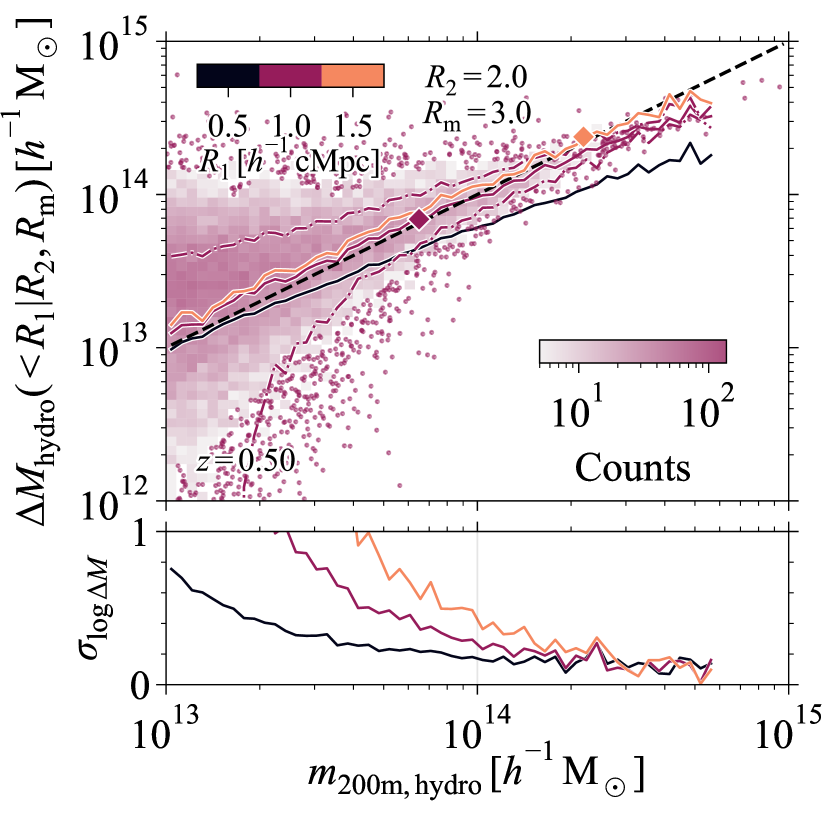
In Fig. 1, we show the full distribution of projected masses within apertures of size as a function of the 3D halo mass, , for all haloes at in the AGN_TUNED_nu0_WMAP9 simulation. The median aperture mass at fixed 3D halo mass is shown with different coloured lines for different apertures . We indicate the halo mass for which with coloured diamonds. Within a fixed aperture, aperture masses are slightly higher than the 3D halo mass when and lower when as the halo mass represents a smaller or larger fraction of the total aperture mass, respectively. Larger apertures result in larger masses. For masses a small but non-negligible fraction of the haloes will be surrounded by more massive structures along the line-of-sight, resulting in negative aperture masses. The fraction of haloes with negative aperture mass within increases from for to for . The fraction of negative aperture masses increases with increasing aperture size.
From the bottom panel of Fig. 1, we can see that the scatter in the aperture mass at at fixed 3D halo mass, calculated as half the difference between the 84th and the 16th percentiles of the aperture mass at fixed 3D mass, increases from for to for . Smaller apertures result in smaller scatter. We discussed in Paper I that the increase in the scatter of the aperture mass measured within a fixed aperture with decreasing 3D halo mass is caused by the large variation in the correlated structure surrounding the halo, which contributes more significantly to the total aperture mass for lower-mass haloes.
4 Aperture mass correction due to baryonic effects
We compare the aperture mass for matched haloes between the hydrodynamical and the DMO simulation to study the change in mass due to the inclusion of baryons and their associated galaxy formation processes. As shown by Eq. (1), the change in the cluster mass due to baryons can be included in the forward model of the cluster abundance when the cosmology dependence is predicted using DMO simulations. The relevant term in Eq. (1), , complicates the analysis since baryons introduce a mass and possibly redshift-dependent bias between and . Moreover, the uncertainty in at fixed needs to be accounted for correctly in order to convert the theoretical halo mass, , to the cluster observable, .
4.1 Binned by 3D halo mass
In a cluster cosmology analysis, baryonic effects enter as a correction in the theoretical, DMO halo mass, given by in Eq. (1). We compare the correction in the aperture mass and the 3D halo mass for the same halo sample by binning haloes according to their 3D DMO halo mass. We note that an analysis that uses the aperture mass function to model the cosmology-dependence of the cluster sample, needs to bin the halo sample by the aperture mass to model the correction, as we do in Section 4.2.
To calculate the mean mass correction of the halo sample binned by the 3D DMO halo mass, we compute the ratio between the mean stacked halo masses of the matched haloes in the hydrodynamical and DMO simulations, i.e. . Especially for the aperture mass, it is important to use the ratio of the mean masses instead of the mean of the mass ratios of individual haloes, i.e. , because of the large scatter in the aperture mass at fixed 3D halo mass (see Fig. 1). Low-aperture mass haloes contribute a disproportionately large uncertainty to since a small difference in the projected mass, due to the different halo dynamical history in the hydrodynamical and the DMO simulations, causes large fluctuations in the individual mass ratios. These low-aperture mass haloes do not contribute significantly to the mean mass in the halo stack, minimizing their impact on .
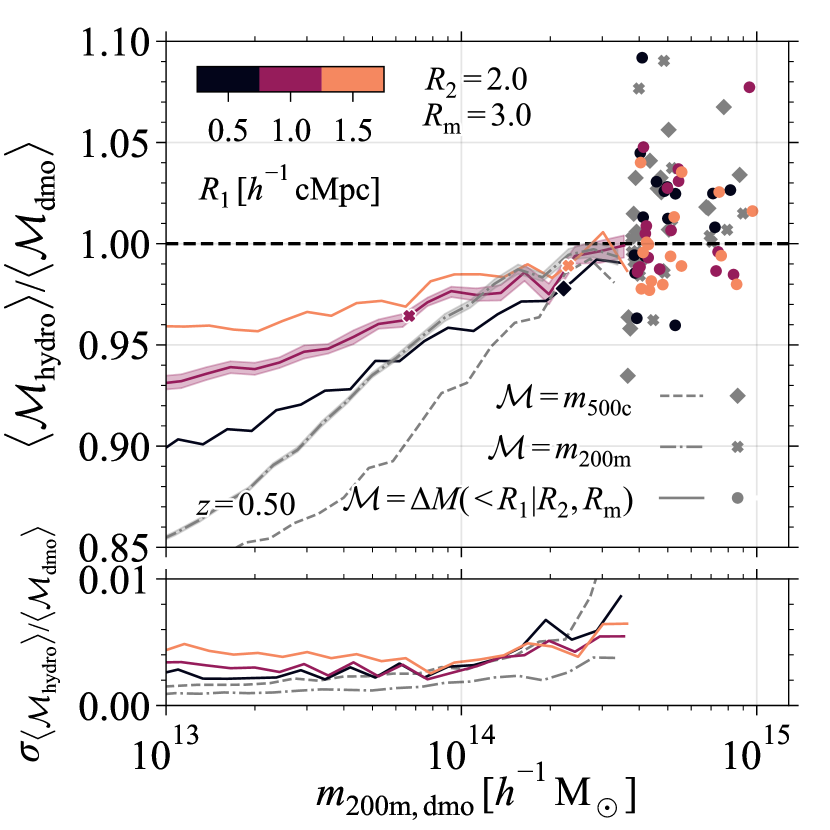
In the top panel of Fig. 2, we show the mean aperture mass in the hydrodynamical simulation relative to the DMO simulation in a stack of haloes binned by their 3D DMO halo mass, . The different coloured lines show the binned aperture mass changes for different aperture sizes, and the gray, dash-dotted and dashed lines for and , respectively. Since the halo baryon fraction increases with the halocentric distance, the baryonic correction decreases for larger apertures and radii enclosing a smaller overdensity. Since more massive haloes are able to retain a larger fraction of the cosmic baryons, the mass change also decreases with increasing 3D halo mass. For the most massive haloes, , the mass reduction is for all halo mass measures. For lower-mass haloes, the aperture mass is consistently less biased than the 3D halo mass.
The halo mass change due to the inclusion of baryons is caused by the heating of the intracluster gas by AGN feedback and galactic winds, transporting baryons to the halo outskirts and reducing the inner halo baryon fraction (e.g. Velliscig et al., 2014). For this reason, mass measurements that include more of the outer halo density profile will differ less from the DMO halo mass. We can see from Fig. 2 that aperture masses are less sensitive to the impact of baryons than 3D halo masses as masses measured within are less biased than even when because aperture masses probe scales larger than along the projection axis.
In the bottom panel of Fig. 2, we show the bootstrapped uncertainty in the ratio between the mean halo masses measured in the hydrodynamical and DMO simulations. We obtain the bootstrapped distribution of the mean halo mass in each bin of by resampling the haloes 500 times with replacement. Then, we calculate the uncertainty as half the difference between the 84th and the 16th percentiles. We also show the uncertainty as the shaded region in the top panel of Fig. 2 for the cases and . The uncertainty in the mean mass change is smallest for , being between to times smaller than the uncertainty in and the aperture mass measured within . The increase in the uncertainty for higher-mass haloes is due to the limited sample size of the BAHAMAS simulation. The mass change for all mass measurements can be determined with sub accuracy with the BAHAMAS cluster sample of haloes with .
4.2 Binned by aperture mass
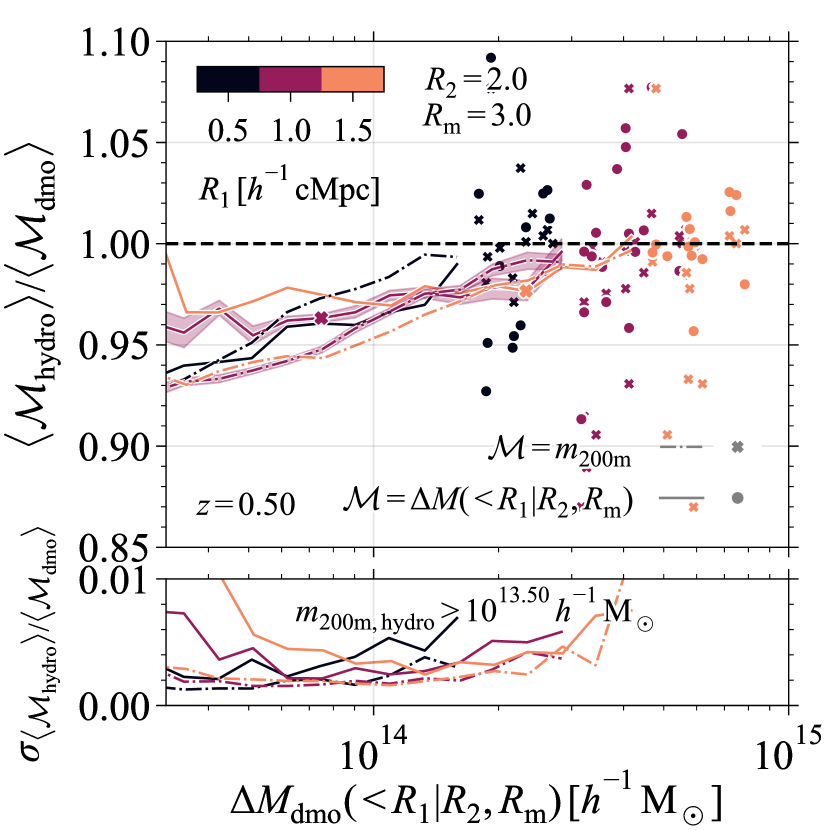
For a cluster cosmology analysis that uses the aperture mass function to model the cosmology-dependence of the number counts, the relevant mass correction is measured in bins of the aperture mass, not the 3D halo mass. In Fig. 3, we show the mean aperture (solid lines) and 3D (dash-dotted lines) mass relative to the mean mass of matched haloes in the DMO simulation, binned by the DMO aperture mass measured within different apertures (different coloured lines). We only include haloes with to ensure a clean cluster sample. From Fig. 1, we can clearly see that haloes with relatively low 3D halo masses can result in aperture masses . However, few of these haloes would actually be identified as clusters if we had applied an observational cluster-finding algorithm instead of calculating the aperture mass for all friends-of-friends haloes identified in the simulation. For simplicity, we use the 3D halo mass in the hydrodynamical simulations as the cluster selection criterion.
To interpret the baryonic correction when binning by the aperture mass, , we identify the aperture mass with the 3D halo mass bin, , whose haloes have the same mean aperture mass, . Then, we see that both the 3D halo mass and the aperture mass are similarly reduced for haloes with (equality is indicated with coloured crosses). For lower-mass haloes (), the aperture mass is dominated by the halo environment or structures aligned by chance along the line-of-sight, not by the 3D halo mass, resulting in a smaller reduction in the aperture mass than in the 3D halo mass.
Due to the large size of the BAHAMAS cluster sample, the bootstrapped uncertainty in the mass change, shown in the bottom panel of Fig. 3, is for all mass measurements. The sudden rise in the uncertainty towards low aperture masses for the larger aperture sizes is caused by the increased importance of matter outside of the halo, either in the halo environment or chance line-of-sight alignments. To put this in context, for aperture masses measured from weak lensing observations in apertures and assuming a WMAP9 cosmology, the expected noise level due to the finite number of background galaxies with an individual galaxy shape noise of and a background number density of , corresponds to masses of (see Eq. A10 of Paper I), similar to the masses where the uncertainty increases. Hence, the aperture mass range with the increased uncertainty would most likely not be included in a cosmological analysis.
4.3 Scatter in the baryonic correction
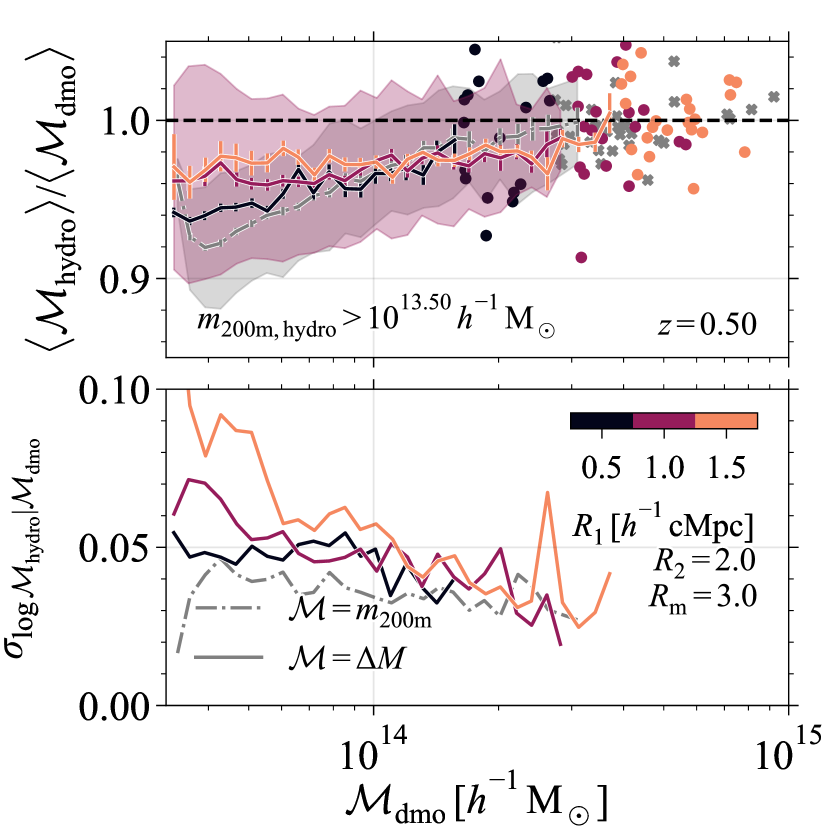
Besides the bias in the mean mass of matched haloes in the hydrodynamical and DMO simulations, the scatter is also important in a cosmological analysis. If not properly accounted for, scatter in the mass of haloes in the hydrodynamical simulation at fixed DMO halo mass can significantly bias the cosmological parameter inference. We focus on the 16th to 84th percentile scatter in the – relation in Fig. 4. In the top panel, we repeat the mean relation for both the aperture mass measurements and the 3D halo mass, , each binned by their respective DMO halo mass. Hence, the aperture and 3D mass measurements cannot be compared directly since a fixed value does not include the same haloes. We show the scatter for and to compare the magnitude of the scatter to the bias for the different mass measures.
In the bottom panel of Fig. 4, we show the scatter for both the aperture mass and the 3D halo mass, calculated as half the difference between the 84th and 16th percentiles. For , the scatter for all the different mass measures. Towards lower halo masses, the scatter in the 3D halo mass stays below , while the scatter in the larger apertures increases to and for and , respectively. The aperture mass scatter is larger due to the increased contribution of matter outside of the halo.
In conclusion, aperture masses are, on average, slightly less sensitive the changes in the cluster mass due to baryons because they measure the projected density, which includes contributions from larger radii. However, this also results in a slightly larger scatter. A detailed comparison of a cosmology analysis using either the aperture mass or the 3D halo mass would also need to include the additional effect of the survey observable and its scatter at fixed aperture mass or 3D halo mass.
4.4 Redshift evolution
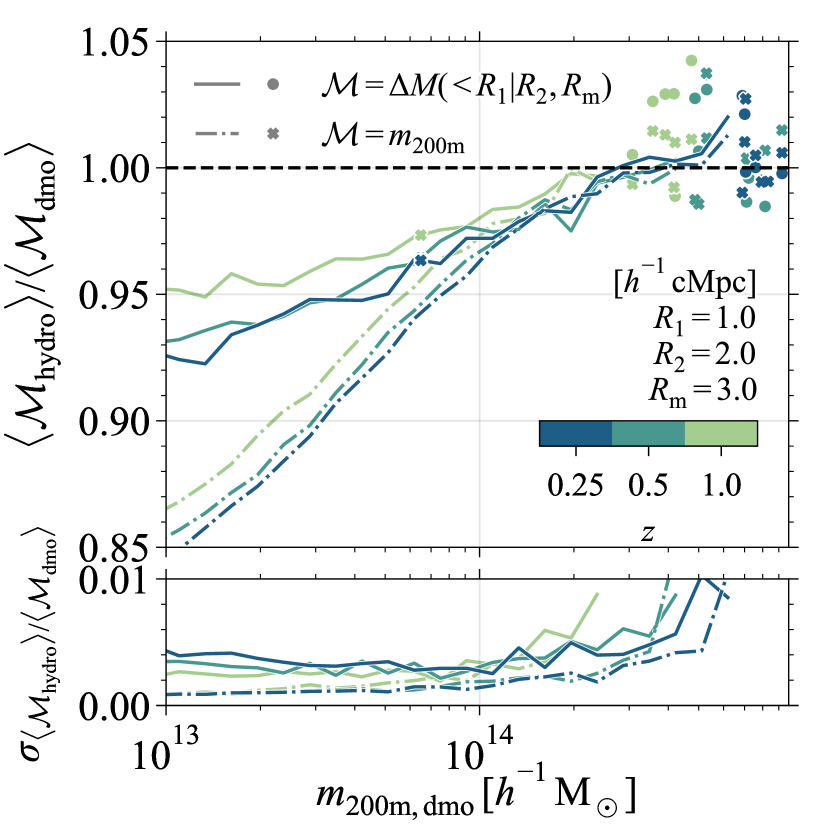
Since future surveys will probe clusters with high completeness and purity up to high redshifts of (e.g. Adam et al., 2019), we need to study how the impact of the inclusion of baryons on the cluster mass changes with redshift. In Fig. 5, we show the redshift evolution of the change in the aperture mass, , and the 3D halo mass, , in bins of the 3D DMO halo mass, , between and where most of the clusters will be detected. Both the aperture mass and the 3D halo mass bias decrease slightly with increasing redshift, with the aperture mass always being less suppressed for low-mass haloes than the 3D halo mass. In the bottom panel of Fig. 5, we show that the bootstrapped uncertainty in the mean mass suppression does not evolve appreciably.
4.5 Dependence on feedback strength
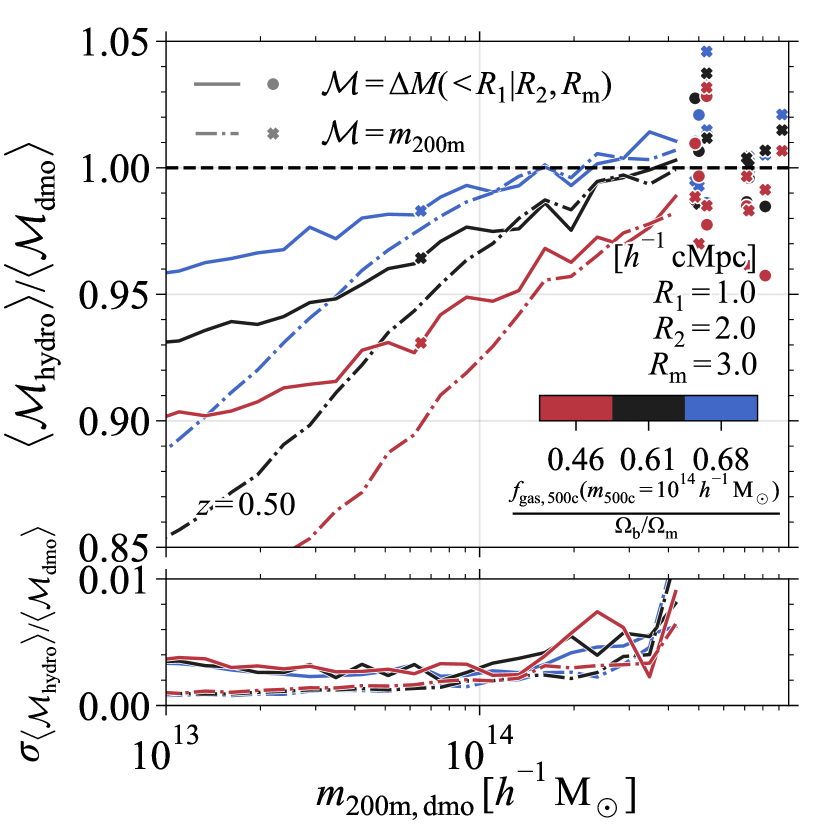
Finally, we study the impact of varying the strength of the simulated AGN feedback on the cluster masses. Simulated black holes accrete from their surrounding gas until the accumulated rest-mass energy reservoir is sufficiently large to heat randomly chosen neighbours to a minimum temperature . The fiducial subgrid parameter is varied to and , to have the mean simulated cluster hot gas fractions cover the scatter inferred from X-ray observations (McCarthy et al., 2017) while also reproducing the galaxy stellar mass function. We point out that these variations result in mean gas fractions that are significantly higher and lower than the mean observed X-ray gas fractions.
In Fig. 6, we show how the feedback strength affects the simulated cluster mass for haloes binned by the 3D halo mass, . We label the simulation variations with the true median cluster gas fraction relative to the cosmic baryon fraction, , in haloes of instead of the subgrid parameter, , since the gas fraction can be inferred observationally. We have not applied any post-processing to the simulation data to include the effects of hydrostatic bias on the cluster gas fractions inferred from observations. A higher (lower) AGN heating temperature, shown as red (blue) lines, results in stronger (weaker) feedback and lower (higher) cluster gas fractions. For low-mass clusters with , the aperture mass is consistently affected less by the inclusion of baryons than the 3D halo mass, while for higher-mass clusters, the suppression is similar.
In conclusion, we have compared how the mass of clusters matched between hydrodynamical and DMO simulations changes due to galaxy formation processes. In particular, we showed that aperture masses are consistently less sensitive to baryonic effects than 3D halo masses. This property and the fact that aperture masses can be measured directly in both simulations and observations, make the aperture mass an excellent mass calibration tool for future cluster surveys.
5 Conclusions
Future cosmological constraints from cluster surveys will be limited by our understanding of the systematic uncertainty in the measured cluster masses (e.g. Köhlinger et al., 2015). Since the current standard analysis relies on theoretical predictions of the cluster abundance based on dark matter-only simulations (e.g. Bocquet et al., 2019; DES Collaboration et al., 2020), the modification of the halo mass due to galaxy formation processes is one of the systematic uncertainties that we need to take into account (e.g. Balaguera-Antolínez & Porciani, 2013; Debackere et al., 2021). We have used the Baryons and Haloes of Massive Systems (BAHAMAS) suite of cosmological, hydrodynamical simulations, which have been shown to reproduce a wide range of the observed properties of massive systems, to study how galaxy formation processes modify the aperture mass of clusters compared to their matched haloes in a simulation that includes only dark matter particles.
In agreement with Debackere et al. (2021), who studied the sensitivity of the aperture mass to baryonic effects for idealized cluster density profiles that reproduce the cluster hot gas fractions inferred from X-ray observations, we find that aperture masses are less sensitive to baryonic effects than the 3D halo mass when measured within apertures larger than the halo virial radius. For haloes selected based on their 3D halo mass, aperture masses measured within annuli between , which is representative of weak lensing observations, are consistently less suppressed by baryonic effects than the 3D halo masses are ( vs. ) for all haloes with (Fig. 2). Similar conclusions hold when selecting haloes based on their aperture mass and ensuring that only genuine clusters are included by using an additional lower limit on the 3D halo mass (Fig. 3).
While for high-mass objects () the mass suppression due to baryons is similar for aperture and 3D masses, we expect baryonic effects to pose a greater challenge for 3D halo mass determinations. This is because a functional density profile needs to be assumed to derive a 3D halo mass from observational data and we expect this profile to be affected by baryons (e.g. Velliscig et al., 2014). The smaller suppression of the mass of group-sized haloes () and the fact that no density profile needs to be assumed to derive aperture masses, will enable robust mass estimates and, consequently, stronger constraints on galaxy formation processes in haloes at fixed mass.
Due to the sensitivity of the aperture mass to the halo environment, we find that the scatter in the aperture mass in the hydrodynamical simulation within fixed bins of the DMO aperture mass can be up to times larger, depending on the aperture size, than the typical scatter in the 3D halo mass (Fig. 4). However, the scatter stays below for all halo masses relevant for cluster cosmology. Hence, this is by no means a limiting factor in the cosmological analysis. The slightly reduced sensitivity to baryonic effects in the cluster mass range, , combined with the significantly reduced systematic uncertainties in the aperture mass measurement compared to the 3D halo mass inference, and the high cosmological sensitivity of the aperture mass function (Debackere et al., 2022), give the aperture mass a significant advantage as it reduces the absolute bias due to mass calibration uncertainties in cluster cosmology analyses.
We find only a small redshift evolution of age points in both the aperture mass and the 3D halo mass suppression between and (Fig. 5). Finally, we find that for extreme variations in the simulation AGN feedback strength that result in simulated mean hot gas fractions covering the scatter inferred from X-ray observations of individual clusters, the aperture mass is consistently up to age points less biased than the 3D halo mass, never exceeding a suppression of for (Fig. 6).
Looking towards the future, calibrations of the halo mass difference between hydrodynamical and DMO simulations can be bypassed when large-volume cosmological, hydrodynamical simulations run for a large grid of cosmological parameters become available. Such simulations can be used to measure the abundance of clusters directly as a function of any observable, avoiding the conversion between the theoretical prediction calibrated on DMO simulations, and the true halo mass, including the effects of baryons. Importantly, such simulations would need to withstand thorough tests of the realism of their cluster population. As long as such simulations are not available, however, accounting for the effects of galaxy formation on the cluster mass is a necessary step for any cluster cosmology survey limited in its constraining power only by systematic uncertainties.
Acknowledgements
This work is part of the research programme Athena with project number 184.034.002 and Vici grants 639.043.409 and 639.043.512, which are financed by the Dutch Research Council (NWO).
Data availability
The data used in this paper can be requested from the first author.
References
- Adam et al. (2019) Adam R., et al., 2019, Astron. Astrophys., 627, A23
- Allen et al. (2011) Allen S. W., Evrard A. E., Mantz A. B., 2011, Annu. Rev. Astron. Astrophys., 49, 409
- Amendola et al. (2018) Amendola L., et al., 2018, Living Reviews in Relativity, 21, 2
- Applegate et al. (2014) Applegate D. E., et al., 2014, Mon. Not. R. Astron. Soc., 439, 48
- Balaguera-Antolínez & Porciani (2013) Balaguera-Antolínez A., Porciani C., 2013, J. Cosmol. Astropart. Phys., 2013
- Bartelmann & Schneider (2001) Bartelmann M., Schneider P., 2001, Physics Reports, 340, 291
- Bocquet et al. (2016) Bocquet S., Saro A., Dolag K., Mohr J. J., 2016, Mon. Not. R. Astron. Soc., 456, 2361
- Bocquet et al. (2019) Bocquet S., et al., 2019, Astrophys. J., 878, 55
- Bocquet et al. (2020) Bocquet S., Heitmann K., Habib S., Lawrence E., Uram T., Frontiere N., Pope A., Finkel H., 2020, Astrophys. J., 901, 5
- Booth & Schaye (2009) Booth C. M., Schaye J., 2009, Mon. Not. R. Astron. Soc., 398, 53
- Clowe et al. (1998) Clowe D., Luppino G. A., Kaiser N., Henry J. P., Gioia I. M., 1998, Astrophys. J., 497, L61
- Cui et al. (2012) Cui W., Borgani S., Dolag K., Murante G., Tornatore L., 2012, Mon. Not. R. Astron. Soc., 423, 2279
- DES Collaboration et al. (2020) DES Collaboration et al., 2020, Phys. Rev. D, 102, 023509
- Dalla Vecchia & Schaye (2008) Dalla Vecchia C., Schaye J., 2008, Mon. Not. R. Astron. Soc., 387, 1431
- Debackere et al. (2021) Debackere S. N. B., Schaye J., Hoekstra H., 2021, Monthly Notices of the Royal Astronomical Society, 505, 593
- Debackere et al. (2022) Debackere S. N. B., Hoekstra H., Schaye J., Heitmann K., Habib S., 2022, Monthly Notices of the Royal Astronomical Society, p. stac1687
- Ferland et al. (1998) Ferland G. J., Korista K. T., Verner D. A., Ferguson J. W., Kingdon J. B., Verner E. M., 1998, Publications of the Astronomical Society of the Pacific, 110, 761
- Haiman et al. (2001) Haiman Z., Mohr J. J., Holder G. P., 2001, Astrophys. J., 553, 545
- Henson et al. (2017) Henson M. A., Barnes D. J., Kay S. T., McCarthy I. G., Schaye J., 2017, Mon. Not. R. Astron. Soc., 465, 3361
- Hilton et al. (2021) Hilton M., et al., 2021, ApJS, 253, 3
- Hinshaw et al. (2013) Hinshaw G., et al., 2013, Astrophys. J. Suppl. Ser., 208, 19
- Hoekstra (2001) Hoekstra H., 2001, Astron. Astrophys., 370, 743
- Hoekstra et al. (2012) Hoekstra H., Mahdavi A., Babul A., Bildfell C., 2012, Monthly Notices of the Royal Astronomical Society, 427, 1298
- Köhlinger et al. (2015) Köhlinger F., Hoekstra H., Eriksen M., 2015, Mon. Not. R. Astron. Soc., 453, 3107
- LSST Science Collaboration et al. (2009) LSST Science Collaboration et al., 2009, arXiv e-prints, p. arXiv:0912.0201
- Le Brun et al. (2014) Le Brun A. M., McCarthy I. G., Schaye J., Ponman T. J., 2014, Mon. Not. R. Astron. Soc., 441, 1270
- Lee et al. (2018) Lee B. E., Le Brun A. M. C., Haq M. E., Deering N. J., King L. J., Applegate D., McCarthy I. G., 2018, Mon. Not. R. Astron. Soc., 479, 890
- Lewis et al. (2000) Lewis A., Challinor A., Lasenby A., 2000, Astrophys. J., 538, 473
- Mandelbaum et al. (2010) Mandelbaum R., Seljak U., Baldauf T., Smith R. E., 2010, Monthly Notices of the Royal Astronomical Society, 405, 2078
- Martizzi et al. (2014) Martizzi D., Mohammed I., Teyssier R., Moore B., 2014, Mon. Not. R. Astron. Soc., 440, 2290
- McCarthy et al. (2010) McCarthy I. G., et al., 2010, Monthly Notices of the Royal Astronomical Society, pp 822–839
- McCarthy et al. (2017) McCarthy I. G., Schaye J., Bird S., Le Brun A. M., 2017, Mon. Not. R. Astron. Soc., 465, 2936
- McCarthy et al. (2018) McCarthy I. G., Bird S., Schaye J., Harnois-Deraps J., Font A. S., van Waerbeke L., 2018, Mon. Not. R. Astron. Soc., 476, 2999
- McClintock et al. (2019) McClintock T., et al., 2019, Astrophys. J., 872, 53
- Nishimichi et al. (2018) Nishimichi T., et al., 2018
- Rudd et al. (2008) Rudd D. H., Zentner A. R., Kravtsov A. V., 2008, Astrophys. J., 672, 19
- Sartoris et al. (2016) Sartoris B., et al., 2016, Mon. Not. R. Astron. Soc., 459, 1764
- Schaye & Dalla Vecchia (2008) Schaye J., Dalla Vecchia C., 2008, Mon. Not. R. Astron. Soc., 383, 1210
- Schaye et al. (2010) Schaye J., et al., 2010, Mon. Not. R. Astron. Soc., 402, 1536
- Springel (2005) Springel V., 2005, Mon. Not. R. Astron. Soc., 364, 1105
- Springel et al. (2001) Springel V., White S. D. M., Tormen G., Kau G., 2001, Mon. Not. R. Astron. Soc., 328, 726
- Stanek et al. (2009) Stanek R., Rudd D., Evrard A. E., 2009, Mon. Not. R. Astron. Soc. Lett., 394, L11
- Tinker et al. (2008) Tinker J., Kravtsov A. V., Klypin A., Abazajian K., Warren M., Yepes G., Gottlöber S., Holz D. E., 2008, Astrophys. J., 688, 709
- Tyson et al. (2003) Tyson J. A., Wittman D. M., Hennawi J. F., Spergel D. N., 2003, Nuclear Physics B - Proceedings Supplements, 124, 21
- Velliscig et al. (2014) Velliscig M., van Daalen M. P., Schaye J., McCarthy I. G., Cacciato M., Le Brun A. M., Vecchia C. D., 2014, Mon. Not. R. Astron. Soc., 442, 2641
- Wiersma et al. (2009a) Wiersma R. P. C., Schaye J., Smith B. D., 2009a, Mon. Not. R. Astron. Soc., 393, 99
- Wiersma et al. (2009b) Wiersma R. P. C., Schaye J., Theuns T., Dalla Vecchia C., Tornatore L., 2009b, Mon. Not. R. Astron. Soc., 399, 574
- van Daalen et al. (2014) van Daalen M. P., Schaye J., McCarthy I. G., Booth C. M., Vecchia C. D., 2014, Mon. Not. R. Astron. Soc., 440, 2997