Automated Mobility Context Detection with Inertial Signals
Abstract
Remote monitoring of motor functions is a powerful approach for health assessment, especially among the elderly population or among subjects affected by pathologies that negatively impact their walking capabilities. This is further supported by the continuous development of wearable sensor devices, which are getting progressively smaller, cheaper, and more energy efficient. The external environment and mobility context have an impact on walking performance, hence one of the biggest challenges when remotely analysing gait episodes is the ability to detect the context within which those episodes occurred. The primary goal of this paper is the investigation of context detection for remote monitoring of daily motor functions. We aim to understand whether inertial signals sampled with wearable accelerometers, provide reliable information to classify gait-related activities as either indoor or outdoor. We explore two different approaches to this task: (1) using gait descriptors and features extracted from the input inertial signals sampled during walking episodes, together with classic machine learning algorithms, and (2) treating the input inertial signals as time series data and leveraging end-to-end state-of-the-art time series classifiers. We directly compare the two approaches through a set of experiments based on data collected from 9 healthy individuals. Our results indicate that the indoor/outdoor context can be successfully derived from inertial data streams. We also observe that time series classification models achieve better accuracy than any other feature-based models, while preserving efficiency and ease of use.
digital mobility, context detection, inertial sensors, IMU, gait descriptors, time series classification
1 Introduction
The widespread availability of inexpensive wearable sensor technologies means that measurement of motor function, particularly gait, on an ongoing basis in the home and community setting is easier than ever before [2], [32]. This offers enormous potential in the continuous assessment of gait as people move throughout their daily lives, providing accurate and objective measurements of real-world motor performance and the deep insights into health status that this brings.
However, this opportunity comes with some significant challenges, one of which is the issue of being able to identify the context within which walking occurred. Previous research has demonstrated that gait performance changes in different contexts, even in young healthy adults [17], [24]. This has noteworthy implications for the measurement and interpretation of real-world walking in clinical populations [21]. If we can identify the context for walking performance, it can provide insights into the specific intrinsic and extrinsic factors that can adversely affect gait in clinical populations, leading to informed interventions. For example, identifying the extrinsic factors that lead to deterioration of gait in the elderly population can lead to recommendations for specific remedial strategies to reduce risk of falling [26]. It is clear, then, that understanding context is critical in our interpretation of data related to real-world walking. The challenge in practical implementation is that of identifying context in an unobtrusive manner, without impacting on the privacy of the individual, or their quality of life. Different approaches to context identification have been implemented in the past. Smeaton et al. [31] used small wearable cameras to capture images that were subsequently used as the basis of a context annotation model. This was successful from a technical perspective but has obvious disadvantages from a data processing and privacy standpoint, to the point that it is not a feasible option. Other approaches have involved use of data from GPS sensors [13], which also suffers from drawbacks such as battery duration, privacy management, and poor indoor availability.
In this context, wearable sensors, or Inertial Measurement Units (IMU), offer a number of advantages when compared with other technologies. They are inexpensive, built for ease-of-use, and bear a significantly reduced impact on the users’ privacy. They measure physical quantities such as the body’s acceleration and angular velocity, that come in the form of streams of continuous values sampled at a fixed frequency [10]. The core challenge we face, then, is to understand whether it is possible to extract mobility context only relying on IMU signals. The most straightforward approach to this task involves the extraction of a number of descriptors from the sampled inertial signals. These features, often called Digital Mobility Outcomes (DMO), are highly specialized for gait-related activities, and can be used to train a variety of learning models. Examples of DMOs are the number of steps, the length and duration of a walking episode, and the gait asymmetry. DMOs can be used for different tasks related to human movement analysis, including distinction between recreational and utilitarian walking [15] and identification of pathological gait patterns[25]. Whilst DMOs are easy to interpret, algorithms that extract them often require fine tuning and meticulous scrutiny in order to avoid cherry-picking and ensure their generalization capability.
A different strategy for IMU context identification is based on more generic Time Series Classification (TSC) methods. As the inertial signals obtained from IMUs are sequential values sampled at a constant rate, they constitute a set of time series. This type of data is ubiquitous and, therefore, studied across many research fields [1]. TSC models do not require any manual feature engineering steps, and can easily adapt to different applications and contexts. The goal of this study is then to explore the task of automated context detection from digital mobility data, that is, to understand whether contextual information can be extracted directly from inertial signals without the need for geographical localization. Specifically, we aim to answer the following two questions:
-
1.
Is it possible to extract indoor/outdoor contextual information from inertial streams sampled during gait-related activity, without the use of GPS data?
-
2.
How do feature-based approaches compare with TSC models in the task of indoor/outdoor context detection?
In this study, we analyse some of the recent advances in the development of highly accurate and scalable machine learning algorithms for TSC and focus on their application to context detection from IMU signals. We propose a new methodology for context detection from IMU data, and empirically evaluate different modeling approaches and algorithms for this task. In particular, we compare classifiers that only use the raw IMU signal, to those that use extracted domain-specific features (i.e., DMOs). We study different modeling approaches for working with IMU data at different levels of granularity, such as generic, unrestricted signal windows, or specific gait episodes and walking bouts. Ultimately, we show that TSC methods achieve better performance than feature-based models in terms of classification accuracy, and also prove to be more flexible from an application standpoint as they do not rely on static, shallow feature sets that may not necessarily be available throughout the full length of an inertial stream.
The rest of this paper is organized as follows: Section 2 introduces the topic of context detection for gait activity and provides a broad overview of the most common TSC algorithms. Section 3 contains a detailed description of the data collected and used for this study, as well as the processing pipeline required to produce datasets, annotations, and class labels. A description of our empirical study is provided in Section 4, while Section 5 and Section 6 provide a detailed analysis and discussion of results, respectively, alongside a discussion on limitations of this study. Final remarks are given in Section 7.
2 Related Work
2.1 Digital Mobility and Context Detection
A DMO is an objective quantity measurable through specific processing of inertial signals, that can be used as a proxy descriptor for gait-related physical activities [16]. DMOs represent useful features to characterize walking and assess mobility performance. In reference [9], physical activities of daily-living are monitored in a group of participants affected by Parkinson’s Disease using tri-axial accelerometers, and corresponding DMOs are computed. Reported results show how reduced mobility relates to an increased severity of motor symptoms, which in turn reflects on the measured DMOs. Most importantly, self-reported mobility metrics oftentimes do not match with digitally assessed mobility outcomes. In a different study [15], a small set of DMOs is used to classify walking episodes as either recreational or utilitarian. The authors show how duration, intensity, speed, built environment characteristics and location, and time distributions of walking bouts, can be sufficient to determine the purpose of a walking episode. Experimental results are detailed for 651 participants, each one providing data collected with a single uni-axial IMU over a period of 7 days.
The concept of DMO is, however, still relatively young in the literature, and just recently DMOs started being adopted in clinical trials as a tool for remote mobility monitoring. In particular, the Mobilise-D consortium strives to develop protocols for validation and approval of digital biomarkers with clinical potential among cohorts of patients affected by Parkinson’s disease, multiple sclerosis, chronic obstructive pulmonary disease, and recovering from proximal femoral fracture [27]. The authors outline a structured roadmap whose ultimate goal is to design healthcare standards for DMO adoption in mobility assessment. In this regard, a reviewing protocol is suggested in reference [25].
In more recent work, Del Din et al. [4] offer a systematic review of studies concerned with Body-Worn Sensors (BWS) used in conjunction with DMOs to detect and quantify Parkinson’s disease motor symptoms and dysfunctions such as tremors, bradykinesia, dyskinesia, postural instability and others. The authors show how DMOs are regarded to be an effective and powerful tool for the remote monitoring of physical activities and performance. Nonetheless, most DMOs lack technical and clinical validity, as the corresponding algorithms have often been designed and tested only in controlled environments. Moreover, it is still not clear how well DMO-extracting techniques scale to unseen clinical cohorts, new sampling hardware or unexpected operational conditions. Recent work on time series classification has shown that models relying only on raw signals significantly outperform feature-based approaches [5], thus in the next section we give a general introduction of the state of the art for time series classification.
2.2 Time Series Classification
Research on time series classification develops rapidly and a number of effective classification methods have been proposed recently [1]. Traditionally, distance-based classification using nearest neighbours is considered a strong baseline strategy. Dynamic Time Warping [7] (DTW) is an elastic distance measure proposed as an alternative to the Euclidean distance, that is capable of detecting spatial and temporal distortions in time series and yields robust classification results when used to train 1-NN models [33]. A different approach is the transposition of time series into more compressed and interpretable feature spaces. Catch-22 [20] is a proposed set of 22 heterogeneous features selected from the wider group of 4791 hctsa features [8], that results in a classification accuracy drop of 7% for a gain in speed, on a group of 93 evaluated datasets.
Another family of classification models, relies on symbolic representation and approximation of time series. Algorithms such as SAX [18] and SFA [29] can be used to compress continuous time series into discrete and more compact alphabets. This, in turn, allows for an easier identification of recurring patterns and words. WEASEL [30] leverages multi-resolution SFA approximation to select statistically significant features, used in a second stage to train a linear model. Similarly, MrSEQL [22] generates a wide variety of features using both SAX and SFA, and then uses the SEQL algorithm [12] to efficiently select the best performing features. MrSEQL allows to train a single linear model, or an ensemble of models.
More recently, ROCKET [5], a novel kernel-based classification method, set the new state-of-the-art for non-ensemble TSC. ROCKET produces a number of features based on the convolutional product between the target time series and random shapelets, or kernels. The generated features are then used to train a linear model. ROCKET’s latest extension, the MiniROCKET algorithm[6], further improved the feature generation process, by drastically reducing the kernel space. MiniROCKET is currently the fastest non-ensemble classification method for time series classification, with accuracy comparable to many other existing and more complex methods.
3 Data Sources and Aggregation
The Mobilise-D project relies on data collected by a consortium of 5 universities and research centres. Each centre is responsible for recruiting participants across different clinical cohorts, and collecting heterogeneous datasets in different scenarios [27].
For the data collection phase, participants were instructed to wear a triaxial IMU for a period of time of around 2.5 hours. The IMU, worn on the lower back and kept in place by a neoprene sleeve, samples acceleration and angular velocity of the subject’s body with a frequency of 100 Hz. During the same time period, a mobile application is responsible for recording the GPS coordinates of the participant’s location. The application is installed on the participant’s mobile device, and synced with the IMU, prior to the beginning of data collection. During the 2.5 observation hours, participants are in a free-living environment, however, they are suggested a set of indoor and outdoor activities that may be integrated in their regular routine. Proposed activities are selected among common daily tasks, such as go to the kitchen and get a beverage, or go outside and take a short stroll in front of your house.
3.1 Contextual Labeling
The raw GPS coordinates collected during the 2.5 hour observation period need to be aggregated into high-level ground truth labels that characterize the subjects’ activity context. A multi-tier processing framework based on OpenStreetMap [11] (OSM) and a Solr database, is responsible for producing staypoints, that are, locations where subjects spend an extended amount of time without changing their position significantly. Staypoints are detected by either accounting for the absence of GPS data, that usually indicates that the phone does not attempt to acquire location updates as GPS coordinates are deemed stationary, or applying distance and time thresholds to groups of proximate consecutive GPS coordinates, hence defining candidate staypoints as centroids of spacial and temporal clusters. Activities performed sufficiently close to a staypoint are labelled as indoor, whilst activities performed away from any staypoint are defined as outdoor. The result of aggregating GPS coordinates is then a set of binary labels, produced with a frequency of 1 Hz, that describe the context of the corresponding IMU signal. Each label represents the continuous probability of that particular activity being performed indoor (value of 1) or outdoor (value of 0).
3.2 Dataset Generation
The process of generating the datasets from the raw inertial signals is broadly depicted in Figure 1. The inertial signals sampled from the IMU are chunked into small, non-overlapping windows of fixed length. The length of the windows can be globally adjusted based on the desired model granularity. In this work we use 1 minute windows. The location probability values associated with each window are then isolated and aggregated, so that a unique ground truth class label is produced. The aggregation policy of the contextual probability values is based on the occurrence of the most frequent probability value across all the probabilities within a window (i.e., we use a type of majority voting to extract the indoor/outdoor class label of a given window).
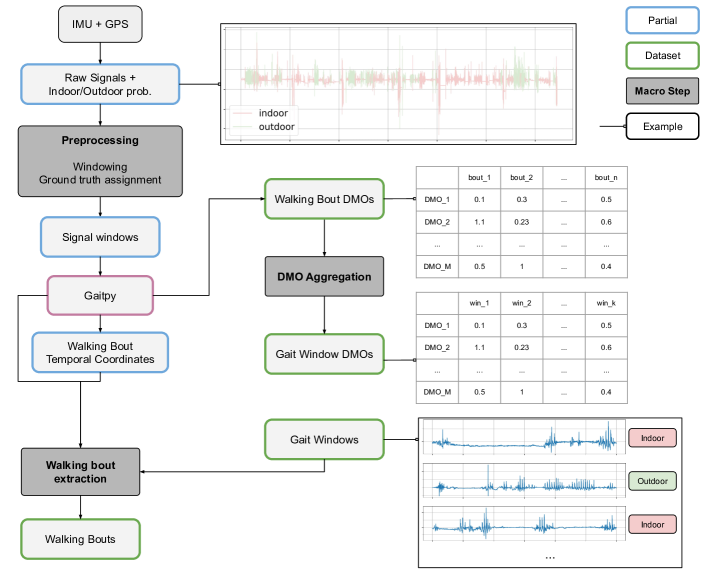
Once the full dataset of windows, with the corresponding contextual ground truth labels, are extracted from the raw 2.5 hour data, further filtering is applied to detect all those windows that do not contain any gait-related activity. This is achieved by analysing individual windows and extracting their DMOs. Mobility descriptors can be extracted from the vertical component of the raw inertial signal sampled by the IMU sensor. For this task, we adopted a state-of-the-art tool named Gaitpy [3]. Gaitpy is an open-source package that allows both the detection of walking bouts within an inertial signal, and the extraction of a number of DMOs from regions of interest. Specifically, Gaitpy works in a 2-stage process. It firsts chunks the raw vertical acceleration signal into non-overlapping windows of 3 seconds of duration, or epochs, that are classified as gait or non-gait using pre-trained machine learning models. After that, the generated predictions are used to detect walking bouts, if any, and DMOs are computed. Gaitpy isolates walking cycles for every detected bout, and returns the following features: number of steps, step duration and step duration asymmetry, step length and step length asymmetry, stride length and stride length asymmetry, stride duration and stride duration asymmetry, cadence, initial and terminal double support with asymmetry, single limb support and single limb support asymmetry, stance and stance asymmetry, swing and swing asymmetry, gait speed. An example of a window containing different walking bouts is shown in Figure 2(a), where Gaitpy correctly isolates the 3 different gait events highlighted in the red boxes. With this setup, 2 different groups of datasets can be produced from the raw acceleration signals.
-
•
Tabular DMO datasets: DMOs extracted with Gaitpy always relate to individual walking bouts. As most windows contain more than one walking bout, DMOs can either be collected at a walking bout level or aggregated for every window. DMO aggregation is performed by summing the number of step for all the bouts in every window, and averaging the rest of the descriptors.
-
•
Inertial signal datasets: these 2 datasets contain the raw inertial signals sampled from the IMUs, where each data point is either a full 1 minute window, or a walking bout extracted using the temporal coordinates produced by Gaitpy (as shown in Figure 2(b)).
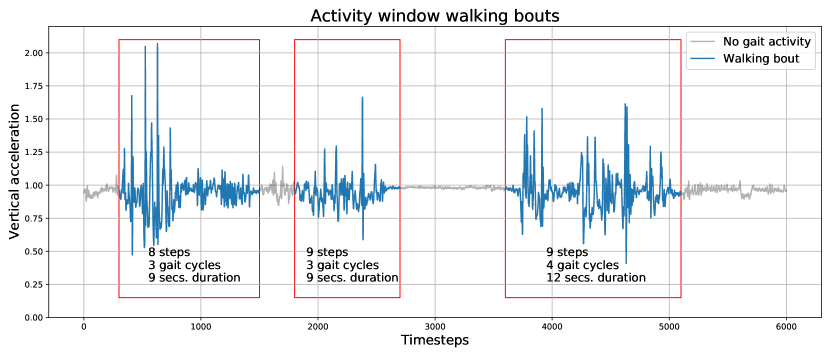
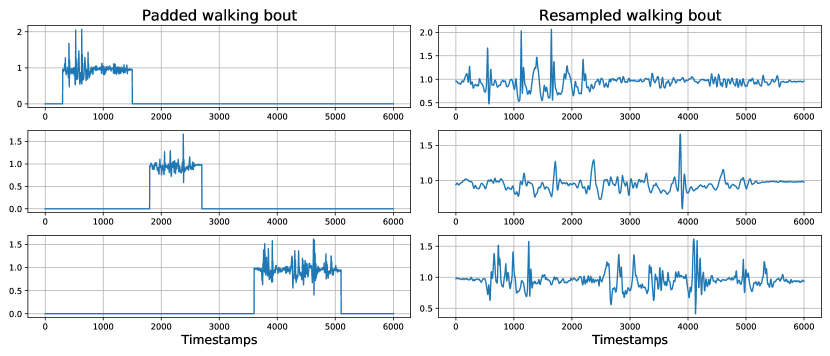
Table 1 contains a compendium of the datasets described above. Data are obtained from a total of 9 participants, recruited across 3 different research centres. All participants are healthy adults, hence they are not affected by any conditions that may impact the quality or quantity of their activities. A total of 1075 windows were generated, distributed as 805 indoor windows and 270 outdoor windows. This includes all the windows from the 2.5 hour data for which a contextual label was available. Windows for which DMOs were available sum up to 311, distributed as 241 indoor windows and 70 outdoor windows. These windows are a subset of the 1075 initial windows. A total of 434 walking bouts is extracted from the 311 DMO windows, distributed as 340 indoor bouts and 94 outdoor bouts. Walking bouts have variable duration, bounded to a maximum of 60 seconds (that is, the duration of the enclosing window).
| subject | wins. | indoor | outdoor | DMO wins. | indoor | outdoor | bouts | indoor | outdoor |
|---|---|---|---|---|---|---|---|---|---|
| 1 | 183 | 176 | 7 | 64 | 64 | 0 | 91 | 91 | 0 |
| 2 | 64 | 33 | 31 | 11 | 4 | 7 | 14 | 4 | 10 |
| 3 | 194 | 0 | 194 | 52 | 0 | 52 | 70 | 0 | 70 |
| 4 | 4 | 0 | 4 | 1 | 0 | 1 | 1 | 0 | 1 |
| 5 | 179 | 179 | 0 | 65 | 65 | 0 | 89 | 89 | 0 |
| 6 | 69 | 69 | 0 | 26 | 26 | 0 | 42 | 42 | 0 |
| 7 | 177 | 176 | 1 | 55 | 55 | 0 | 80 | 80 | 0 |
| 8 | 180 | 147 | 33 | 32 | 22 | 10 | 42 | 29 | 13 |
| 9 | 25 | 25 | 0 | 5 | 5 | 0 | 5 | 5 | 0 |
| 1075 | 805 (.749) | 270 (.251) | 311 | 241 (.775) | 70 (.225) | 434 | 340 (.783) | 94 (.217) |
4 Experimental Setup
The primary focus of this study is to compare the classification accuracy of machine learning algorithms which use raw inertial signals as input data, against those that use gait descriptors as explicitly extracted domain features, for the task of context detection. For this purpose, we design and run 4 different experimental campaigns, obtained as combinations of the target datasets and the classification techniques. A global overview of the conducted experiments is outlined in Table 2.
| DMO windows | walking bouts | |||||||||||||||
|---|---|---|---|---|---|---|---|---|---|---|---|---|---|---|---|---|
| DMOs |
|
|
||||||||||||||
| raw signal |
|
|
4.1 Raw Signal Classification
Windows and walking bouts can be classified using the IMU raw signals, or any other time-dependant quantity derived from acceleration and angular velocity. Leveraging on inertial signals for context detection allows to train classification models that do not require overly engineered feature sets, and can be tuned by tweaking few hyperparameters. For this experimental campaign, we decided to focus on end-to-end univariate time series classification methods. Hence, two different signals are separately extracted and evaluated:
-
•
the vertical component of the acceleration (which is the same acceleration component used by Gaitpy to extract DMOs)
-
•
the acceleration magnitude, computed as:
Whilst windows always have the same length of one minute, corresponding to 6000 data points sampled at 100 Hz, walking bouts may differ in duration. As some of the evaluated classification methods are not able to work with variable-length data [5], [22], walking bouts shorter than 6000 points can either be padded with leading and trailing zeros until they all reach the same length, or upsampled to the required length (see Figure 2). Walking bouts of different length, thus respecting their original time amplitude, can be handled by MrSEQL.
The target time series models evaluated here, and presented in Section 2, are ROCKET and its variant MiniROCKET, the strong baseline 1nn-DTW, the symbolic linear classifiers WEASEL, and MrSEQL. The popular Python sktime library [19] was used for their practical implementation. The configuration setup and parameters for each algorithm are highlighted in Table 3. It is worth mentioning that most of the parameters were left configured to their default values as recommended in the original studies which proposed these algorithms, as the target of the study is the comparison of TSC techniques against classification based on gait descriptors (i.e., feature-based models). A classical stratified 5-fold cross-validation protocol is used for performance evaluation.
4.2 DMO-based Classification
| Algorithm | training configuration | |||
|---|---|---|---|---|
| ROCKET |
|
|||
| MiniROCKET |
|
|||
| 1-nn DTW |
|
|||
| WEASEL |
|
|||
| MrSEQL |
|
|||
| Logistic Regression |
|
|||
| Random Forest |
|
|||
| KNN |
|
|||
| SVM | - RBF kernels | |||
| Ridge Regression |
|
As illustrated in Section 3.2, a number of DMOs can be extracted from signal windows where gait-related activity is present. DMOs can then be used as input features to train feature-based learning models. For our experimental campaign, we adopt 6 common classifiers, namely, Logistic Regression (Logistic), Random Forest (RndForest), K-nearest neighbors (KNN), Support Vector Machine (SVM), Gaussian Naive Bayes (GNB), and Ridge Regression (Ridge). Table 3 contains the parameters that are used to configure these models during the experiments. Similarly to the TSC campaign, DMO classifiers are evaluated using a stratified 5-fold cross-validation policy.
5 Results
The classification results for context detection of activity windows, are outlined in Table 4 and Table 5, for the feature-based methods and the TSC methods respectively. Reported metrics include accuracy, precision, recall and F1-score. ROCKET and MrSEQL achieved the best classification accuracy (), with reasonable precision and recall scores that suggest no overfitting towards the indoor majority class. Feature-based models did not show the same behaviour, as SVM presents the highest accuracy value of 77.4% (in the case of non-normalized features) paired with a F1-score of 43.6%. All these models, with the exception of the Logistic Classifier, fall within the same accuracy range, however, GNB shows the best precision and recall scores across the board. Feature normalization does not seem to have a significant impact on the models. Logistic Regression shows an accuracy and F1 improvement of 4% when normalized features are used, and KNN and SVM display the opposite behaviour for accuracy, but similar fro F1. Random Forest, GNB and Ridge Regression were not affected by the feature scale. In a similar fashion, the choice of signal between the vertical acceleration and the magnitude for the TSC classifiers results in a marginal performance difference. The main observation from these experiments is that there is a very significant gap between the feature-based models (F1: 61.3%) and the TSC models (F1: 98.0%).
| model | norm. | accuracy | precision | recall | F1-score |
|---|---|---|---|---|---|
| Logistic | z-score | 66.2 3.6 | 60.6 4.2 | 64.5 6.3 | 60.0 4.3 |
| Logistic | - | 62.0 3.8 | 58.0 4.8 | 61.3 6.9 | 56.6 4.8 |
| RndForest | z-score | 76.8 2.2 | 65.3 7.6 | 56.1 2.1 | 56.1 2.7 |
| RndForest | - | 76.8 2.2 | 65.3 7.6 | 56.1 2.1 | 56.1 2.7 |
| KNN | z-score | 75.8 3.1 | 62.1 6.5 | 57.0 3.7 | 57.6 4.5 |
| KNN | - | 76.2 5.9 | 64.8 14. | 55.2 6.0 | 55.5 7.1 |
| SVM | z-score | 76.5 1.5 | 38.6 0.2 | 49.3 0.9 | 43.3 0.4 |
| SVM | - | 77.4 0.1 | 38.7 0.0 | 50.0 0.0 | 43.6 0.0 |
| GNB | z-score | 72.3 9.3 | 63.1 6.7 | 62.3 6.2 | 61.3 7.5 |
| GNB | - | 72.3 9.3 | 63.1 6.7 | 62.3 6.2 | 61.3 7.5 |
| Ridge | z-score | 76.2 1.6 | 38.5 0.1 | 49.1 1.1 | 43.2 0.5 |
| Ridge | - | 76.2 1.6 | 38.5 0.1 | 49.1 1.1 | 43.2 0.5 |
| model | signal | accuracy | precision | recall | F1-score |
|---|---|---|---|---|---|
| ROCKET | v. acc. | 98.7 2.8 | 98.5 3.1 | 97.6 5.2 | 98.0 4.3 |
| ROCKET | mag. | 98.4 3.5 | 97.8 4.7 | 97.4 5.7 | 97.6 5.2 |
| miniROCKET | v. acc. | 89.3 5.3 | 89.6 8.3 | 79.4 9.9 | 82.3 9.5 |
| miniROCKET | mag. | 90.3 3.8 | 88.5 5.1 | 82.6 6.9 | 84.8 6.2 |
| 1-nn DTW | v. acc. | 65.9 5.1 | 42.8 6.9 | 44.5 5.1 | 43.1 5.4 |
| 1-nn DTW | mag. | 69.4 4.4 | 51.9 6.5 | 51.3 4.3 | 50.8 4.8 |
| WEASEL | v. acc. | 79.4 6.6 | 73.6 10. | 70.8 12. | 70.7 13. |
| WEASEL | mag. | 81.0 4.6 | 79.1 7.9 | 75.9 8.1 | 75.2 7.1 |
| MrSEQL | v. acc. | 96.1 8.5 | 95.9 9.1 | 93.6 14. | 94.1 13. |
| MrSEQL | mag. | 95.5 9.9 | 97.6 5.2 | 91.7 18. | 91.6 18. |
Table 6 and Table 7 show the classification results on the walking bout dataset, for feature-based methods and TSC methods respectively. The reported metrics for this dataset are aligned with the window dataset results previously discussed, in terms of both performance gap between the two method groups, and sensitivity to feature scale and input signals. In the TSC group, walkin bouts are either padded or resampled so that they all have the same length. Once again, MrSEQL and ROCKET are the best performing models all-around, with the latter being slightly more consistent in terms of precision and recall. Padding seems to be the ideal strategy to manage bout length, while choosing vertical acceleration or magnitude has a very limited impact on the model performance.
| walking bouts | |||||
|---|---|---|---|---|---|
| model | norm. | accuracy | precision | recall | F1-score |
| Logistic | z-score | 64.0 4.7 | 58.4 4.0 | 61.6 5.5 | 57.4 4.5 |
| Logistic | - | 61.9 4.6 | 58.7 3.3 | 62.6 4.9 | 56.8 4.0 |
| RndForest | z-score | 77.4 1.0 | 62.5 3.6 | 54.7 2.5 | 54.0 3.9 |
| RndForest | - | 77.4 1.5 | 62.9 2.9 | 54.8 1.6 | 54.2 3.1 |
| KNN | z-score | 75.3 3.0 | 59.6 6.8 | 56.1 4.4 | 56.5 5.2 |
| KNN | - | 76.2 2.9 | 59.5 10. | 53.6 3.5 | 53.0 4.8 |
| SVM | z-score | 77.6 1.0 | 45.8 15. | 50.3 2.4 | 45.4 4.2 |
| SVM | - | 78.3 0.4 | 39.1 0.2 | 50.0 0.0 | 43.9 0.1 |
| GNB | z-score | 75.5 3.8 | 64.8 4.6 | 65.5 5.2 | 64.9 4.8 |
| GNB | - | 75.5 3.8 | 64.8 4.6 | 65.5 5.2 | 64.9 4.8 |
| Ridge | z-score | 76.9 1.7 | 42.4 7.5 | 49.4 1.3 | 44.3 2.0 |
| Ridge | - | 76.9 1.7 | 42.4 7.5 | 49.4 1.3 | 44.3 2.0 |
| model | series lenght | signal | accuracy | precision | recall | F1-score |
|---|---|---|---|---|---|---|
| ROCKET | pad | v. acc. | 94.7 3.6 | 95.5 4.8 | 88.5 6.8 | 91.4 6.2 |
| ROCKET | pad | mag. | 96.0 3.6 | 96.4 4.7 | 91.7 6.7 | 93.7 6.0 |
| ROCKET | resample | v. acc. | 92.8 2.5 | 94.5 2.7 | 84.2 5.7 | 87.9 4.9 |
| ROCKET | resample | mag. | 96.0 3.2 | 97.0 3.2 | 91.3 6.6 | 93.6 5.4 |
| miniROCKET | pad | v. acc. | 87.3 2.1 | 85.2 4.3 | 74.9 3.5 | 78.3 3.6 |
| miniROCKET | pad | mag. | 86.1 1.7 | 83.8 3.9 | 72.3 2.3 | 75.8 2.8 |
| miniROCKET | resample | v. acc. | 90.5 1.7 | 90.5 3.6 | 81.1 5.4 | 84.2 3.8 |
| miniROCKET | resample | mag. | 91.0 2.4 | 90.7 5.5 | 81.8 3.8 | 85.2 4.1 |
| 1-nn DTW | pad | v. acc. | 59.9 4.0 | 49.1 2.1 | 49.0 2.9 | 48.3 2.4 |
| 1-nn DTW | pad | mag. | 58.0 3.0 | 49.4 1.7 | 49.3 2.4 | 48.2 1.8 |
| 1-nn DTW | resample | v. acc. | 46.1 5.9 | 55.2 5.1 | 56.3 6.6 | 44.5 5.1 |
| 1-nn DTW | resample | mag. | 43.7 5.7 | 55.7 4.4 | 56.8 5.5 | 43.0 5.3 |
| WEASEL | pad | v. acc. | 82.9 7.4 | 83.8 11. | 70.2 5.4 | 71.9 6.8 |
| WEASEL | pad | mag. | 83.4 6.2 | 81.5 11. | 70 4.4 | 72.5 5.8 |
| WEASEL | resample | v. acc. | 81.3 6.5 | 73.8 7.2 | 72.1 6.8 | 72.3 7.5 |
| WEASEL | resample | mag. | 84.3 2.9 | 78.3 5.1 | 72.9 7.8 | 74 7.6 |
| MrSEQL | pad | v. acc. | 97.7 5.1 | 98.7 2.8 | 94.7 11. | 95.7 9.5 |
| MrSEQL | pad | mag. | 97.4 5 | 98.5 2.8 | 94.2 11. | 95.4 9.3 |
| MrSEQL | resample | v. acc. | 95.8 9.2 | 97.9 4.6 | 90.5 21. | 89.8 22. |
| MrSEQL | resample | mag. | 95.6 9.7 | 92.8 15. | 90.3 21. | 89.7 23. |
| MrSEQL | original | v. acc. | 89.4 2.6 | 94.1 1.3 | 75.6 6 | 80.2 6.2 |
| MrSEQL | original | mag. | 90.8 2 | 93.9 2.1 | 79.1 4.6 | 83.6 4.2 |
6 Discussion
The ultimate goal of this paper is to understand whether inertial signals alone, sampled during gait-related activities, suffice for the task of indoor/outdoor context detection, retaining enough information so that GPS data are not needed. In relation to this first research question, results of the experiments on both the gait windows dataset and the walking bouts dataset, indicate that context can indeed be inferred from inertial movement descriptors, either using DMO-features extracted from the raw signals or the raw signals themselves, without further inclusion of geographical coordinates. This suggests that the contextual environment in which gait episodes occur, has an impact on the subjects’ walking quality, most likely caused by the difference in terrain, footwear, weather conditions, and motion utility.
Our secondary objective was to understand how classical feature-based methods, trained with DMOs extracted from the raw signals, compare with TSC methods on the context detection task. The most interesting finding to emerge from the experimental results in Section 5 is that time series models greatly outperform feature-based models, regardless of the target metric and dataset. TSC learners achieve high accuracy and are proven to be more versatile as they can be used to classify any type of signal. In fact, many of the labeled windows extracted from the data had to be discarded as DMOs could not be extracted (no gait detected by Gaitpy), but they can still be classified if treated purely as time series. The performance gap between the two types of methods can be explained in part by the fact that DMOs represent a limited set of shallow features, whilst most TSC algorithms are based on data transformation steps that result into rich, context-based descriptors. This allows the identification of hidden or underlying patterns in the signals that may otherwise go unnoticed.
6.1 Limitations
The results obtained during this work are encouraging and seem to suggest that context can effectively be inferred from inertial signals sampled during walking activities. However, a number of limiting aspects of this work should be further discussed, that may prompt interesting starting points for future studies.
Class Imbalance and Validation
The target datasets used for this study suffer from a severe class imbalance, as the majority indoor class constitutes 75-78% of the total data points, depending on the dataset. Moreover, the class imbalance is even more severe across subjects, as only 3 participants out of 9 contribute with a significant amount of outdoor activities. This poses a non-trivial limitation to the validation protocols that can be used. The most common choice in this sense, is the Leave-One-Subject-Out (LOSO) cross-validation protocol [14], where folds for the cross-validation process are designed based on the participants in the dataset. This ensures that each participant is independently used as validation set only once, and no positive bias is introduced in the models. In order to ensure that our experimental results are not affected by subject overfitting, we conducted 3 separate training campaigns for our best-performing models: one based on fully fledged LOSO cross-validation (9 splits), and two based on custom splits where subjects do not simultaneously appear in the train set and in test set. Custom splits were designed prior to the training process. In all these campaigns, the performance of the models did not deteriorate significantly in terms of classification accuracy and F1-score, while standard deviation for all the registered metrics marginally increased. This suggests that the results presented in Section 5 are not obtained by models that merely learned the target subjects rather than the underlying patterns of the sampled walking activities.
Interpretability
Context inference for gait-related activities is set to provide insights on human movement that may potentially be used as diagnostic and clinical indicators. Therefore, it is paramount for models that compute said insights to be interpretable, and to offer simple explanations on how activities are classified.
In this regard, feature-based classifiers that leverage activity DMOs are easily interpretable, as mobility outcomes are simple descriptors that measure natural gait quantities, such as number of steps, cadence, or stride. In order to better understand how DMOs impact the final decisions of our feature-based models, we evaluated the feature importance scores for the Logistic Regression and the Ridge Regression models. Not surprisingly, only a subset of DMOs have a significant impact on the final model predictions: while in most cases step duration, step length, and swing asimmetry are primary indicators of indoor walking, the number of steps, stride length, and swing are mainly used to predict the outdoor class.
Whilst tabular models have straightforward and intuitive interpretation techniques such as feature importance scores, explainability for TSC methods is a broader and more novel topic, that is recently gaining traction and attention in the context of Explainable Artificial Intelligence [28]. The most straightforward approach to interpret the decisions made by a TSC model is to use saliency maps [23], a visual tool that highlights important regions within a target time series, that significantly contribute to the final model predictions. In contrast with feature importance, saliency maps rely on vectors of weights that are assigned to every point in a given series. In this study, we briefly tested MrSEQL-SM [22] using the MrSEQL trained models. Detailed results on interpretation are out of the scope of this study, but we find this a worthile topic for further study in future work.
7 Conclusions
In this paper, we proposed a novel methodology for automated context detection from raw inertial signals, as an effective tool for describing human mobility data. We also presented a detailed empirical study concerned with the application of recent state-of-the-art TSC algorithms to the problem of context detection, and we compared their performance with more classical feature-based models relying on extracted mobility descriptors (DMOs). Our experiments were based on inertial data collected from 9 healthy individuals, annotated with metadata representing contextual ground-truth labels. Both TSC methods and DMO-based methods were tested, and ultimately, we showed that automated context detection can effectively be achieved with very high accuracy using only raw inertial signals, without the need for complex gait descriptor features.
While we obtained very promising results, we consider this study to be a detailed proof of concept, set to provide the basis for a more extensive work. Next, we aim to expand the cohort of target participants. This includes both the number of subjects involved in the data collection process, and the clinical conditions subjects may be affected from. In fact, within the Mobilise-D consortium, plenty of mobility data were collected from patients affected by Parkinson’s disease, multiple sclerosis, chronic obstructive pulmonary disease, and recovering from proximal femoral fracture.
Acknowledgment
This work was supported by the Mobilise-D project that has received funding from the Innovative Medicines Initiative 2 Joint Undertaking (JU) under grant agreement No. 820820. This JU receives support from the European Union’s Horizon 2020 research and innovation program and the European Federation of Pharmaceutical Industries and Associations (EFPIA). Content in this publication reflects the authors’ view and neither IMI nor the European Union, EFPIA, or any Associated Partners are responsible for any use that may be made of the information contained herein. This work was also supported by a grant from Science Foundation Ireland through the Insight Centre for Data Analytics (12/RC/2289_P2). For the purpose of Open Access, the authors have applied a CC BY public copyright licence to any Author Accepted Manuscript version arising from this submission.
As extensively discussed in Section 3.2, all the datsets in this study were generated from inertial signals containing gait activity. However, after windowing the raw signals and filtering the windows according to whether they include walking bouts or not, only 311 windows out of 1075 are left (see Table 1). This is necessary in order to make a direct comparison between feature-based methods and TSC methods. We further validated our experimental results by classifying the full window dataset, using TSC methods only. Results are presented in Table 8.
| model | signal | accuracy | precision | recall | f1-score |
|---|---|---|---|---|---|
| ROCKET | v. acc. | 93.6 5.3 | 83.1 9.5 | 86.4 9.5 | 86.4 9.5 |
| ROCKET | mag. | 90.5 6.6 | 75.4 8.0 | 79.1 9.1 | 79.1 9.1 |
| mROCKET | v. acc. | 88.4 2.4 | 88.7 4.6 | 79.6 3.1 | 82.8 3.5 |
| mROCKET | mag. | 89.3 2.1 | 89.4 3.0 | 81.4 3.6 | 84.3 3.3 |
| 1-nn DTW | v. acc. | 73.5 1.6 | 65.1 2.2 | 65.3 2.8 | 65.1 2.4 |
| 1-nn DTW | mag. | 78.1 1.8 | 70.6 2.8 | 68.5 2.6 | 69.3 2.7 |
| WEASEL | v. acc. | 54.5 25. | 64.9 12. | 64.5 11. | 51.2 24. |
| WEASEL | mag. | 78.8 7.0 | 74.6 7.6 | 76.9 4.7 | 74.5 6.4 |
| MrSEQL | v. acc. | 95.6 9.5 | 96.6 7.0 | 91.5 18. | 91.4 18. |
| MrSEQL | mag. | 95.1 10. | 93.8 13. | 90.7 20. | 90.1 21. |
Table 9 shows the results obtained on a set of custom validation splits, manually designed to ensure that our default 5-fold cross-validation policy does not introduce positive bias due to the inclusion, for each split, of data from the same participants in both the train set and the test set. With respect to the subject IDs indicated in Table 1, tested splits include 1) classical LOSO, resulting in 9 total splits, 2) 3-fold splitting, where the 3 test sets are composed with data from subject 2, subjects 3 and 5, and subject 8 respectively, and 3) 5-fold splitting, where the test sets are composed with data from subjects 1, 2, and 8, subjects 3 and 5, subjects 3 and 6, subjects 3 and 7, and subjects 4 and 9 respectively. For this experiment, we solely focused on the fastest and the best-performing models, nameky, ROCKET, miniROCKET, and the baseline 1-nn DTW. All custom splits were tested on the full window dataset, using vertical acceleration and acceleration magnitude.
| model | split | split | accuracy | precision | recall | f1-score |
|---|---|---|---|---|---|---|
| ROCKET | LOSO | v. acc. | 93.5 6.0 | 75.6 22 | 73.2 21 | 73.2 21. |
| ROCKET | LOSO | mag. | 86.1 15. | 63.5 20. | 55.5 21. | 57.6 19. |
| ROCKET | 3-fold | v. acc. | 84.7 19. | 87.4 15. | 83.0 18. | 81.6 22. |
| ROCKET | 3-fold | mag. | 84.2 18. | 88.2 13. | 82.8 18. | 80.7 22. |
| ROCKET | 5-fold | v. acc. | 91.8 15. | 89.7 20. | 89.4 20. | 89.1 20. |
| ROCKET | 5-fold | mag. | 91.2 12. | 87.5 19. | 87.9 19. | 87.5 19. |
| mROCKET | LOSO | v. acc. | 60.6 35. | 53.2 25. | 45.5 30. | 42.2 27. |
| mROCKET | LOSO | mag. | 61.8 30. | 51.5 23. | 42.4 27. | 44.4 25. |
| mROCKET | 3-fold | v. acc. | 53.3 3.9 | 49.2 21. | 49.8 4.0 | 40.1 5.5 |
| mROCKET | 3-fold | mag. | 60.2 9.9 | 63.0 8.6 | 53.9 3.3 | 47.4 9.8 |
| mROCKET | 5-fold | v. acc. | 52.6 19. | 37.8 8.3 | 48.1 2.4 | 35.2 8.8 |
| mROCKET | 5-fold | mag. | 55.2 17. | 62.3 9.8 | 52.3 1.4 | 40.5 11. |
| 1-nn DTW | LOSO | v. acc. | 54.3 27. | 44.5 16. | 38.4 23. | 36.0 16. |
| 1-nn DTW | LOSO | mag. | 57.4 30. | 45.7 16. | 39.3 24. | 37.3 17. |
| 1-nn DTW | 3-fold | v. acc. | 51.1 3.0 | 52.1 8.3 | 52.2 4.6 | 44.0 4.3 |
| 1-nn DTW | 3-fold | mag. | 64.8 8.0 | 62.7 9.0 | 57.7 3.4 | 55.5 1.5 |
| 1-nn DTW | 5-fold | v. acc. | 51.5 10. | 52.0 9.8 | 47.4 6.8 | 41.2 4.6 |
| 1-nn DTW | 5-fold | mag. | 51.4 17. | 55.4 13. | 49.1 17. | 45.4 13. |
References
- [1] Anthony J. Bagnall, Aaron Bostrom, James Large, and Jason Lines. The great time series classification bake off: An experimental evaluation of recently proposed algorithms. extended version. CoRR, abs/1602.01711, 2016.
- [2] L. C. Benson, C. A. Clermont, E. Bošnjak, and R. Ferber. The use of wearable devices for walking and running gait analysis outside of the lab: A systematic review. Gait Posture, 63:124–138, Jun 2018.
- [3] Matthew Czech and Shyamal Patel. Gaitpy: An open-source python package for gait analysis using an accelerometer on the lower back. J. Open Source Softw., 4(43):1778, 2019.
- [4] Silvia Del Din, Cameron Kirk, Alison J Yarnall, Lynn Rochester, and Jeffrey M Hausdorff. Body-worn sensors for remote monitoring of parkinson’s disease motor symptoms: Vision, state of the art, and challenges ahead. Journal of Parkinson’s disease, (Preprint):1–13.
- [5] Angus Dempster, François Petitjean, and Geoffrey I Webb. Rocket: Exceptionally fast and accurate time classification using random convolutional kernels. Data Mining and Knowledge Discovery, 2020.
- [6] Angus Dempster, Daniel F. Schmidt, and Geoffrey I. Webb. Minirocket: A very fast (almost) deterministic transform for time series classification. In Proceedings of the 27th ACM SIGKDD Conference on Knowledge Discovery & Data Mining, KDD ’21, page 248–257, New York, NY, USA, 2021. Association for Computing Machinery.
- [7] Hui Ding, Goce Trajcevski, Peter Scheuermann, Xiaoyue Wang, and Eamonn Keogh. Querying and mining of time series data: Experimental comparison of representations and distance measures. PVLDB, 1:1542–1552, 08 2008.
- [8] Ben D. Fulcher and Nick S. Jones. hctsa: A computational framework for automated time-series phenotyping using massive feature extraction. Cell Systems, 5(5):527–531.e3, 2017.
- [9] Irina Galperin, Talia Herman, Mira Assad, Natalie Ganz, Anat Mirelman, Nir Giladi, and Jeffrey M. Hausdorff. Sensor-based and patient-based assessment of daily-living physical activity in people with parkinson’s disease: Do motor subtypes play a role? Sensors, 20(24), 2020.
- [10] A. Godfrey, R. Conway, D. Meagher, and G. ÓLaighin. Direct measurement of human movement by accelerometry. Medical Engineering and Physics, 30(10):1364–1386, 2008. Special issue to commemorate the 30th anniversary of Medical Engineering and Physics.
- [11] Mordechai (Muki) Haklay and Patrick Weber. Openstreetmap: User-generated street maps. IEEE Pervasive Computing, 7(4):12–18, October 2008.
- [12] Georgiana Ifrim and Carsten Wiuf. Bounded coordinate-descent for biological sequence classification in high dimensional predictor space. In Proceedings of the 17th ACM SIGKDD International Conference on Knowledge Discovery and Data Mining, KDD ’11, page 708–716, New York, NY, USA, 2011. Association for Computing Machinery.
- [13] M. M. Jankowska, J. Schipperijn, and J. Kerr. A framework for using GPS data in physical activity and sedentary behavior studies. Exerc Sport Sci Rev, 43(1):48–56, Jan 2015.
- [14] Artur Jordão, Antonio C. Nazare Jr., Jessica Sena, and William Robson Schwartz. Human activity recognition based on wearable sensor data: A standardization of the state-of-the-art. CoRR, abs/1806.05226, 2018.
- [15] Bumjoon Kang, Anne V Moudon, Philip M Hurvitz, and Brian E Saelens. Differences in behavior, time, location, and built environment between objectively measured utilitarian and recreational walking. Transportation research part D: transport and environment, 57:185–194, 2017.
- [16] Felix Kluge, Silvia Del Din, Andrea Cereatti, Heiko Gaßner, Clint Hansen, Jorunn L Helbostad, Jochen Klucken, Arne Küderle, Arne Müller, Lynn Rochester, et al. Consensus based framework for digital mobility monitoring. PloS one, 16(8):e0256541, 2021.
- [17] Daniel B. Kowalsky, John R. Rebula, Lauro V. Ojeda, Peter G. Adamczyk, and Arthur D. Kuo. Human walking in the real world: Interactions between terrain type, gait parameters, and energy expenditure. PLOS ONE, 16(1):1–14, 01 2021.
- [18] Jessica Lin, Eamonn Keogh, Stefano Lonardi, and Bill Chiu. A symbolic representation of time series, with implications for streaming algorithms. In Proceedings of the 8th ACM SIGMOD Workshop on Research Issues in Data Mining and Knowledge Discovery, DMKD ’03, page 2–11, New York, NY, USA, 2003. Association for Computing Machinery.
- [19] Markus Löning, Anthony J. Bagnall, Sajaysurya Ganesh, Viktor Kazakov, Jason Lines, and Franz J. Király. sktime: A unified interface for machine learning with time series. CoRR, abs/1909.07872, 2019.
- [20] Carl Henning Lubba, Sarab S. Sethi, Philip Knaute, Simon R. Schultz, Ben D. Fulcher, and Nick S. Jones. catch22: Canonical time-series characteristics. CoRR, abs/1901.10200, 2019.
- [21] Ríona Mc Ardle, Silvia Del Din, Paul Donaghy, Brook Galna, Alan J Thomas, and Lynn Rochester. The impact of environment on gait assessment: Considerations from real-world gait analysis in dementia subtypes. Sensors, 21(3), 2021.
- [22] Thach Le Nguyen, Severin Gsponer, Iulia Ilie, Martin O’Reilly, and Georgiana Ifrim. Interpretable time series classification using linear models and multi-resolution multi-domain symbolic representations. CoRR, abs/2006.01667, 2020.
- [23] Thu Trang Nguyen, Thach Le Nguyen, and Georgiana Ifrim. A model-agnostic approach to quantifying the informativeness of explanation methods for time series classification. In Vincent Lemaire, Simon Malinowski, Anthony Bagnall, Thomas Guyet, Romain Tavenard, and Georgiana Ifrim, editors, Advanced Analytics and Learning on Temporal Data, pages 77–94, Cham, 2020. Springer International Publishing.
- [24] Matthew R Patterson, Darragh Whelan, Brenda Reginatto, Niamh Caprani, Lorcan Walsh, Alan F Smeaton, Akihiro Inomata, and Brian Caulfield. Does external walking environment affect gait patterns? In 2014 36th Annual International Conference of the IEEE Engineering in Medicine and Biology Society, pages 2981–2984, 2014.
- [25] Ashley Marie Polhemus, Ronny Bergquist, Magda Bosch de Basea, Gavin Brittain, Sara Catherine Buttery, Nikolaos Chynkiamis, Gloria dalla Costa, Laura Delgado Ortiz, Heleen Demeyer, Kirsten Emmert, Judith Garcia Aymerich, Heiko Gassner, Clint Hansen, Nicholas Hopkinson, Jochen Klucken, Felix Kluge, Sarah Koch, Letizia Leocani, Walter Maetzler, M Encarna Micó-Amigo, A Stefanie Mikolaizak, Paolo Piraino, Francesca Salis, Christian Schlenstedt, Lars Schwickert, Kirsty Scott, Basil Sharrack, Kristin Taraldsen, Thierry Troosters, Beatrix Vereijken, Ioannis Vogiatzis, Alison Yarnall, Claudia Mazza, Clemens Becker, Lynn Rochester, Milo Alan Puhan, and Anja Frei. Walking-related digital mobility outcomes as clinical trial endpoint measures: protocol for a scoping review. BMJ Open, 10(7), 2020.
- [26] B. Reginatto, K. Taylor, M. R. Patterson, D. Power, Y. Komaba, K. Maeda, A. Inomata, and B. Caulfield. Context aware falls risk assessment: A case study comparison. Annu Int Conf IEEE Eng Med Biol Soc, 2015:5477–5480, 2015.
- [27] Rochester L and Mazzà C and Mueller A and Caulfield B and McCarthy M and Becker C and Miller R and Piraino P and Viceconti M and Dartee WP and Garcia-Aymerich J et al. A roadmap to inform development, validation and approval of digital mobility outcomes: the Mobilise-D approach. Digital Biomarkers, 4:13–27, 12 2020. Accessed on 2021/07/14.
- [28] Rohit Saluja, Avleen Malhi, Samanta Knapic, Kary Främling, and Cicek Cavdar. Towards a rigorous evaluation of explainability for multivariate time series. CoRR, abs/2104.04075, 2021.
- [29] Patrick Schäfer and Mikael Högqvist. Sfa: A symbolic fourier approximation and index for similarity search in high dimensional datasets. In Proceedings of the 15th International Conference on Extending Database Technology, EDBT ’12, page 516–527, New York, NY, USA, 2012. Association for Computing Machinery.
- [30] Patrick Schäfer and Ulf Leser. Fast and accurate time series classification with WEASEL. CoRR, abs/1701.07681, 2017.
- [31] Alan F. Smeaton, James Lanagan, and Brian Caulfield. Combining wearable sensors for location-free monitoring of gait in older people. J. Ambient Intell. Smart Environ., 4(4):335–346, 2012.
- [32] Weixin Wang and Peter Gabriel Adamczyk. Analyzing gait in the real world using wearable movement sensors and frequently repeated movement paths. Sensors, 19(8), 2019.
- [33] Xiaoyue Wang, Hui Ding, Goce Trajcevski, Peter Scheuermann, and Eamonn Keogh. Experimental comparison of representation methods and distance measures for time series data. Data Mining and Knowledge Discovery, 26, 12 2010.