Multiscale reconstruction of porous media based on multiple dictionaries learning
Abstract
Digital modeling of the microstructure is important for studying the physical and transport properties of porous media. Multiscale modeling for porous media can accurately characterize macro-pores and micro-pores in a large-FoV (field of view) high-resolution three-dimensional pore structure model. This paper proposes a multiscale reconstruction algorithm based on multiple dictionaries learning, in which edge patterns and micro-pore patterns from homology high-resolution pore structure are introduced into low-resolution pore structure to build a fine multiscale pore structure model. The qualitative and quantitative comparisons of the experimental results show that the results of multiscale reconstruction are similar to the real high-resolution pore structure in terms of complex pore geometry and pore surface morphology. The geometric, topological and permeability properties of multiscale reconstruction results are almost identical to those of the real high-resolution pore structures. The experiments also demonstrate the proposal algorithm is capable of multiscale reconstruction without regard to the size of the input. This work provides an effective method for fine multiscale modeling of porous media.
keywords:
Porous media, Multiscale reconstruction, Multiple dictionaries learning, Multiscale pore structure1 Introduction
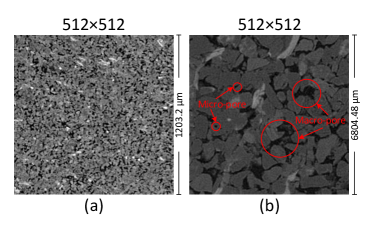
Numerical modeling, seepage simulation and physical properties analysis for core microstructure are important auxiliary means for oil and gas exploration and development [1, 2, 3, 4, 5, 6]. Accurate modeling of core 3D pore structure is of fundamental significance to the study of physical and transport properties [7, 8, 9, 10, 11]. The digital core [12, 13, 14, 15, 16, 17, 18, 19] is a popular technique for modeling 3D core pore structure, which can be obtained by imaging equipment, such as X-ray Computed Tomography (micro-CT). Generally, imaging equipment captures only a single length-scale core feature in a single imaging session. Moreover, due to the tradeoff between resolution and field of view (FoV), it is difficult to obtain high-resolution core images with large-FoV that simultaneously characterize macro-pores and micro-pores [20]. Figure 1 shows micro-CT images of the same core sample at different resolutions. The length-scale of (a) is 13.29, and (b) is 2.35, and the FoV of low-resolution image (a) is larger than that of high-resolution image (b). Macro-pores and the skeleton of pores are easily captured by low-resolution images (LRI). On the contrary, the high-resolution images (HRI) captures micro-pores and fine pore edges in addition to part of macro-pores. Compared with the high-resolution 3D pore model with large-FoV, whether 3D pore models based on LRI with large-FoV or HRI with small-FoV have limitations in describing the core structure. That is, on the one hand, HRI with small-FoV are insufficient to represent the whole core sample, and on the other hand, LRI with large-FoV lack high-scale pore features (micro-pores and fine pore edge). Although the physical properties of cores such as porosity and permeability are mainly determined by the macro-pores. Micro-pores, pore geometry and pore surface morphology are also affecting the adsorption and desorption of oil and gas [21, 22, 23]. Micro-pores and fine pore edges are also important for accurate modeling of pore structure. In conclusion, imprecise pore structure modeling may introduce errors in numerical simulation. The combination of LRI with large-FoV and HRI with small-FoV to build a fine multi-scale 3D pore structure model with large-FoV is of great significance to improve the accuracy of numerical simulation and seepage analysis.
Multiscale reconstruction [24, 25, 26, 27, 28] is a feasible way to model fine multi-scale 3D pore structures with large-FoV. In recent years, multiscale reconstruction has attracted tremendous attention of researchers. Yao et al [29] adopted the simulated annealing (SA) method to reconstruct the low-resolution 3D pore structure containing macro-pores, and Markov Chain Monte Carlo (MCMC) method to reconstruct the high-resolution 3D pore structure containing micro-pores, then superposed them to construct the multi-scale 3D pore structure. Marina V et al [30] proposed an image fusion method to convert CT images of different scales to the same resolution, and then superposed them to construct a multiscale soil structure model. Tabmasebi [31] used similarity mapping to determine the corresponding region of a small-size fine-scale image in a large-size coarse-scale image, and then adopted HPPYS algorithm to iteratively refine the coarse image to contain fine-scale information. Wu et al [22] proposed a multiscale modeling algorithm for complex rocks based on template matching, which fused different structural patterns into one image. Ji et al [32] adopted CCSIM-TSS algorithm to generate 3D pore structures based on different resolutions CT images, and proposed a multicomponent superposition algorithm to integrate 3D models of different components in shale. The above methods are committed to transform images of different resolutions (or scales) to the same resolution (or scale) by some technologies or algorithms, and construct multiscale model according to the designed superposition rule. However, some of them [30, 33] are difficult to avoid errors caused by the overlap of pores or phases in images at different scales in the complicated superposition process, even with the corresponding improvement. In addition, there are methods (such as [22, 25, 31]) that mainly deal with 2D images. First, the corresponding regions of the small-scale image in the large-scale image are matched, and then the reconstruction algorithm is used to reconstruct other regions in the large-scale image. Due to the lack of spatial information, these methods only generate a 2D multiscale image. Moreover, the corresponding regions of HRI and LRI are difficult to match in practice.
Therefore, the researchers came up with an alternative way: to reconstruct 3D multiscale pore structure by introducing high-resolution (or high-scale) 2D/3D image information into 3D low-resolution (or low-scale) structures [34, 35, 36, 37]. For instance, Li et al [20] proposed a method to fuse spatial information from 2D high-resolution image into a 3D low-resolution pore structure, which reconstruct multiscale pore structure with large-FoV by combining high-resolution 2D pore image with small-FoV and low-resolution 3D pore structure with large-FoV, but this method did not consider the pore geometry. Wang et al [38] proposed a local-similarity statistic reconstruction (LSSR) method to reconstruct 3D high-resolution porous structure by combining a set of increasing resolution and decreasing FoV micro-CT images. With the application of deep learning in this field [10, 39, 40, 41, 42, 43] some researchers proposed the multiscale reconstruction method based on Generative Adversarial Network (GAN). Shams et al [44] used coupled Generative Adversarial and Auto-Encoder neural network to reconstruct 3D multiscale porous media that contains inter-grain and intra-grain pores simultaneously. Yang et al [45] used conditional Generative Adversarial Network (cGAN) to reconstruct 3D multiscale pore structure from low-resolution core images. These GAN-based techniques generate multi-scale pore structures effectively, but they also have some disadvantages such as large amount of training data and long training time. In general, although studies on multiscale reconstruction has increased, there are still some problems to be solved.
In this paper, a multiscale reconstruction algorithm based on multiple dictionaries learning is proposed. This method introduces the pattern information (macro-pore edge patterns and micro-pore patterns) of the high-resolution 3D core structure with small-FoV into the low-resolution 3D core structure with large-FoV. The introduction of high-scale patterns can modify the pore edges in low-resolution 3D core structure and adds micro-pores that cannot be captured in low-resolution images. The two structures (low- and high- resolution structure) can be extracted from different regions of the same core, which means that their locations do not have to be matched. Through experiments on simulation data (real HRI and simulation LRI data pair), the effectiveness of reconstruction results is proved from quantitative (physical properties and seepage characteristics) and qualitative (visualization of reconstruction results) comparisons. Furthermore, the conclusions of this paper are also verified by real sample experiments.
2 Methodology
To realize the multiscale reconstruction, both FoV and length-scale of image should be considered. The relationship of core image FoV, length-scale and image size are as follows:
| (1) |
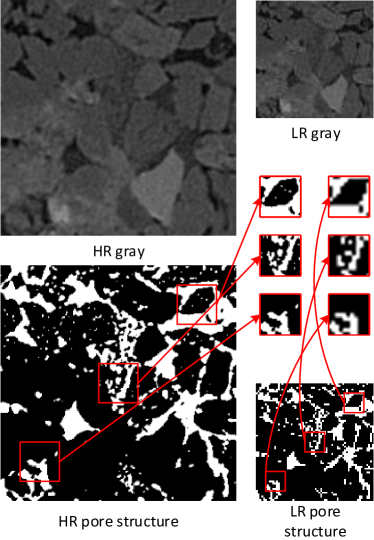
where iFoV is FoV of image, iL is length-scale and iS is image size. Length-scale iL decreases as the image resolution increases. Different resolutions 2D core images and corresponding pore structure are shown Figure 2. The low-resolution gray image is obtained by downsampling the high-resolution gray image. In the low-resolution pore structure, the main structure of most pores is preserved. Red boxes mark the details of the two images, which reflects the difference in the local patterns of the two images. High-resolution pattern contains edge and micro-pore, and low-resolution pattern contains pore skeleton. Although some image processing algorithms (such as image upsampling) can improve image resolution (reduce the iL), it is difficult to accurately model fine multiscale pore structures without imaging with high-resolution equipment. This is because low-resolution gray images do not capture details features such as micro-pores and fine pore edges. It is instructive that multiscale reconstructions can be seen as introducing details features from HRI with small-FoV into the enhanced resolution LRI with large-FoV for joint modeling.
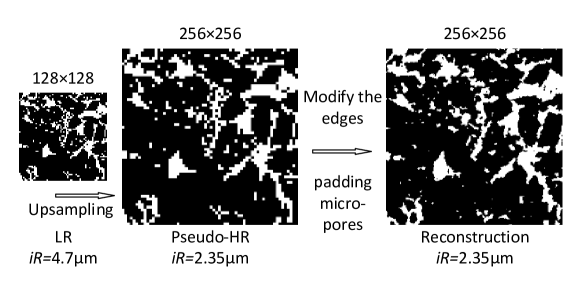
At the micro scale, cores have local similarity. Arguably, if the main structure of two patterns is similar on the same scale, then their edges are also similar [38, 46, 47]. Even from different regions of the same core, LRI pore edges can be effectively modified as long as HRI contains sufficient information. Therefore, based on the above assumptions, multi-scale reconstruction can be simply divided into the following steps (as shown in Figure 3):
-
1)
Enhance LR pore structure resolution by upsampling (reduce iL of LRI);;
-
2)
Modify edges by matching LR and HR patterns of the same scale;
-
3)
Padding micro-pores that LR cannot capture.
This paper builds edge pattern dictionary (EPD) and micro-pore dictionary (MPD) from HRI. It is worth noting that multiple dictionaries of edge patterns with different scales are built. The pore edges of LRI are modified in stages by matching the patterns in different scale edge pattern dictionaries. Then, the micro-pore patterns from the micro-pore dictionary are random padded into LRI.
2.1 Upsampling Mapping
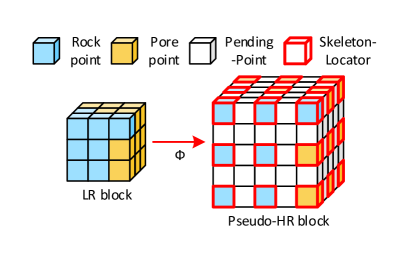
Traditional image upsampling can increase the iS and reduce the iL by interpolating the original pixels. As shown in Figure 4, this paper defines an Upsampling Mapping :
| (2) |
The pseudo-HR block consists of Skeleton-Locator (SL) and Pending-Points. Pixels of LR block (include rock points and pore points) are taken as the Skeleton-Locator to guidance the neighboring pixels (Pending-Points). The Skeleton-Locator is the framework for the pattern, which represents the main structure of the pores. Pending-Points reflect the development of pore edges, which are determined by matching similar Skeleton-Locator in edge pattern dictionary.
Let the length-scale of LRI be , and after times Upsampling Mapping is performed:
| (3) |
The maximum value of should meet the following conditions:
| (4) |
Theoretically, the resolution of multiscale structures with the highest resolution that can be reconstructed by the algorithm can be determined according to Inequation (4). The multiscale structure highest resolution is when is maximum.
2.2 Multiple Scale of Edge Pattern Dictionaries
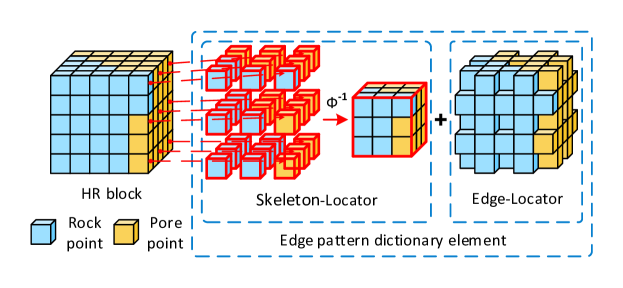
Figure 5 shows the edge pattern dictionary element. In this paper, a -size template is used to scan HRI to build edge pattern dictionary. The edge pattern dictionary element consists Skeleton-Locator () and Edge-Locator (). is used to extract Skeleton-Locator from HR block:
| (5) |
where () and () capture the main structure and rich edge details of the patterns respectively. Removing redundant patterns, a single scale edge pattern dictionary is expressed as:
| (6) |
The indicates the -th class Skeleton-Locator in the EPD. The indicates the -th Edge-Locator in -th class Skeleton-Locator. Patterns from pores with different scales may have the same Skeleton-Locator, so a single scale EPD will confuse their Edge-Locator and leads to a mismatch. It is corrected by building multiple edge pattern dictionaries of different scales.
In general, image downsampling decreases the resolution while loses the high-scale features and retains the low-scale features. Therefore, a lower-scale pattern dictionary can be built by scanning the downsampled HRI. Let the length-scale of HRI be . The edge dictionary built by HRI is . The HRI is downsamped times, and the resolution of HRI becomes
| (7) |
The corresponding edge pattern dictionary is . The maximum value of should meet the following conditions:
| (10) |
When is the maximum value, it means that the feature scale of HRI is similar to LRI after times of downsampling.
2.3 Edge Pattern Matching and multi-stage reconstruction
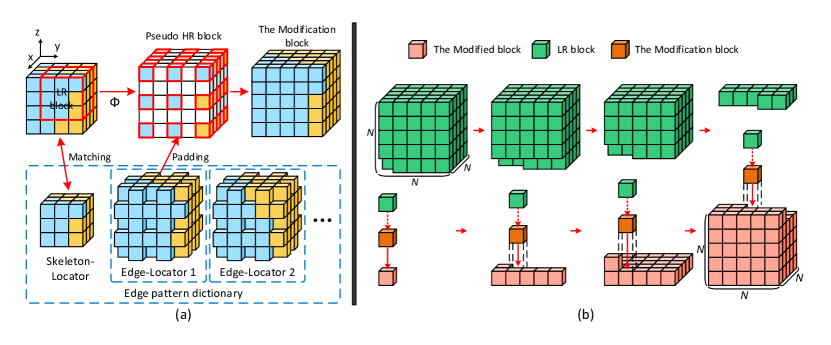
Figure 6 vividly illustrates the single-stage reconstruction process. Considering the connectivity of pores, the matching mechanism is divided into two steps. First, and are matched according to the following formula:
| (11) |
Formula (9) is used to match the most similar -th class Skeleton-Locator in the EPD. Then, the Edge-Locator with the best connectivity is matched according to the following formula:
| (12) |
The is the Modification block padded with -th Edge-Locator that in -th class Skeleton-Locator. The indicates the -th direction surface of Mod and the is the corresponding adjacent surface is in the modified block.
In order to reconstruct the edge that is more similar to the real edge, the reconstruction of the edge is multi-stage. The LRI pore edges are reconstructed in stages by matching edge pattern dictionaries that is low-scale to high-scale. Let be the maximum. The indicates the single-stage reconstruction process. So, the multi-stage reconstruction can express as:
| (17) |
The represents the multiscale structure that reconstructed by -stage EPDs modification edge. After multi-stage edge reconstruction, the and of the are as follows:
| (18) |
2.4 Micro-pore pattern dictionary and micro-pore padding
Besides the edge reconstruction, the padding of micro-pores is also important. The smallest Connected Component (CC) that can be counted in is a single pixel. The corresponding number of pixels in is . Moreover, the corresponding number of pixels in HRI is . Therefore, the Connected Component of HRI () contains micro-pores that not be captured by . The range of is following:
| (19) |
Two-Pass method [48] is a classical image processing algorithm to mark the Connected Component (CC) of binary image. In this paper, the Two-Pass method is adopted to mark CCs in the range of in HRI to build a micro-pore pattern dictionary. MPD elements are extracted by 3D Bounding Rectangler of these Connected Components.
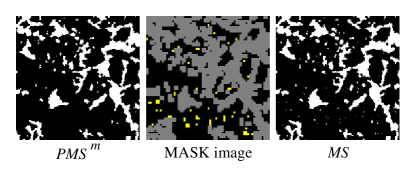
To avoid overlap, Connected Component in the is marked with MASK. The MASKs are calculated by morphological dilation operation. To facilitate understanding, the 2D image in Figure 7 as an example. Connected Components in the is marked (the gray area of Mask image), and then MPD elements (the yellow area of Mask image) are randomly padded into the non-pore area (the black area of ) to form a fine multiscale pore structure (MS).
In particular, micro-pores in image are composed of two types of pores: a) Intragranular pores; b) Fragmentary intergranular pores caused by the lower resolution imaging. These intergranular pores are formed by the dense arrangement of rock particles. At the microscopic scale, they are relatively evenly distributed throughout the rock sample. Therefore, the number distribution of micro-pores in the reconstructed MS is similar to that of HRI. The FoV of MS is times that of HR pore structure. Thus, based on the similarity homology and statistical similarity, the elements of MPD are repeatedly padded times in to approximate the micro-pore distribution of the HR pore structure.
3 Result and discussion
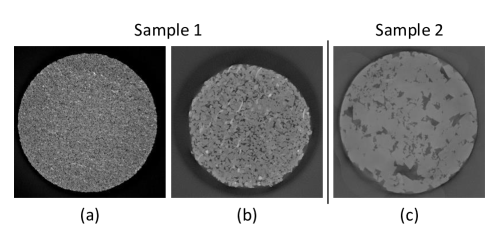
In this study, simulation data experiment and real data experiment are designed to prove the effectiveness of the proposal algorithm by comparing quantitative (physical properties, seepage characteristics) and qualitative (visualization of reconstruction results). As shown in Figure 8, experimental core samples include sample 1 and sample 2. The length-scale of (a) is 2.35 and (b) is 13.29. (a) and (b) are obtained by imaging 2.5 and 3 (diameter) cores in sample 1, respectively. The (c)’s length-scale is 1, which is obtained by imaging 2 (diameter) core in sample 2.
3.1 Simulation data experiment
The simulation data experiments are designed to facilitate comparison with real 3D high-resolution pore structures. The simulation data is processed as follows: First, two volumes of the same size are cut out of the CT image. Then, one of the them is used as the HRI, and the other is down-sampled by bicubic interpolation [49] as the simulation LRI. Finally, their pore structure is extracted using Otsu method [50]. Simulation data experiments are proceeded on sample 1(b) and sample 2(c).
3.1.1 Simulation data experiment for Sample 1(b)
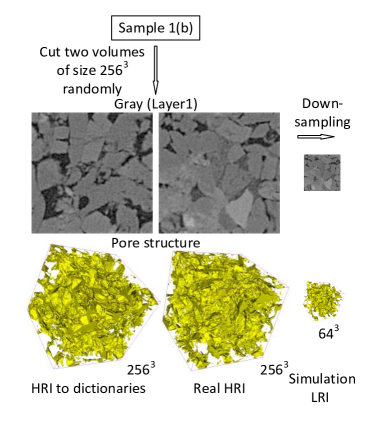
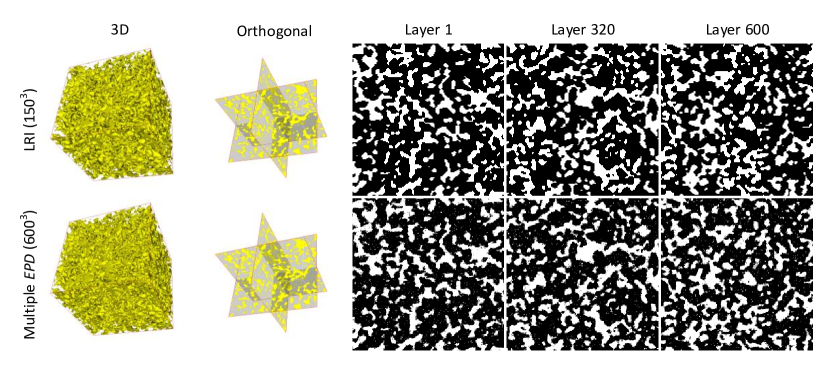
Simulation data for sample 1(b) are produced following the processing in section 3.1, as shown in Figure 9. Thus, the length-scale of the HRI is 2.35 and the simulation LRI is 9.4. The size of HRI is and the simulation LRI is . Multiple dictionaries (include multiple edge dictionaries and micro-pore dictionary) are built by HRI. According formula (8), the simulation LRI should be refined edges by a 2-stage edge reconstruction. Figure 10 shows the qualitative comparison of reconstructions with the original HRI. To prove the effectiveness of the multiscale edge dictionaries, the results of reconstruction using single edge dictionary are compared. To prove the stability of the algorithm, multiple EPD and single EPD are using to reconstructed three times respectively. Figure 10 only shows the results of one reconstruction.
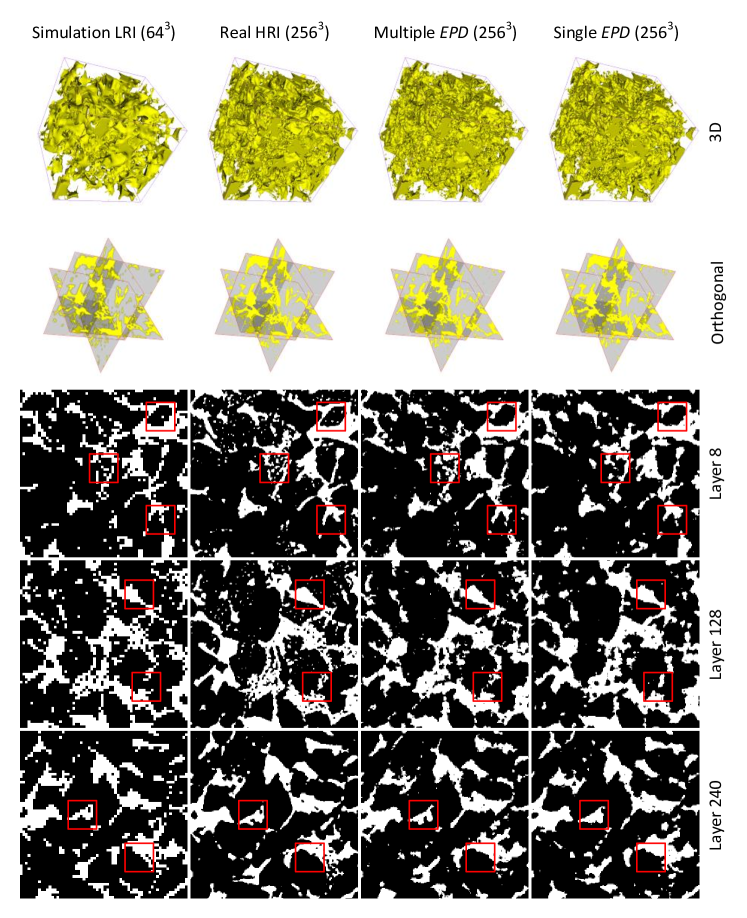
According the 3D and Orthogonal row in Figure 10, the simulation LRI, multiple EPD-1 and single EPD-1 skeletons are similar to the real HRI, indicating that the multi-stage edge reconstruction preserves pore skeleton features. Furthermore, the 3D structures of both multiple EPD-1 and single EPD-1 are padded with a number of micro-pores that cannot be captured by simulation LRI. In Layer rows of Figure 10, the pore edges of the simulation LRI are rough, by multi-stage edge reconstruction, the multiple EPD-1 and single EPD-1 edges are both refined. However, compared to single EPD-1, the pore edges of multiple EPD-1 are more similar to real HRI, because multiple EPD-1 matches the corresponding scale edge patterns in EPDs at each stage of edge reconstruction.
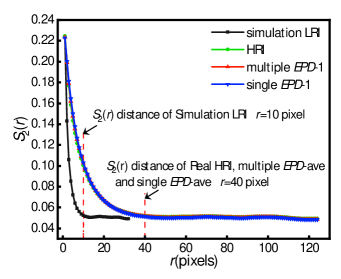
In Figure 11, the two-point correlation function () is used to evaluate the spatial correlation of the simulation LRI, reconstructions and real HRI. multiple EPD-ave, single EPD-ave represent the average of three reconstructions using multiple EPD and single EPD respectively. The two-points correlation distance of reconstructions ( 40 pixel) is equal to that of the real HRI, which is 4 times that of the simulation LRI ( 10 pixel). The reconstructions are consistent with the of the real structure, due to the multiscale reconstruction does not alter the skeleton of the pore structure. The of reconstructions is almost identical to the real HRI, demonstrating that the proposal method is stable. However, since the spatial correlation is mainly determined by the large pores (skeleton), cannot reflect changes in the pore edges.
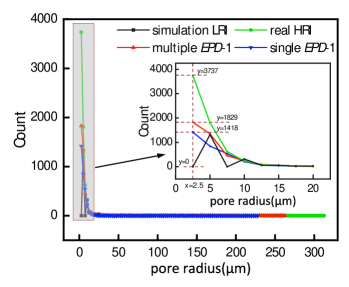
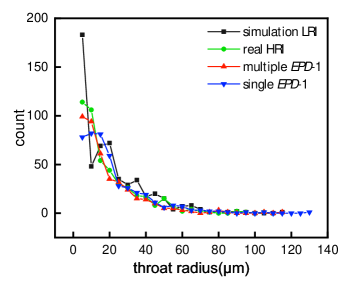
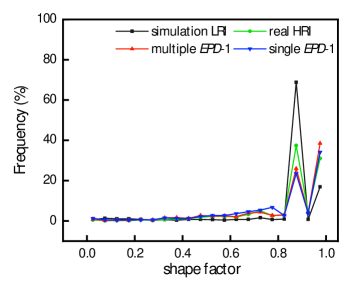
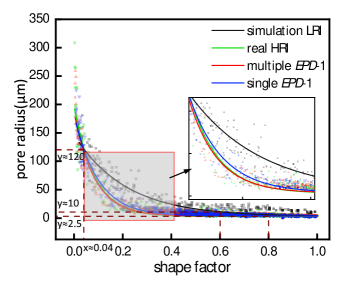
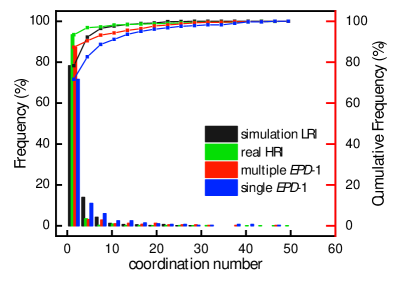
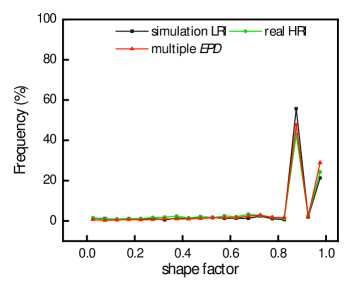
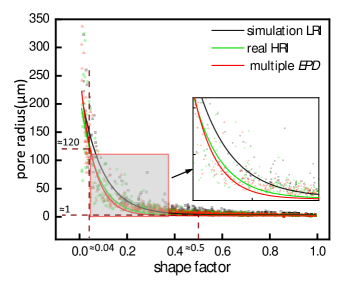
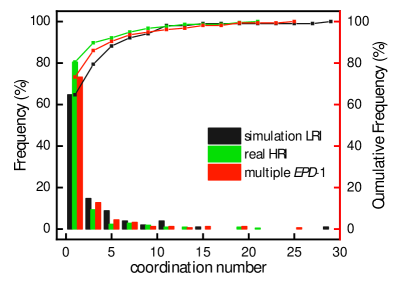
Geometrical and topological features are important physical parameters to evaluate the accuracy of the reconstructions. Figure 12 depicts the comparison of pore radius distribution, throat radius distribution, pore shape factor distribution, pore shape factor-pore radius distribution and coordination number distribution. The Figure 12(a) shows the count and cumulative frequency of pore radius. Simulation LRI cannot capture micro-pores (here radius smaller than 2.5), whereas the real HRI and reconstructions all capture micro-pores. It is possible that the difference about the number of micro-pores is caused by the insufficient number of micro-pore patterns in the MPD, but the cumulative frequency curve of multiple EPD-1 is very similar to that of real HRI. It is worth noting that the same MPD is used, but single EPD-1 has fewer micro-pores than multiple EPD-1. This is because multiple EPD-1 introduces pattern information of corresponding scale at each stage of edge reconstruction, which can re-separate some pores adhered to large pores due to low-resolution imaging. From the distribution of throat radius Figure 12(b) and shape factor Figure 12(c), the curve trend of multiple EPD-1 is more similar to that of real HRI. The fitted curve that counts the shape factor and radius for each pore is the pore shape factor-pore radius distribution, reflecting the trend of the pore shape factor with the pore radius in the pore structure. The shape factor reflects the geometric feature of the pore shape and edges, with the smaller the shape factors the more complex the shape and edges of the pore. From Figure 12(d) the comparison of shape factor-pore radius distribution, compared with simulation LRI, real HRI and reconstructions have smaller shape factors for pores with the same radius, indicating that the shapes and edges of high-resolution pore structures are more complex. Particularly, the curve of multiple EPD-1 is most consistent with that of the real HRI, which demonstrates the effectiveness of multi-stage edge reconstruction by progressively introducing corresponding scale pattern. From Figure 12(e) the comparison of coordination number distribution, in real HRI, about 98.38% of the pores has coordination numbers distributed within [0,12], compares to 94.29% and 91.13% for multiple EPD-1 and single EPD-1, respectively. The distribution of coordination number for the multiple EPD-1 is more similar to the real HRI. The results in Figure 12 show that reconstructions using multiple edge pattern dictionaries of different scales are in better agreement with the geometric and topological of real samples, and the proposal algorithm is an efficient multiscale reconstruction method.
| Simulation | Real | Multiple | Error with | Single | Error with | |
|---|---|---|---|---|---|---|
| LRI | HRI | EPD-1 | Real HRI | EPD-1 | Real HRI | |
| Average pore radius/ | 66.16 | |||||
| Average throat radius | 12.21 | |||||
| Average coordination number | 30.67 | |||||
| Permeability | 7.02 |
The permeability of the core is influenced by a variety of properties such as connectivity, pore shape and pore surface shape. From Table1, the permeability of simulation LRI is and the real HRI is . High-resolution pore structures (real HRI) contain richer details (fine edges and micro-pores) than low-resolution structures (simulation LRI). The pores and throats of the real HRI are finely divided, resulting in smaller average pore radius, average throat radius, and average coordination numbers. Therefore, compared to the simulation LRI, the connectivity of real HRI is less well, while the pore geometry and pore surface morphology are more complex, resulting in lower permeability. By introducing edge patterns and micropore patterns that from other volumes in same core sample, the simulation LRI is reconstructed as a fine multiscale pore structure (multiple EPD-1) similar to that of real HRI. This is reflected again in the results in Table 1, the average pore radius, average throat radius and average coordination number of multiple EPD-1 are close to that of real HRI. By multiscale reconstruction, the permeability of multiple EPD-1 is , with an error of only 2.18% from the real HRI. Through the above experiments and analysis, the effectiveness of the proposal algorithm is proved.
3.1.2 Simulation data experiment for sandstone Sample 2(c)
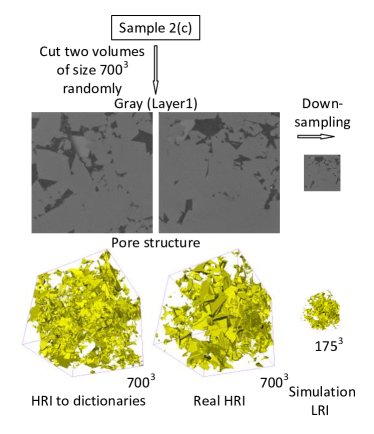
The proposal method focuses on multiscale reconstruction of large-FoV low-resolution structures using pattern features from small-FoV high-resolution structures. So, this method can realize multiscale reconstruction without the limitation of the size of the low-resolution input pore structure. Simulation data for sample 2(c) are produced following the same processing in section 3.1. Here, the length-scale of the HRI is 1 and the simulation LRI is 4. The size of HRI is and the simulation LRI is , as shown in Figure 13. According formula (8), the simulation LRI should be refined edges by a 2-stage edge reconstruction.
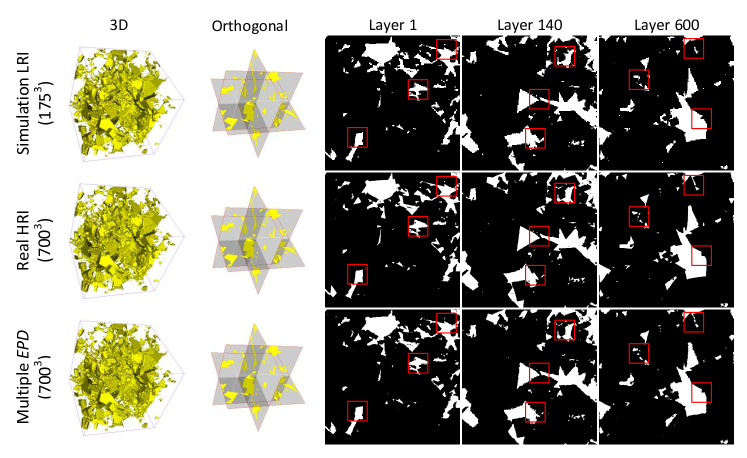
Figure 14 shows the qualitative comparison of reconstructions with the real HRI. Visually, sample 2(c) is heterogeneous. By multiscale reconstruction, multiple EPD acquired edge features similar to real HRI. Even for larger size images (), the multiscale reconstructed pore structure of multiple EPD is almost agreement to that of real HRI.
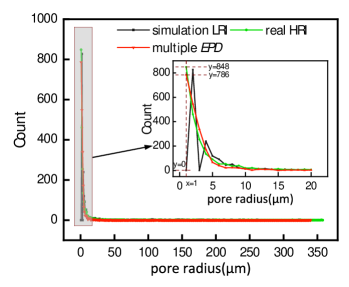
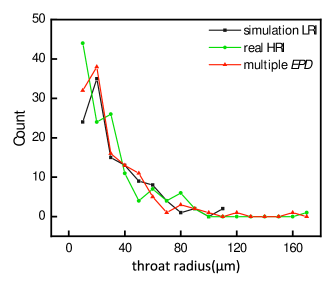
A comparison of the geometric and topological features in Figure 15 further demonstrates the effectiveness of the proposal algorithm. As shown in Figure 15(a), the real HRI and multiple EPD all capture micro-pores (here radius smaller than 1) that cannot be captured in simulation LRI. From the distribution of throat radius Figure 15(b), shape factor Figure 15(c) and shape factor-pore radius Figure 15(d), all curves trend of multiple EPD are similar to that of real HRI. The coordination number distribution of multiple EPD is also similar to the real HRI, Figure 15(e). In real HRI, about 92.09% of the pores has coordination numbers distributed within [0,6], compares to 90.45% for multiple EPD. The results in Figure 15 show that the proposal algorithm is also effective for multiscale reconstruction of heterogeneous cores. Moreover, experiments based on two sets of different sizes images have also demonstrated that the algorithm is capable of multiscale reconstruction regardless of the input size.
| Simulation | Real | Multiple | Error with | |
|---|---|---|---|---|
| LRI | HRI | EPD | Real HRI | |
| Average pore radius/ | ||||
| Average throat radius | ||||
| Average coordination number | ||||
| Permeability |
Although the physical parameters of heterogeneous cores such as permeability are mainly determined by macropores. But the skeleton of the high-resolution pore structure is similar to that of the low-resolution pore structure, and the high-resolution pore structure has a finer delineation of edges and pore throats, so it can be used to calculate more accurate physical parameters. By multiscale reconstruction, fine multiscale pore structures similar to real HRI structures can be obtained. From Table2, the average pore radius, average throat radius and average coordination number of multiple EPD are close to that of real HRI. The permeability of multiple EPD is , with an error of only 2.35% from the real HRI (). The above results demonstrate the effectiveness of the proposal algorithm.
3.2 Real data experiment
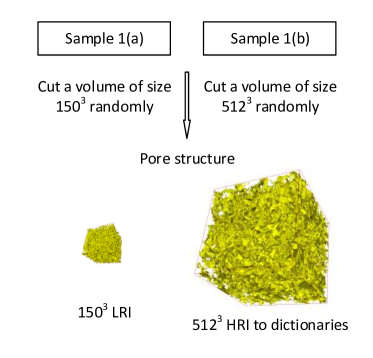
The real data experiment is conducted to verify the practicality of the proposal algorithm. Sample 1(a) and sample 1(b) are low-resolution images and high-resolution CT images of the same core sample, respectively. The data processing is shown in Figure16. Here, the length-scale of the HRI is 2.35 and the LRI is 13.29. Multiple dictionaries (include multiple scale edge dictionaries and micropore dictionary) are built by HRI. According formula (4) and formula (8), the LRI is refined edges by a 2-stage edge reconstruction, and the resolution of the reconstructed multiscale pore structure is approximately 3.32.
| LRI | Multiple EPD | |
|---|---|---|
| Average pore radius/ | ||
| Average throat radius | ||
| Average coordination number | ||
| Permeability |
Visually, the multiple EPD has finer pore edges than the LRI, while capturing the micro-pores (here radius smaller than 4), in Figure17. From Table 3, the average pore radius and average throat radius, and the average coordination number have decreased. This indicates that the pores and throats of multiple EPD are finely divided, because the multiscale reconstruction introduces rich edge information and micropore information. Moreover, the permeability is reduced from (LRI) to (multiple EPD) , which is consistent with the conclusions of the simulation data experiments. The effectiveness and practicality of the proposal algorithm is demonstrated by real data experiment.
4 Conclusion
In this paper, a multiple dictionaries learning-based multiscale reconstruction method is proposed for reconstructing large-FoV high-resolution pore structures using large-FoV low-resolution pore structures and small-FoV high-resolution pore structures. Based on the homology and statistical similarity, multiple dictionaries are built by extracting the multiscale edge patterns and micro-pores pattern in HRI, and then reconstruct pore edges of LRI by matching the corresponding scales edge patterns stage by stage. Meanwhile, masks are adopted to avoid the conglomeration of micro-pore patterns to pore areas. Through experiments on simulation data and real data, the effectiveness and practicality of this algorithm are proved from quantitative and qualitative comparison. Experiments show that multiscale reconstruction by introducing high-resolution edge patterns and micro-pore patterns from different volumes of the same core, allows the results of multiscale reconstruction to obtain physical properties similar to those of high-resolution core structures. The algorithm is capable of multiscale reconstruction without regard to the size of the input. Moreover, it is all effective for multiscale reconstruction of homogeneity and heterogeneity core. In this paper, the random padding of the micro-pores is primarily based on statistical quantity similarities in homology cores, but the location of the micro-pores also affects the accuracy of the multiscale reconstruction, which will be explored in a subsequent study.
Acknowledgment
This work was supported by the National Natural Science Foundation of China (Grants No. 62071315).
References
References
- [1] K. Lichun, L. He, R. Yili, L. Kai, S. Mingyu, S. Jian, L. Xin, Application and development trend of artificial intelligence in petroleum exploration and development, Petroleum Exploration and Development 41 (1) (2021) 1–14.
- [2] L. Zhu, C. Zhang, C. Zhang, X. Zhou, Z. Zhang, X. Nie, W. Liu, B. Zhu, Challenges and prospects of digital core-reconstruction research, Geofluids 2019 (2019) 7814180.
- [3] R. Bostanabad, Y. Zhang, X. Li, T. Kearney, L. C. Brinson, D. W. Apley, W. K. Liu, W. Chen, Computational microstructure characterization and reconstruction: Review of the state-of-the-art techniques, Progress in Materials Science 95 (2018) 1–41.
- [4] Y. Ju, J. Zheng, M. Epstein, L. Sudak, J. Wang, X. Zhao, 3d numerical reconstruction of well-connected porous structure of rock using fractal algorithms, Computer Methods in Applied Mechanics and Engineering 279 (3) (2014) 212–226.
- [5] P. Hou, X. Liang, Y. Zhang, J. He, F. Gao, J. Liu, 3d multi-scale reconstruction of fractured shale and influence of fracture morphology on shale gas flow, Natural Resources Research 30 (3) (2021) 2463–2481.
- [6] Y. Ju, Y. Huang, J. Zheng, X. Qian, H. Xie, X. Zhao, Multi-thread parallel algorithm for reconstructing 3d large-scale porous structures, computers & Geosciences 101 (2017) 10–20.
- [7] X. Li, Y. Zhang, H. Zhao, C. Burkhart, L. C. Brinson, W. Chen, A transfer learning approach for microstructure reconstruction and structure-property predictions, Scientific reports 8 (1) (2018) 1–13.
- [8] T. Bultreys, W. De Boever, V. Cnudde, Imaging and image-based fluid transport modeling at the pore scale in geological materials: A practical introduction to the current state-of-the-art, Earth-Science Reviews 155 (2016) 93–128.
- [9] J. Tian, C. Qi, Y. Sun, Z. M. Yaseen, Surrogate permeability modelling of low-permeable rocks using convolutional neural networks, Computer Methods in Applied Mechanics and Engineering 366 (2020) 113103.
- [10] J. Fu, D. Xiao, D. Li, H. R. Thomas, C. Li, Stochastic reconstruction of 3d microstructures from 2d cross-sectional images using machine learning-based characterization, Computer Methods in Applied Mechanics and Engineering 390 (2022) 114532.
- [11] J. Fu, S. Cui, S. Cen, C. Li, Statistical characterization and reconstruction of heterogeneous microstructures using deep neural network, Computer Methods in Applied Mechanics and Engineering 373 (2021) 113516.
- [12] S. Schlüter, A. Sheppard, K. Brown, D. Wildenschild, Image processing of multiphase images obtained via x-ray microtomography: a review, Water Resources Research 50 (4) (2014) 3615–3639.
- [13] Y. Ju, Y. Huang, W. Gong, J. Zheng, H. Xie, L. Wang, X. Qian, 3-d reconstruction method for complex pore structures of rocks using a small number of 2-d x-ray computed tomography images, IEEE Transactions on Geoscience and Remote Sensing 57 (4) (2018) 1873–1882.
- [14] S. Karimpouli, A. Faraji, M. Balcewicz, E. H. Saenger, Computing heterogeneous core sample velocity using digital rock physics: A multiscale approach, Computers & Geosciences 135 (2020) 104378.
- [15] K. M. Gerke, M. V. Karsanina, T. O. Sizonenko, X. Miao, D. R. Gafurova, D. V. Korost, Multi-scale image fusion of x-ray microtomography and sem data to model flow and transport properties for complex rocks on pore-level, in: SPE Russian Petroleum Technology Conference, Springer, 2017.
- [16] L. Zhang, W. Jing, Y. Yang, H. Yang, Y. Guo, H. Sun, J. Zhao, J. Yao, The investigation of permeability calculation using digital core simulation technology, Energies 12 (17) (2019) 3273.
- [17] M. Tan, M. Su, W. Liu, X. Song, S. Wang, Digital core construction of fractured carbonate rocks and pore-scale analysis of acoustic properties, Journal of Petroleum Science and Engineering 196 (2021) 107771.
- [18] J. Feng, Q. Teng, B. Li, X. He, H. Chen, Y. Li, An end-to-end three-dimensional reconstruction framework of porous media from a single two-dimensional image based on deep learning, Computer Methods in Applied Mechanics and Engineering 368 (2020) 113043.
- [19] P. C. Sanematsu, K. E. Thompson, C. S. Willson, Pore-scale modeling of nanoparticle transport and retention in real porous materials, computers & Geosciences 127 (2019) 65–74.
- [20] X. Li, Q. Teng, Y. Zhang, S. Xiong, J. Feng, Three-dimensional multiscale fusion for porous media on microtomography images of different resolutions, Physical Review E 101 (5) (2020) 053308.
- [21] B. Biswal, P.-E. Øren, R. J. Held, S. Bakke, R. Hilfer, Modeling of multiscale porous media, Image Analysis & Stereology.
- [22] Y. Wu, P. Tahmasebi, C. Lin, C. Dong, A comprehensive investigation of the effects of organic-matter pores on shale properties: A multicomponent and multiscale modeling, Journal of Natural Gas Science and Engineering 81 (2020) 103425.
- [23] Y. Wu, P. Tahmasebi, C. Lin, L. Ren, C. Dong, Multiscale modeling of shale samples based on low-and high-resolution images, Marine and Petroleum Geology 109 (2019) 9–21.
- [24] C. P. Fernandes, F. Magnani, P. Philippi, J. Daian, Multiscale geometrical reconstruction of porous structures, Physical Review E 54 (2) (1996) 1734.
- [25] W. Lin, X. Li, Z. Yang, M. Manga, X. Fu, S. Xiong, A. Gong, G. Chen, H. Li, L. Pei, et al., Multiscale digital porous rock reconstruction using template matching, Water Resources Research 55 (8) (2019) 6911–6922.
- [26] L. Ruspini, P. Øren, S. Berg, S. Masalmeh, T. Bultreys, C. Taberner, T. Sorop, F. Marcelis, M. Appel, J. Freeman, et al., Multiscale digital rock analysis for complex rocks, Transport in Porous Media 139 (2) (2021) 301–325.
- [27] W. Zhang, L. Song, J. Li, Efficient 3d reconstruction of random heterogeneous media via random process theory and stochastic reconstruction procedure, Computer Methods in Applied Mechanics and Engineering 354 (2019) 1–15.
- [28] Y. Jiao, F. Stillinger, S. Torquato, Modeling heterogeneous materials via two-point correlation functions. ii. algorithmic details and applications, Physical Review E 77 (3) (2008) 031135.
- [29] J. Yao, C. Wang, Y. Yang, R. Hu, X. Wang, The construction of carbonate digital rock with hybrid superposition method, Journal of Petroleum Science and Engineering 110 (2013) 263–267.
- [30] M. V. Karsanina, K. M. Gerke, E. B. Skvortsova, A. L. Ivanov, D. Mallants, Enhancing image resolution of soils by stochastic multiscale image fusion, Geoderma 314 (2018) 138–145.
- [31] P. Tahmasebi, Nanoscale and multiresolution models for shale samples, Fuel 217 (2018) 218–225.
- [32] L. Ji, M. Lin, G. Cao, W. Jiang, A multiscale reconstructing method for shale based on sem image and experiment data, Journal of Petroleum Science and Engineering 179 (2019) 586–599.
- [33] H. Okabe, M. J. Blunt, Pore space reconstruction of vuggy carbonates using microtomography and multiple-point statistics, Water Resources Research 43 (12).
- [34] H. Li, P.-E. Chen, Y. Jiao, Accurate reconstruction of porous materials via stochastic fusion of limited bimodal microstructural data, Transport in Porous Media 125 (1) (2018) 5–22.
- [35] Y. Wang, Y. Yuan, S. S. Rahman, C. Arns, Semi-quantitative multiscale modelling and flow simulation in a nanoscale porous system of shale, Fuel 234 (2018) 1181–1192.
- [36] S. Song, M. Li, Q. Tu, A. Yuan, Z. Jiao, P. Li, W. Qian, H. Liu, N. Xu, An improved universal fusion algorithm for constructing 3d multiscale porous media, Water Resources Research 57 (8) (2021) e2020WR029134.
- [37] K. Wu, Z. Jiang, G. D. Couples, M. I. J. Van Dijke, K. S. Sorbie, Reconstruction of multi-scale heterogeneous porous media and their flow prediction, in: International Symposium of the Society of Core Analysts, Calgary, Canada, 2007.
- [38] Y. Wang, J.-Y. Arns, S. S. Rahman, C. H. Arns, Three-dimensional porous structure reconstruction based on structural local similarity via sparse representation on micro-computed-tomography images, Physical Review E 98 (4) (2018) 043310.
- [39] L. Mosser, O. Dubrule, M. J. Blunt, Reconstruction of three-dimensional porous media using generative adversarial neural networks, Physical Review E 96 (4) (2017) 043309.
- [40] F. Zhang, X. He, Q. Teng, X. Wu, X. Dong, 3d-pmrnn: Reconstructing three-dimensional porous media from the two-dimensional image with recurrent neural network, Journal of Petroleum Science and Engineering 208 (2022) 109652.
- [41] P. Xia, H. Bai, T. Zhang, Multi-scale reconstruction of porous media based on progressively growing generative adversarial networks, Stochastic Environmental Research and Risk Assessment (2022) 1–21.
- [42] K. M. Guan, T. I. Anderson, P. Creux, A. R. Kovscek, Reconstructing porous media using generative flow networks, Computers & Geosciences 156 (2021) 104905.
- [43] Y. Wang, Q. Teng, X. He, J. Feng, T. Zhang, Ct-image of rock samples super resolution using 3d convolutional neural network, computers & Geosciences 133 (2019) 104314.
- [44] R. Shams, M. Masihi, R. B. Boozarjomehry, M. J. Blunt, Coupled generative adversarial and auto-encoder neural networks to reconstruct three-dimensional multi-scale porous media, Journal of Petroleum Science and Engineering 186 (2020) 106794.
- [45] Y. Yang, F. Liu, J. Yao, S. Iglauer, M. Sajjadi, K. Zhang, H. Sun, L. Zhang, J. Zhong, V. Lisitsa, Multi-scale reconstruction of porous media from low-resolution core images using conditional generative adversarial networks, Journal of Natural Gas Science and Engineering (2022) 104411.
- [46] Z. Li, X. He, Q. Teng, Y. Li, X. Wu, Reconstruction of 3d greyscale image for reservoir rock from a single image based on pattern dictionary, Journal of Microscopy 283 (3) (2021) 202–218.
- [47] K. Ding, Q. Teng, Z. Wang, X. He, J. Feng, Improved multipoint statistics method for reconstructing three-dimensional porous media from a two-dimensional image via porosity matching, Physical Review E 97 (6) (2018) 063304.
- [48] L. G. Shapiro, Connected component labeling and adjacency graph construction, in: Machine intelligence and pattern recognition, Vol. 19, Elsevier, 1996, pp. 1–30.
- [49] R. E. Carlson, F. N. Fritsch, Monotone piecewise bicubic interpolation, SIAM journal on numerical analysis 22 (2) (1985) 386–400.
- [50] O. D. Trier, T. Taxt, Evaluation of binarization methods for document images, IEEE transactions on pattern analysis and machine intelligence 17 (3) (1995) 312–315.