Gender and Racial Bias in Visual Question Answering Datasets
Abstract.
Vision-and-language tasks have increasingly drawn more attention as a means to evaluate human-like reasoning in machine learning models. A popular task in the field is visual question answering (VQA), which aims to answer questions about images. However, VQA models have been shown to exploit language bias by learning the statistical correlations between questions and answers without looking into the image content: e.g., questions about the color of a banana are answered with yellow, even if the banana in the image is green. If societal bias (e.g., sexism, racism, ableism, etc.) is present in the training data, this problem may be causing VQA models to learn harmful stereotypes. For this reason, we investigate gender and racial bias in five VQA datasets. In our analysis, we find that the distribution of answers is highly different between questions about women and men, as well as the existence of detrimental gender-stereotypical samples. Likewise, we identify that specific race-related attributes are underrepresented, whereas potentially discriminatory samples appear in the analyzed datasets. Our findings suggest that there are dangers associated to using VQA datasets without considering and dealing with the potentially harmful stereotypes. We conclude the paper by proposing solutions to alleviate the problem before, during, and after the dataset collection process.
1. Introduction

The so-called vision-and-language tasks, which consist of applications that interact, process, and make decisions based on both visual and language content, present one of the greatest challenges in modern machine learning research. By construction, such applications not only need to deal with the challenges of image and text understanding but also overcome the modality gap between the visual and the language inputs. Such modality gap is non-trivial and has made tasks such as image captioning (You et al., 2016; Vinyals et al., 2017) or visual question answering (Antol et al., 2015; Malinowski and Fritz, 2014) considerably popular within the computer vision (CV) (Elhoseiny et al., 2021; Wu and Gan, 2021; Shrivastava et al., 2021; Achlioptas et al., 2021) and the natural language processing (NLP) (Mosbach et al., 2021; Bugliarello et al., 2021) communities. From classic CNN-based models (Vinyals et al., 2017) to the current self-attention multi-modal Transformers (Lu et al., 2019; Li et al., 2019), the rapid progression of the field has only been possible thanks to the collection, annotation, and public distribution of datasets and benchmarks (Lin et al., 2014; Chen et al., 2015; Krishna et al., 2017; Shrivastava et al., 2021; Sharma et al., 2018) designed specifically to train and evaluate vision-and-language models.
The increased complexity of those models, which contain a high number of parameters to be trained, has made the availability of data a precious resource. At the same time, with the adoption of some of these models into real-world products, how this data represents the real world is of raising concern. For example, when minoritized groups are underrepresented in machine learning datasets, trained models can contribute to perpetuating social discrimination by producing potentially harmful outcomes. This has been the case for face recognition (Buolamwini and Gebru, 2018) as well as for object recognition (Zhao et al., 2017). With respect to vision-and-language, Burns et al. (Hendricks et al., 2018) and Zhao et al. (Zhao et al., 2021) showed that image captioning models, i.e., models that aim to produce a descriptive sentence of a given image, perpetuate gender and racial bias. As crucial as this is, the depth of the problem has not been fully explored, and the question about whether other tasks within vision-and-language are also affected by unfair data representations remains open.
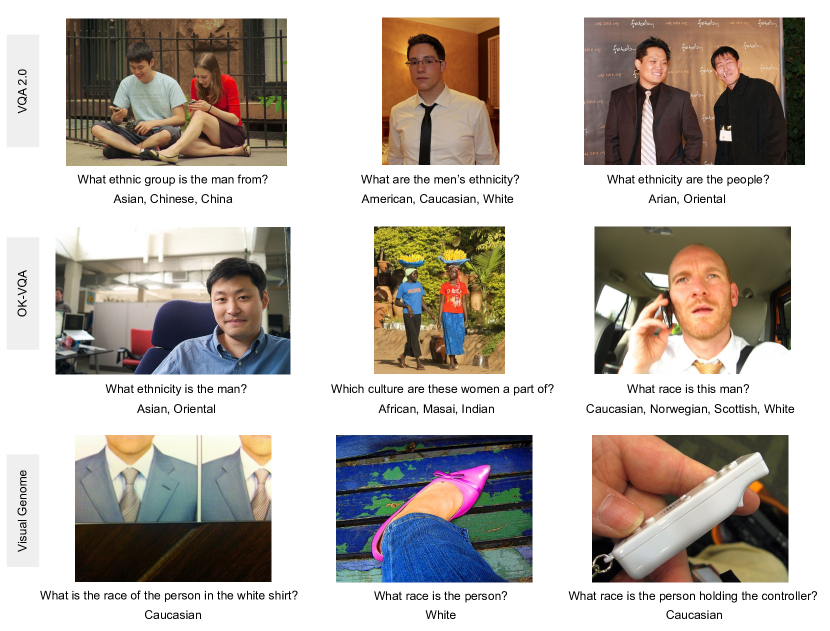
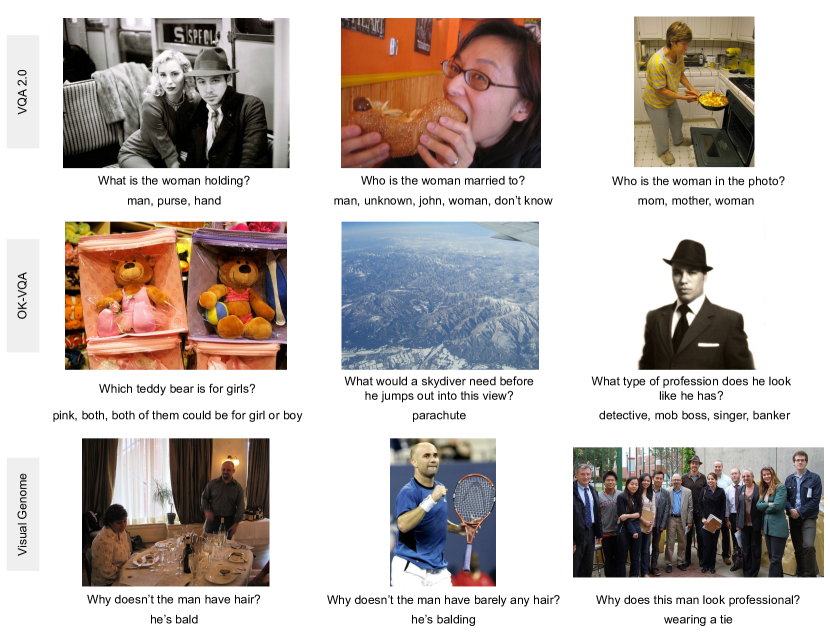
With the aim of raising awareness and starting an open discussion, this paper investigates societal bias in visual question answering (VQA), another of the foundational tasks within the vision-and-language community. The aim of VQA is to correctly answer questions about a given image (Figure 1), requiring understanding and associating the question and the image with potential candidate answers. One of the current challenges in VQA is that models tend to suffer from language bias (Agrawal et al., 2018), i.e., they exploit the superficial correlations between the questions and the answers in the training set, and produce answers without looking into the visual content. For example, in the VQA 1.0 dataset (Antol et al., 2015) questions starting with what sport are answered tennis on the % of the samples, which leads to models learning a shortcut to always produce tennis for this type of questions. This suggests that if societal bias, such as racism or sexism, is present in the training data, it will be highly likely perpetuated by VQA models. Moreover, as most of the VQA datasets are collected by crowdsourcing by showing human annotators a photo and asking them to freely write questions and answers about it, it is reasonable to think that the biases from the annotators may be leaked into the data.
Specifically, this paper analyzes gender and racial bias on five VQA datasets (Goyal et al., 2017; Hudson and Manning, 2019; Krishna et al., 2017; Zhu et al., 2016; Marino et al., 2019). Our study is based on the compilation of statistics about the representation of different demographic groups, the correlation between demographic groups and answer and question distributions, and the exploration of harmful examples within each dataset. In Section 4, we analyze gender bias in terms of men and women representation,111We realize that gender categories should be inclusive and based on the self-identity of gender. Since VQA datasets deal with gender in binary categories and according to other computer vision studies about ethics (Hendricks et al., 2018; Zhao et al., 2017; Wang et al., 2019b), we consider binary gender in this analysis. uncovering:
-
•
There is a systematic imbalance on gender representation. Questions about men are about twice as frequent as those about women in all the analyzed datasets.
-
•
Answer distributions are different between women and men questions. For example, in VQA 2.0 (Goyal et al., 2017), the answer skateboarding appears times for questions about men, but only times for questions about women. Furthermore, we found that specific answers are co-related with each gender, e.g., the percentage of answers that are blonde is about times higher in questions about women than in questions about men.
-
•
We found multiple samples that reflect traditional gender stereotypes both in men and women images.
-
•
Answers based on gender stereotypes tend to appear more frequently in samples where the answers cannot be grounded in the image content, such as What is the woman thinking?.
In Section 5, we analyze VQA datasets in terms of racial bias. Specifically, we dig into samples that explicitly mentions race or ethnicity. Our analysis shows:
- •
-
•
There is an imbalance on the representation of different demographic groups. For instance, in VQA 2.0, the answers White or Caucasian appear about times more frequently than the answers Black or African.
-
•
The correlation between race and nationality shows a US-centric viewpoint, with % of Black people being associated with American nationality in VQA 2.0.
-
•
We found potential harmful examples related to race, ethnicity, or nationality. As in the case of gender, these samples tend to appear when answers cannot be grounded in the visual content of the image, leading annotators to answer the questions based on their own preconceptions of the world.
In Section 6, we identify two main sources of societal bias in VQA datasets, and propose mitigation strategies to alleviate them. The first problem is the underrepresentation of minoritized groups. We emphasize the importance of recognizing societal bias in VQA datasets and taking measures against it, as models trained on such datasets can learn to ignore minoritized attributes and lead to shortcut learning (Geirhos et al., 2020; Kervadec et al., 2021). The second problem is the presence of harmful samples in the datasets. We propose three simple tools to remove them while considering annotation costs: 1) automatically screening to identify unanswerable questions, 2) including ethical instruction in the annotation process, and 3) creating an open platform to allow user’s feedback, so that problematic samples can be easily addressed.
Finally, we would like to note that datasets are a crucial part for the development of the field, and all existing VQA datasets have been and will be necessary and important. This paper does not aim to diminish the contribution of such datasets, but to raise awareness within their users and potential dataset developers so that mitigation measures can be taken in the future.
2. Background
Visual question answering (VQA) VQA is the task of answering a question about an image’s visual content, which has been commonly used to evaluate the ability of a model to understand and integrate visual and language information. In the seminal work by Agrawal et al. (Antol et al., 2015), the first large-scale dataset for VQA was created, commonly known as VQA 1.0 dataset. VQA 1.0 contained challenging reasoning questions involving a diverse set of skills for the models to solve, such as object and activity recognition, counting, or space localization, among others. Since models became progressively better at VQA 1.0, new datasets and challenges were proposed (Goyal et al., 2017; Krishna et al., 2017; Hudson and Manning, 2019; Zhu et al., 2016; Gurari et al., 2018; Marino et al., 2019; Garcia et al., 2020), including VQA 2.0 (Goyal et al., 2017), which partly addressed the existent language bias in VQA 1.0 by increasing the diversity of answers in similar types of questions, GQA (Hudson and Manning, 2019), in which questions required various reasoning skills (e.g., spatial reasoning, logical inference) to find the correct answer, and OK-VQA (Marino et al., 2019), in which models needed to access external knowledge such as Wikipedia. As a result, the field has attracted a lot of attention from researches all over the world, with a large number of models been proposed ever since (Antol et al., 2015; Ben-younes et al., 2017; Anderson et al., 2018; Kim et al., 2018; Cadène et al., 2019a; Li et al., 2019; Lu et al., 2019; Tan and Bansal, 2019; Li et al., 2020; Chen et al., 2020a; Jiang et al., 2020; Wang et al., 2020; Zhang et al., 2021; Huang et al., 2021; Yang et al., 2020; Hirota et al., 2021).
Although most of the effort has been focused on increasing the overall accuracy on the publicly available benchmarks, specially on the VQA 2.0 dataset, an important body of work (Agrawal et al., 2018; Clark et al., 2019; Cadène et al., 2019b; Chen et al., 2020b; Niu et al., 2021) has been devoted to address language bias, which refers to the existence of skewed distributions of answers with respect to a certain type of question. Even though VQA is a multi-modal task, because of the language bias, models tend to learn and make inferences based on superficial correlations, such as questions about bananas are answered yellow with high probability (Agrawal et al., 2018). This makes the models to ignore the visual information, which prevents generalization to out-of-distribution settings. Manjunatha et al. (Manjunatha et al., 2019) further examined this tendency by utilizing rule mining algorithms to correlate the questions, answers, and regions in which a model focuses. The results showed that predictions tend to contain miscellaneous rules; for example, when what and brand are in a question and there is a laptop in the image, the answer tends to be Dell. It was also observed that in What is he/she doing? type of questions, answers for men were more diverse (skateboarding, snowboarding, surfing), than answers for women (texting). Although this evidence points at skewed distributions in terms of gender, societal bias in VQA datasets have not been explicitly studied yet.
Societal bias in vision-and-language It is only in recent years that societal bias has been investigated in CV and NLP tasks (Buolamwini and Gebru, 2018; Zhao et al., 2017; Wang et al., 2019b, a; Thong and Snoek, 2021; Jia et al., 2020; Shankar et al., 2017; Bolukbasi et al., 2016). One significant study is Buolamwini and Gebru’s work (Buolamwini and Gebru, 2018) on commercial face recognition applications. They demonstrated that the system’s performance varies depending on the gender and race of the individual, and in particular, misjudges women with darker skin. In vision-and-language tasks, there has been some recent advancements, especially for image captioning (Hendricks et al., 2018; Zhao et al., 2021; Tang et al., 2021; Hirota et al., 2022). In one of the first studies, Burns et al. (Hendricks et al., 2018) showed that, instead of looking into the appearance of people, captioning models predicted gender words based on gender stereotypes in the contextual information. For example, when an image had a laptop, models generated the word man, even when there was only a woman. Similarly, Zhao et al. (Zhao et al., 2021) studied racial and gender bias. They found imbalances in gender and race representation in the COCO dataset (Lin et al., 2014), with more than twice images of men than of women and x more images of lighter-skinned than darker-skinned people. More recently, Hirota et al. (Hirota et al., 2022) proposed a metric to quantify gender and racial bias amplification of image captioning models. Given this context, in order to raise awareness and mitigate the damage societal bias may be causing to underrepresented communities, it is only natural to investigate whether other tasks and datasets within vision-and-language are also affected by this problem.
3. Preliminaries
We study gender and racial bias in VQA. We first describe the datasets under analysis in Section 3.1, and then, the methodology we followed in our experiments in Section 3.2.
| Year | Dataset | Num. Images | Source | Num. QA | QA Annotation | Answer Type |
|---|---|---|---|---|---|---|
| 2016 | Visual Genome (Krishna et al., 2017) | k | COCO† | M | Crowdsourcing | Open ended |
| 2016 | Visual7W (Zhu et al., 2016) | k | COCO | k | Crowdsourcing | Multiple choice |
| 2017 | VQA 2.0 (Goyal et al., 2017) | k | COCO | M | Crowdsourcing | Open ended |
| 2019 | GQA (Hudson and Manning, 2019) | k | COCO† | M | Automatic | Closed vocabulary |
| 2019 | OK-VQA (Marino et al., 2019) | k | COCO | k | Crowdsourcing | Open ended |
3.1. VQA datasets
We analyze five standard datasets, summarized in Table 1. Each dataset varies in the number of images, the number of questions, the annotation method, and the format of the answers; however, the images are from a common source, the COCO dataset (Lin et al., 2014). A detailed description for each dataset is provided below.
Visual Genome (Krishna et al., 2017) Visual Genome contains k images from the intersection of COCO (Lin et al., 2014) and YFCC100M (Thomee et al., 2016) datasets, and million question-answer pairs about the images. The answers are open-ended, which means they are freely written and their vocabulary is not restricted. Questions and answers were created by human annotators following three rules: 1) questions had to start with one of the six Ws: Who, Where, What, When, Why, and How, 2) ambiguous and speculative questions had to be avoided, and 3) questions had to be precise, unique, and relatable to the image, such that they had to be answerable if and only if the image was shown.
Visual7W (Zhu et al., 2016) Visual7W is composed of k QA pairs and M human-generated multiple choice answers on top of k COCO images. The dataset is characterized by object-level rationales and multiple choice answers, which means several candidate answers are provided per question with only one being the correct one. Each question starts with one of the seven Ws: What, Where, When, Who, Why, How, and Which. Annotators instructed to create question-answer pairs while being concise and unambiguous to avoid wordy or speculative questions. After that, other annotators check the question-answer pairs to see if an average person can answer them.
VQA 2.0 (Goyal et al., 2017) The dataset is built on COCO images and contains M question-answer pairs. The questions are categorized by question types defined by the first few words of questions (e.g., What is this, How many). The dataset is divided into training (k images and k questions), validation (k images and k questions), and test (k images and k questions) sets. VQA 2.0 is the de facto benchmark for natural image VQA. When making the questions, annotators freely create questions that people can answer while making questions not easy. Also, annotators are instructed to ask questions that require the image to answer. After that, ten different annotators answer each question. The answers of the test set are not published, so we use training and validation sets in our analysis.
GQA (Hudson and Manning, 2019) GQA is a large-scale VQA dataset with k images from the Visual Genome dataset and M question-answer pairs. Questions require many types of reasoning which measure e.g., logical inference. The question-answer pairs are automatically generated using question templates and scene graph representing all the objects and relationships in the image. Hence, the answers are limited to the words in the scene graphs, which we called closed vocabulary. Due to its large-scale, we use a random subset of roughly percent of the samples in our analysis.
OK-VQA (Marino et al., 2019) The dataset is built on a part of COCO images and contains k open-ended questions. Also, there are knowledge categories into which each question is classified (e.g., Science and Technology, Cooking and Food). The dataset comprises questions that require external knowledge (e.g., Wikipedia) to answer. Questions are written by human annotators following the same instructions as VQA 2.0, but the annotators are also encouraged to make questions that require external knowledge. Later, five different annotators write the answers to those questions.
3.2. Methodology

In Figure 2, we provide an overview of the methodology used to investigate gender and racial bias in VQA datasets. The first step is to select samples for each dataset with an explicit mention to gender (women/men questions) or race and ethnicity (racial questions). We use a rule-based approach to detect such samples. Then, we analyze gender/racial bias by comparing different sets. Concretely, we run statistics on the number of samples, analyze trends in the answers, and visually inspect for potential harmful data.
4. Gender Bias in VQA
We first analyze gender bias in VQA datasets. Following previous work (Hendricks et al., 2018; Zhao et al., 2021), we use a binary classification of gender, with the two gender categories being women and men. With a rule-based approach, we classify samples into women or men categories based on the gender words in the questions (if any). Specifically, we first define a list of words for women and men, e.g., woman, girl, she for women, man, boy, he for men.222The list of women/men words can be found in the appendix. When a question only includes women words, the question is classified as a women question, and vice versa. Questions that are not classified either as women or men are excluded. Note that this analysis is based on the VQA annotator’s perceived gender, and not on gender identity. We report our findings below.
| Dataset | Num. Men Qs | Num. Women Qs | MoW | Num. Gender Qs | Num. Total Qs | Ratio (%) |
|---|---|---|---|---|---|---|
| Visual Genome (Krishna et al., 2017) | M | |||||
| Visual7W (Zhu et al., 2016) | K | |||||
| VQA 2.0 (Goyal et al., 2017) | K | |||||
| GQA (Hudson and Manning, 2019) | M | |||||
| OK-VQA (Marino et al., 2019) | K |
4.1. Questions about men are dominant
The statistics of the number of women and men questions for each dataset are reported in Table 2. The number of questions about men is about twice as large as the number of questions about women in all the datasets. This tendency is consistent with the result in (Zhao et al., 2021), which shows that there are more than twice as many men images as women images in the COCO dataset (Lin et al., 2014). As all the datasets in Table 2 are based on COCO images, the root of the underrepresentation of women in VQA datasets may come from the original selection of images.
4.2. Answer distributions are skewed toward each gender
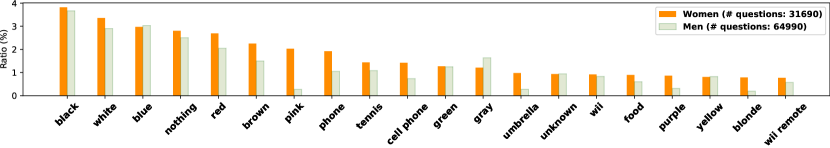
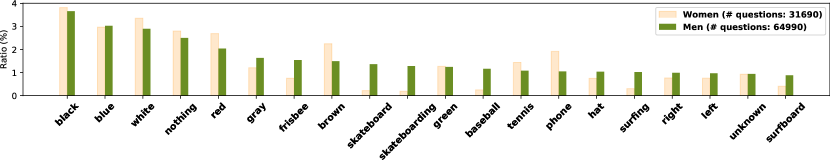
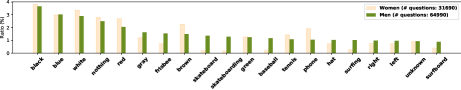
In Figure 3, we show the top- answers for women (above) and men (below) questions in the VQA 2.0 dataset. We filter out yes/no and numeric answers. Each distribution is normalized by the number of questions for the corresponding gender. Comparing the two answer distributions, we can see that there are more frequent answers about sports in men questions (frisbee, skateboard, skateboarding, baseball, tennis, surfing, and surfboard) than in women questions (tennis). Also, the differences in the ratios about sport answers are large between the two genders, perpetuating the stereotype that sport is an activity predominantly masculine. The top- answers for women questions with a notably higher ratio than men are pink, purple, blonde, and umbrella, most of them strongly associated with the traditional gender stereotype of feminine. We find these patterns are also exhibited in other datasets, e.g., Figure 1 in the appendix shows that the answers about sports are more frequent in men questions in the Visual7W dataset.
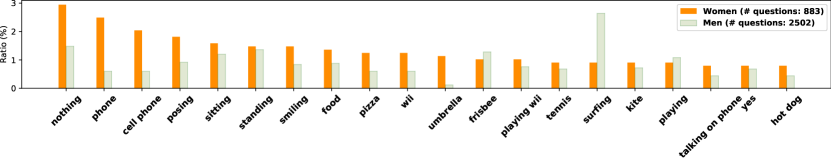
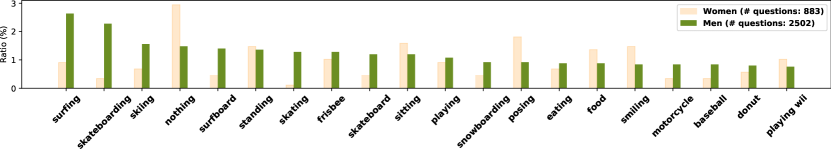
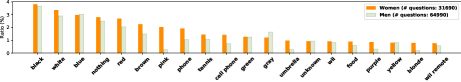
Figure 4 shows the women (above) and men (below) top-20 frequent answer distribution for the specific question type what is this in VQA 2.0 dataset, where the skew is more prominent. Answers for men questions include multiple sports words (e.g., surfing, skateboarding, skiing), with higher ratios than those of women. On the other hand, in women questions more motionless words appear (e.g., posing, sitting, smiling, talking on phone).
4.3. Gender-answer correlations reflect gender stereotypes and discrimination


We calculate the correlation between answers and women/men questions by utilizing the bias score (BS) defined in (Zhao et al., 2017). We adapt the definition of BS to remove the influence of the difference of the number of women/men questions. Let and denote a women question and a men question respectively, and the set of the answers. We filter answers that do not appear more than times333 is different among the datasets due to the size of each dataset. The detailed setting can be found in the appendix. in women/men questions. Our BS gives the degree to which an answer is biased with respect to a men questions :
| (1) |
where is the number of co-occurrences of and or , and is the ratio of the number of the men and women questions (i.e., ). If is close to , then the answer is correlated with men questions. On the contrary, if is close to , answer is correlated with women questions. The difference between BS and Figure 3 and 4 is that the distribution of BS shows the answers that often appear only in questions of one gender. For example, in Figure 3, black is the most common answer for both gender questions, but it is not biased towards any gender, in which case the value of BS is close to .
The top- answers that are correlated with each gender based on BS in VQA 2.0 are shown in Figure 5. In a bias-free dataset, the distribution of BS would be flat, which reveals that the VQA 2.0 dataset contains strong gender bias in their answers. Again, many sport words (e.g., skateboarding, baseball, snowboarding) are strongly correlated toward men questions, while no answers about sports are highly related to women questions. On the other hand, food-related words (e.g., wine, knife, cake) are highly correlated to women questions. This trend is common in other datasets as well; for example, in GQA (Figure 2 in the appendix), sports or outdoor words (e.g., skating, surfing, tan) made up most of the top- answers for men questions, while there are no sports or activity-related answers in the case of women, and instead, static words (e.g., umbrella, sofa, and posing) are common. Similarly to the results in the previous section, these results are a reflection of the real-world stereotypes that leads to gender bias and discrimination.
4.4. Topics of the questions are significantly different between women and men
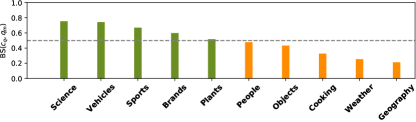
Next, we examine gender representation among different question categories. For this analysis, we use the OK-VQA dataset (Marino et al., 2019), whose questions are categorized into 10 classes. 444Science (Science and Technology), Vehicles (Vehicles and Transportation), Sports (Sports and Recreation), Brands (Brands, Companies and Products), Plants (Plants and Animals), People (People and Everyday life), Objects (Objects, Material and Clothing), Cooking (Cooking and Food), Weather (Weather and Climate), Geography (Geography, History, Language and Culture) Specifically, we adapt Eq. (1) by replacing the answer with question category . In other words, we calculate the degree to which each question category is biased with respect to men questions.
Results in Figure 6 show that some categories are strongly correlated with gender. The most correlated category with men is Science, followed by Vehicles, and Sports. On the other hand, Geography questions (which is a category gathering geography, history, language, and culture together) are biased towards women, together with Weather, and Cooking. From these observations, we conclude that men are women are differently represented in the dataset, where men are often associated with science and technology whereas women are tied to liberal arts and cooking (Van der Vleuten et al., 2016).
4.5. Gender-stereotypical samples
Aside from the statistics in the preceding sections, we manually explore each dataset for potentially sexist or harmful samples. Specifically, we investigate more than samples for each dataset and we find that the datasets in which different annotators generate the questions and the answers separately (i.e., VQA 2.0 (Goyal et al., 2017) and OK-VQA (Marino et al., 2019)) often contain gender-stereotypical samples. Also, Visual Genome (Krishna et al., 2017), which is no filtering to ensure questions are visually grounded, contains such samples. On the contrary, GQA (Hudson and Manning, 2019), which automatically generates samples, and Visual7W (Zhu et al., 2016), which filters out not visually grounded samples, do not contain such samples.

Some examples, consisting of an image, a question, and ground truth answers, are shown in Figure 7. More examples can be found in the appendix. In the top-row left example, to the question about the topic of the conversation between the two women, which cannot be inferred using visual clues, some annotators provided gender-stereotypical answers such as men, hair, and shopping, probably based on their own prejudices about women. Similarly, in the top-row right example of Figure 7, the question asks what the man is looking at, but it cannot be seen in the image. In this case, the provided answers contain the words girl and woman. The common denominator in these examples is that their questions are not visually grounded: there is no definite and unambiguous evidence in the image to answer.
Additionally, we find some inappropriate or directly harmful examples. For instance, the top-row middle question in Figure 7 has a sexual connotation about the woman in the image, and in the second-row left image in Figure 7, where a woman is just standing in front of a mirror with a camera, one of the ground truth answers to the question of what is she doing is flirt, implying that the mere fact that a woman is standing is to seduce someone.
4.6. Discussion
Biased distributions We have shown that the ratio of men questions over women questions and the answer distributions are biased in all datasets. Especially for the ratio of men questions over women questions, we know the real-world ratio of the men to women is roughly . Hence, the skew of the ratio of men questions over women questions in VQA datasets (i.e., men questions are about twice as numerous as women questions) is far from the real world distribution. That is unfair underrepresentation of women and could lead machine learning models trained on these datasets to potentially ignore women. This means that models perpetuate the underrepresentation of women unveiled in the dataset, which is very problematic from the perspective of gender equality.
As for the answer distributions, while we have shown that the answer distributions are highly skewed toward each gender, it is difficult to know the real-world distributions (e.g., the actual gender ratio among those who snowboard). Furthermore, realistically, the gender ratio for the answers cannot be aligned, and even if it could be, the gender bias in models might not disappear (Wang et al., 2019b; Buolamwini and Gebru, 2018). However, machine learning models trained on these datasets without considering the biased distributions can learn to ignore underrepresented combinations in the datasets (e.g., a woman who snowboards) and lead to shortcut learning (Geirhos et al., 2020; Kervadec et al., 2021). Being aware of such bias toward each gender encourages the community to design better model architectures and training paradigms to mitigate the bias, which is a research direction to be further explored, as in (Hendricks et al., 2018).
Gender-stereotypical examples Compared to the skewed answer distributions, gender-discriminatory samples are undoubtedly harmful. Such samples are often found when the associated question is not visually grounded. For such questions, annotators may answer based on their gender stereotypes. Such harmful samples are found in datasets in which not visually grounded questions are not filtered (i.e., VQA 2.0, OK-VQA, and Visual Genome). Also, in VQA 2.0 and OK-VQA, the annotators who create the questions are different from those who answer them. This choice is to deal with the problem of multiple possible correct answers to the same question (Antol et al., 2015). Although the process allows the datasets to have diverse answers, it does not require the annotators to answer to their own questions and gives room to make questions that are not visually grounded. On the other hand, in GQA and Visual7W, while not visually grounded questions hardly exist because of the datasets construction, the diversity of answers is limited. In conclusion, manual removal of potential harmful questions may be necessary to ensure ethical goodness. Thus, it may be a good practice to build an efficient mechanism to report potential ethical problems and review them on a regular basis to decide whether some samples should be removed.
5. Racial Bias in VQA
| Dataset | Num. Racial Qs | Num. Total Qs | Ratio (%) |
|---|---|---|---|
| Visual Genome (Krishna et al., 2017) | M | ||
| Visual7W (Zhu et al., 2016) | K | ||
| VQA 2.0 (Goyal et al., 2017) | K | ||
| GQA (Hudson and Manning, 2019) | M | ||
| OK-VQA (Marino et al., 2019) | K |
To study racial bias, we first identify samples in the dataset with a reference to race or ethnicity. We select all the samples whose questions explicitly contain the words race or ethnicity. We refer to these samples as racial samples or racial questions. Additionally, we elaborate a list of racial-related words (e.g., Asian, Caucasian, Black) and nationality-related words (e.g., American, Chinese, Indian) from the answers in VQA 2.0.555The complete list of words can be found in the appendix. Our findings are reported below.
5.1. Most datasets contain racial words
The number of racial samples per dataset is shown in Table 3. All datasets contain racial questions. However, the ratio of racial questions is very small for GQA, whose questions and answers were created automatically from the image’s scene graph, and for Visual7W, in which annotators had explicit instructions to write visually grounded questions, and inappropriate samples were filtered. In contrast, VQA 2.0, Visual Genome, and OK-VQA show higher ratios of racial questions. As the absolute number in OK-VQA is small, we conduct our analysis in the VQA 2.0 and Visual Genome.
5.2. White people are majority, and Black people are minority
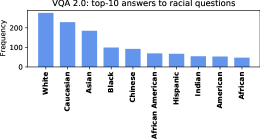
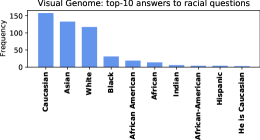
First, we investigate the distribution of answers for racial questions. To remove answers that may not be related to race, ethnicity, or nationality, we filter yes, no, horse666When horse is in the answers, the questions are more likely to ask about horse race rather than race of individuals. and answers to questions about colors777This is to avoid confusing answers about color with race.. In Figure 8, we show the top- answers to racial questions in VQA 2.0 and Visual Genome. In both datasets, the demographic group that occupies the largest amount of answers is related to White people (White, Caucasian), followed by Asian people related words (Asian, Chinese). On the contrary, words usually associated with Black people (Black, African American, African) and Hispanic people (Hispanic) appear less frequently, showing an underrepresentation of darker-skinned people on the analyzed samples. This tendency has also been observed in other computer vision datasets, such as facial recognition (e.g., % subjects are lighter-skinned in IJB-A (Klare et al., 2015; Buolamwini and Gebru, 2018)), or in image captioning (Zhao et al., 2021). This imbalance can lead to poor performance on images of darker-skinned people in models trained on such datasets.
5.3. US-centric perspective of nationality and race
We next explore the relationship between race and nationality in the VQA 2.0 dataset. We examine the co-occurrence of nationality-related and racial-related words in the answers. We roughly categorize them into three races or ethnicities: African-oriented (with the words Black and African), Asian-oriented (with the words Asian and Oriental), and White-oriented (with the words White and Caucasian).888More categories are not include due to the limited number of the samples.
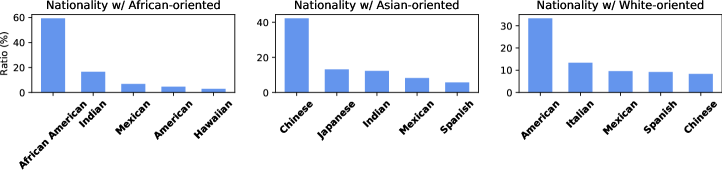
Figure 9 shows the top- nationalities co-occurring with each racial category. Each racial category is strongly tied to a specific country. The result in Figure 9 (left) shows that about % of Black people are considered to be American (i.e., African American or American). As for Asian-oriented category, most of the nationality answers are Chinese with a 42% ratio, followed by Japanese and Indian with a 13% and 12% ratio, respectively (Figure 9 (middle)). Regarding the White-oriented category, American is the most frequent nationality answer with a % ratio (Figure 9 (right)). As the concept of race is highly tied to the social and cultural background of each individual (Hanna et al., 2020), it is remarkable to note that the relationship between race and nationality in the analyzed datasets seems to be rooted in a United States point of view where White and Black people are associated with American nationality, and Asian people with Chinese nationality. This is probably the result of a US-centric annotation process.
5.4. Racial-stereotypical examples
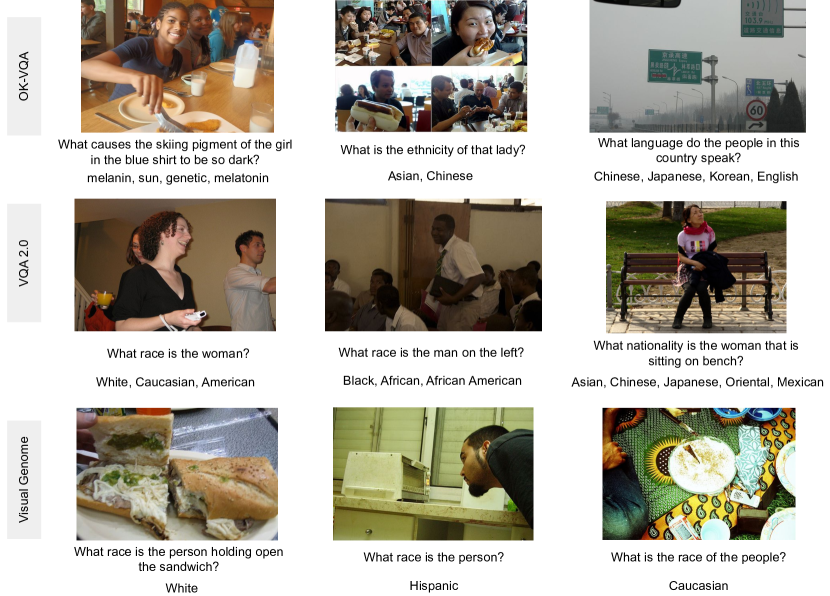
We manually inspect all the racial samples for all the datasets to check whether they can be potentially harmful. In addition to this, we conduct an intersectional analysis and explore more than samples of women and men questions for each dataset in terms of racial bias. We find that there are two types of samples with racial bias: 1) racial discriminatory samples, and 2) biased judgment samples. Such examples appear in the VQA 2.0, Visual Genome, and OK-VQA datasets, and some of them are shown in Figure 10. More can be found in the appendix.
Some samples that fall into the racial discriminatory category are shown in Figure 10. For example, in the top-row left example, the question What causes the skiing pigment of the girl in the blue shirt to be so dark? implies that lighter-skin is the standard. Another example is shown in Figure 10 second-row right image, whose question asks about the woman’s nationality. One of the answers, Oriental, is an outdated term that has not been used in US federal laws since (Park, 2016). Still, it appears times as an answer in VQA 2.0. With respect to biased judgment samples, they often appear in questions that are not visually grounded. In other words, when there is no clue in the image to identify the race, ethnicity, or nationality. For example, in Figure 10 bottom-row left image, the answer is White even though we can only see the tips of the fingers. A similar case can be seen in the bottom-row right example.
5.5. Discussion
Biased distributions In VQA 2.0 and Visual Genome, the number of samples related to White people is much greater than samples related to Black and Hispanic people (e.g., there are x more samples related to White people than Black people in VQA 2.0). The skewed distribution of race can be problematic if models trained on those datasets are used in real world applications, as the underrepresentation of certain races or ethnicities may lead to biased answers. Although it seems ideal to have a uniform racial distribution, race itself is a vague concept, which is strongly tied to the personal background of each individual (Hanna et al., 2020). Furthermore, aligning racial distributions alone is insufficient to remove racial bias from the models (Buolamwini and Gebru, 2018; Wang et al., 2019b). For these reasons, it is essential to make an effort to have racial diversity in the datasets, but at the same time, it is vital to devise learning strategies that can debias the datasets.
Biased samples Even though the number of racial questions is relatively small, the stereotypical samples in terms of race are unquestionably harmful and should be removed from the datasets. Datasets that have not gone through manual screening to remove samples that are not visually grounded are the most affected ones (VQA 2.0, Visual Genome, and OK-VQA). Also, the problem is accentuated in VQA 2.0 and OK-VQA, which increased the diversity in their answer set by making different annotators to answer the written questions. As samples with racial discrimination or biased judgment of race/nationality may reflect the bias in the annotators, an unconstrained or less-constrained annotation process may be prone to contain such harmful samples. This is supported by the fact that, we could not find such samples in GQA, which automatically generates question-answer pairs, or Visual7W, which applies manual filtering to exclude questions that are not based visually grounded. Because of this, an additional cleansing process on the samples may be a necessary strategy to remove samples with racial discrimination and biased judgment.
Necessity versus validity of asking questions about race We take a step back and cast doubt on asking about race in the first place. Although race has been used to categorize people for a long time, it is extremely hard to provide fixed categories in which people from different backgrounds fit together (Khan and Fu, 2021). Moreover, visual information alone is hardly sufficient to identify one’s race, ethnicity, or nationality, so asking this type of question is prone to cause biased answers based on stereotypes. Thus, we believe that, at least in VQA datasets, questions about race should be discouraged.
6. Possible Solutions
In order to reduce the risks associated with gender and racial bias, we would like to encourage VQA researchers to increase their awareness to this problem and take steps to address it. We specifically discuss possible solutions to address the two major problems presented in this paper: skewed distributions and harmful samples.
Skewed distributions We have shown that the analyzed VQA datasets have distributional bias related to gender (Section 4) and, some of them, to race (Section 5). Aligning the distributions is tricky for many reasons, such as the existence of bias in the real-world and the ambiguity of race categorization. Furthermore, even if the distributions could be aligned, this is not sufficient for bias-free models; models can still amplify bias. Nevertheless, if the distributions are too skewed in gender and race, models are more likely to ignore underrepresented groups of people and increase the risk of shortcut learning. Therefore, efforts should be made to avoid this underrepresentation. More importantly, we encourage the users of the datasets to be aware of the distributional biases related to gender and race in VQA datasets and design models and training paradigms that can address these issues.
Harmful samples We have found that some of the VQA datasets contain harmful samples that exhibit gender or racial stereotypes. Such samples are often found when the associated question is unanswerable from the image content. Thus, datasets that have no filtering processes, such as VQA 2.0, Visual Genome, OK-VQA, are prone to contain such samples. Also, questions and answers themselves can be discriminatory. The ideal solution is to remove harmful samples by conducting a manual filtering, but the cost for such a process can be extremely expensive, especially if the size of dataset is large. So, we propose three alternative solutions to address both the ethical and the cost problems: 1) automatic screening, 2) ethical instructions, and 3) a feedback platform for users.
For the automatic screening, we propose to train a model to identify unanswerable questions from images. To train such a model, a labeled dataset to identify whether a question is answerable from an image might be necessary. With a trained model, visually not grounded samples could be potentially filtered out. Although the model’s performance is not guaranteed, it could be used to ease the manual screening process as a pre-filtering step.
The second proposed solution is to incorporate ethical instruction in the dataset’s annotation process. Ethical instructions are not commonly provided to annotators when creating VQA datasets. Nevertheless, as we have shown, VQA datasets can contain harmful samples; so instruction for annotators to be aware of making ethical questions and answers could reduce the amount of harmful samples. In this paper, we only focused on gender and race as demographic attributes, but ethical instructions should be extended to make datasets fairer with respect to any other attributes.
The last solution is to create a platform to report potential ethical problems and review them to decide whether they should be removed. The platform should allow dataset users to report and share with dataset developers when they find harmful samples in their use or investigation of datasets. This platform would be based on the idea of shifting from the traditional developer-driven paradigm of dataset creation to a user-participatory paradigm. Incorporating a process that allows users to improve datasets can solve both cost and ethics issues at a high level.
7. Conclusion
We investigated gender and racial bias in VQA datasets through the compilation of statistics and the manual exploration of harmful samples. The results showed: 1) distributions are very skewed concerning gender or race, and 2) harmful samples, denoting annotators’ gender or racial stereotypes, exist in VQA datasets. Additionally, we discussed potential solutions. We proposed the automatic screening of samples, the inclusion of ethical instructions in the annotations process, and the creation of a platform for receiving user’s feedback. Through the analysis and discussion in this paper, we hope to raise awareness and encourage the VQA research community to take measures to mitigate societal bias.
Funding
This research was partially supported by JST CREST Grant No. JPMJCR20D3 (JST) and JSPS KAKENHI No. JP22K12091 (JSPS). The JST and JSPS had no role in the design and conduct of the study; access and collection of data; analysis and interpretation of data; preparation, review, or approval of the manuscript; or the decision to submit the manuscript for publication. The authors declare no other financial interests.
References
- (1)
- Achlioptas et al. (2021) Panos Achlioptas, Zhenyu Chen, Mohamed Elhoseiny, Angel X Chang, Matthias Niessner, and Leonidas Guibas. 2021. 1st Workshop on Language for 3D Scenes. Workshop at CVPR 2021. https://language3dscenes.github.io/.
- Agrawal et al. (2018) Aishwarya Agrawal, Dhruv Batra, Devi Parikh, and Aniruddha Kembhavi. 2018. Don’t Just Assume; Look and Answer: Overcoming Priors for Visual Question Answering. In CVPR. Computer Vision Foundation / IEEE Computer Society, 4971–4980.
- Anderson et al. (2018) Peter Anderson, Xiaodong He, Chris Buehler, Damien Teney, Mark Johnson, Stephen Gould, and Lei Zhang. 2018. Bottom-Up and Top-Down Attention for Image Captioning and Visual Question Answering. In CVPR. Computer Vision Foundation / IEEE Computer Society, 6077–6086.
- Antol et al. (2015) Stanislaw Antol, Aishwarya Agrawal, Jiasen Lu, Margaret Mitchell, Dhruv Batra, C. Lawrence Zitnick, and Devi Parikh. 2015. VQA: Visual Question Answering. In ICCV. IEEE Computer Society, 2425–2433.
- Ben-younes et al. (2017) Hedi Ben-younes, Rémi Cadène, Matthieu Cord, and Nicolas Thome. 2017. MUTAN: Multimodal Tucker Fusion for Visual Question Answering. In ICCV. IEEE Computer Society, 2631–2639.
- Bolukbasi et al. (2016) Tolga Bolukbasi, Kai-Wei Chang, James Y. Zou, Venkatesh Saligrama, and Adam Tauman Kalai. 2016. Man is to Computer Programmer as Woman is to Homemaker? Debiasing Word Embeddings. (2016), 4349–4357.
- Bugliarello et al. (2021) Emanuele Bugliarello, Kai-Wei Chang, Desmond Elliott, Spandana Gella, Aishwarya Kamath, Liunian Harold Li, Fangyu Liu, Jonas Pfeiffer, Edoardo M. Ponti, Krishna Srinivasan, Ivan Vulić, Yinfei Yang, and Da Yin. 2021. Workshop on Multilingual Multimodal Learning. Workshop at ACL 2021. https://mml-workshop.github.io/.
- Buolamwini and Gebru (2018) Joy Buolamwini and Timnit Gebru. 2018. Gender Shades: Intersectional Accuracy Disparities in Commercial Gender Classification. In FAT (Proceedings of Machine Learning Research, Vol. 81). PMLR, 77–91.
- Cadène et al. (2019a) Rémi Cadène, Hedi Ben-younes, Matthieu Cord, and Nicolas Thome. 2019a. MUREL: Multimodal Relational Reasoning for Visual Question Answering. In CVPR. Computer Vision Foundation / IEEE, 1989–1998.
- Cadène et al. (2019b) Rémi Cadène, Corentin Dancette, Hedi Ben-younes, Matthieu Cord, and Devi Parikh. 2019b. RUBi: Reducing Unimodal Biases for Visual Question Answering. (2019), 839–850.
- Chen et al. (2020b) Long Chen, Xin Yan, Jun Xiao, Hanwang Zhang, Shiliang Pu, and Yueting Zhuang. 2020b. Counterfactual Samples Synthesizing for Robust Visual Question Answering. In CVPR. Computer Vision Foundation / IEEE, 10797–10806.
- Chen et al. (2015) Xinlei Chen, Hao Fang, Tsung-Yi Lin, Ramakrishna Vedantam, Saurabh Gupta, Piotr Dollár, and C. Lawrence Zitnick. 2015. Microsoft COCO Captions: Data Collection and Evaluation Server. CoRR abs/1504.00325 (2015).
- Chen et al. (2020a) Yen-Chun Chen, Linjie Li, Licheng Yu, Ahmed El Kholy, Faisal Ahmed, Zhe Gan, Yu Cheng, and Jingjing Liu. 2020a. UNITER: UNiversal Image-TExt Representation Learning. In ECCV (30) (Lecture Notes in Computer Science, Vol. 12375). Springer, 104–120.
- Clark et al. (2019) Christopher Clark, Mark Yatskar, and Luke Zettlemoyer. 2019. Don’t Take the Easy Way Out: Ensemble Based Methods for Avoiding Known Dataset Biases. (2019), 4067–4080.
- Elhoseiny et al. (2021) Mohamed Elhoseiny, Xin Eric Wang, Andrew Brown, Anna Rohrbach, and Marcus Rohrbach. 2021. 4th Workshop on Closing the Loop Between Vision and Language. Workshop at ICCV 2021. https://sites.google.com/view/iccv21clvl.
- Garcia et al. (2020) Noa Garcia, Mayu Otani, Chenhui Chu, and Yuta Nakashima. 2020. KnowIT VQA: Answering Knowledge-Based Questions about Videos. In AAAI. AAAI Press, 10826–10834.
- Geirhos et al. (2020) Robert Geirhos, Jörn-Henrik Jacobsen, Claudio Michaelis, Richard S. Zemel, Wieland Brendel, Matthias Bethge, and Felix A. Wichmann. 2020. Shortcut learning in deep neural networks. Nat. Mach. Intell. 2, 11 (2020), 665–673.
- Goyal et al. (2017) Yash Goyal, Tejas Khot, Douglas Summers-Stay, Dhruv Batra, and Devi Parikh. 2017. Making the V in VQA Matter: Elevating the Role of Image Understanding in Visual Question Answering. In CVPR. IEEE Computer Society, 6325–6334.
- Gurari et al. (2018) Danna Gurari, Qing Li, Abigale J. Stangl, Anhong Guo, Chi Lin, Kristen Grauman, Jiebo Luo, and Jeffrey P. Bigham. 2018. VizWiz Grand Challenge: Answering Visual Questions From Blind People. In CVPR. Computer Vision Foundation / IEEE Computer Society, 3608–3617.
- Hanna et al. (2020) Alex Hanna, Emily Denton, Andrew Smart, and Jamila Smith-Loud. 2020. Towards a critical race methodology in algorithmic fairness. In FAT*. ACM, 501–512.
- Hendricks et al. (2018) Lisa Anne Hendricks, Kaylee Burns, Kate Saenko, Trevor Darrell, and Anna Rohrbach. 2018. Women Also Snowboard: Overcoming Bias in Captioning Models. In ECCV (3) (Lecture Notes in Computer Science, Vol. 11207). Springer, 793–811.
- Hirota et al. (2021) Yusuke Hirota, Noa Garcia, Mayu Otani, Chenhui Chu, Yuta Nakashima, Ittetsu Taniguchi, and Takao Onoye. 2021. Visual Question Answering with Textual Representations for Images. In ICCVW. IEEE, 3147–3150.
- Hirota et al. (2022) Yusuke Hirota, Yuta Nakashima, and Noa Garcia. 2022. Quantifying Societal Bias Amplification in Image Captioning. In CVPR.
- Huang et al. (2021) Zhicheng Huang, Zhaoyang Zeng, Yupan Huang, Bei Liu, Dongmei Fu, and Jianlong Fu. 2021. Seeing Out of the Box: End-to-End Pre-Training for Vision-Language Representation Learning. In CVPR. Computer Vision Foundation / IEEE, 12976–12985.
- Hudson and Manning (2019) Drew A. Hudson and Christopher D. Manning. 2019. GQA: A New Dataset for Real-World Visual Reasoning and Compositional Question Answering. In CVPR. Computer Vision Foundation / IEEE, 6700–6709.
- Jia et al. (2020) Shengyu Jia, Tao Meng, Jieyu Zhao, and Kai-Wei Chang. 2020. Mitigating Gender Bias Amplification in Distribution by Posterior Regularization. (2020), 2936–2942.
- Jiang et al. (2020) Huaizu Jiang, Ishan Misra, Marcus Rohrbach, Erik G. Learned-Miller, and Xinlei Chen. 2020. In Defense of Grid Features for Visual Question Answering. In CVPR. Computer Vision Foundation / IEEE, 10264–10273.
- Kervadec et al. (2021) Corentin Kervadec, Grigory Antipov, Moez Baccouche, and Christian Wolf. 2021. Roses Are Red, Violets Are Blue… but Should VQA Expect Them To?. In CVPR. Computer Vision Foundation / IEEE, 2776–2785.
- Khan and Fu (2021) Zaid Khan and Yun Fu. 2021. One Label, One Billion Faces: Usage and Consistency of Racial Categories in Computer Vision. In FAccT. ACM, 587–597.
- Kim et al. (2018) Jin-Hwa Kim, Jaehyun Jun, and Byoung-Tak Zhang. 2018. Bilinear Attention Networks. (2018), 1571–1581.
- Klare et al. (2015) Brendan F. Klare, Ben Klein, Emma Taborsky, Austin Blanton, Jordan Cheney, Kristen Allen, Patrick Grother, Alan Mah, Mark James Burge, and Anil K. Jain. 2015. Pushing the frontiers of unconstrained face detection and recognition: IARPA Janus Benchmark A. In CVPR. IEEE Computer Society, 1931–1939.
- Krishna et al. (2017) Ranjay Krishna, Yuke Zhu, Oliver Groth, Justin Johnson, Kenji Hata, Joshua Kravitz, Stephanie Chen, Yannis Kalantidis, Li-Jia Li, David A. Shamma, Michael S. Bernstein, and Li Fei-Fei. 2017. Visual Genome: Connecting Language and Vision Using Crowdsourced Dense Image Annotations. Int. J. Comput. Vis. 123, 1 (2017), 32–73.
- Li et al. (2019) Liunian Harold Li, Mark Yatskar, Da Yin, Cho-Jui Hsieh, and Kai-Wei Chang. 2019. VisualBert: A Simple and Performant Baseline for Vision and Language. arXiv preprint arXiv:1908.03557 (2019).
- Li et al. (2020) Xiujun Li, Xi Yin, Chunyuan Li, Pengchuan Zhang, Xiaowei Hu, Lei Zhang, Lijuan Wang, Houdong Hu, Li Dong, Furu Wei, et al. 2020. OSCAR: Object-Semantics Aligned Pre-training for Vision-Language Tasks. In ECCV.
- Lin et al. (2014) Tsung-Yi Lin, Michael Maire, Serge J. Belongie, James Hays, Pietro Perona, Deva Ramanan, Piotr Dollár, and C. Lawrence Zitnick. 2014. Microsoft COCO: Common Objects in Context. In ECCV (5) (Lecture Notes in Computer Science, Vol. 8693). Springer, 740–755.
- Lu et al. (2019) Jiasen Lu, Dhruv Batra, Devi Parikh, and Stefan Lee. 2019. ViLBERT: Pretraining Task-Agnostic Visiolinguistic Representations for Vision-and-Language Tasks. (2019), 13–23.
- Malinowski and Fritz (2014) Mateusz Malinowski and Mario Fritz. 2014. A Multi-World Approach to Question Answering about Real-World Scenes based on Uncertain Input. (2014), 1682–1690.
- Manjunatha et al. (2019) Varun Manjunatha, Nirat Saini, and Larry S. Davis. 2019. Explicit Bias Discovery in Visual Question Answering Models. In CVPR. Computer Vision Foundation / IEEE, 9562–9571.
- Marino et al. (2019) Kenneth Marino, Mohammad Rastegari, Ali Farhadi, and Roozbeh Mottaghi. 2019. OK-VQA: A Visual Question Answering Benchmark Requiring External Knowledge. In CVPR. Computer Vision Foundation / IEEE, 3195–3204.
- Mosbach et al. (2021) Marius Mosbach, Sandro Pezzelle, Michael A. Hedderich, Dietrich Klakow, Marie-Francine Moens, and Zeynep Akata. 2021. LANTERN - The Third Workshop Beyond Vision and Language: Integrating Real World Knowledge. Workshop at EACL 2021. https://www.lantern.uni-saarland.de/2021/.
- Niu et al. (2021) Yulei Niu, Kaihua Tang, Hanwang Zhang, Zhiwu Lu, Xian-Sheng Hua, and Ji-Rong Wen. 2021. Counterfactual VQA: A Cause-Effect Look at Language Bias. In CVPR. Computer Vision Foundation / IEEE, 12700–12710.
- Park (2016) Madison Park. 2016. U.S. government to stop using these words to refer to minorities. CNN. https://edition.cnn.com/2016/05/22/politics/obama-federal-law-minorities-references/index.html.
- Shankar et al. (2017) Shreya Shankar, Yoni Halpern, Eric Breck, James Atwood, Jimbo Wilson, and D Sculley. 2017. No Classification Without Representation: Assessing Geodiversity Issues in Open Data Sets for the Developing World. NeurIPS Workshop (2017).
- Sharma et al. (2018) Piyush Sharma, Nan Ding, Sebastian Goodman, and Radu Soricut. 2018. Conceptual Captions: A Cleaned, Hypernymed, Image Alt-text Dataset For Automatic Image Captioning. In ACL (1). Association for Computational Linguistics, 2556–2565.
- Shrivastava et al. (2021) Ayush Shrivastava, Yash Mukund Kant, Satwik Kottur, Dhruv Batra, Devi Parikh, and Aishwarya Agrawal. 2021. Visual Question Answering Workshop. Workshop at CVPR 2021. https://visualqa.org/workshop.
- Tan and Bansal (2019) Hao Tan and Mohit Bansal. 2019. LXMERT: Learning Cross-Modality Encoder Representations from Transformers. (2019), 5099–5110.
- Tang et al. (2021) Ruixiang Tang, Mengnan Du, Yuening Li, Zirui Liu, Na Zou, and Xia Hu. 2021. Mitigating Gender Bias in Captioning Systems. In WWW. ACM / IW3C2, 633–645.
- Thomee et al. (2016) Bart Thomee, David A. Shamma, Gerald Friedland, Benjamin Elizalde, Karl Ni, Douglas Poland, Damian Borth, and Li-Jia Li. 2016. YFCC100M: the new data in multimedia research. Commun. ACM 59, 2 (2016), 64–73.
- Thong and Snoek (2021) William Thong and Cees GM Snoek. 2021. Feature and Label Embedding Spaces Matter in Addressing Image Classifier Bias. In BMVC.
- Van der Vleuten et al. (2016) Maaike Van der Vleuten, Eva Jaspers, Ineke Maas, and Tanja van der Lippe. 2016. Boys’ and Girls’ Educational Choices in Secondary Education. The Role of Gender Ideology. Educational Studies (2016).
- Vinyals et al. (2017) Oriol Vinyals, Alexander Toshev, Samy Bengio, and Dumitru Erhan. 2017. Show and Tell: Lessons Learned from the 2015 MSCOCO Image Captioning Challenge. IEEE Trans. Pattern Anal. Mach. Intell. 39, 4 (2017), 652–663.
- Wang et al. (2019a) Mei Wang, Weihong Deng, Jiani Hu, Xunqiang Tao, and Yaohai Huang. 2019a. Racial Faces in the Wild: Reducing Racial Bias by Information Maximization Adaptation Network. In ICCV. IEEE, 692–702.
- Wang et al. (2020) Tan Wang, Jianqiang Huang, Hanwang Zhang, and Qianru Sun. 2020. Visual Commonsense R-CNN. In CVPR. Computer Vision Foundation / IEEE, 10757–10767.
- Wang et al. (2019b) Tianlu Wang, Jieyu Zhao, Mark Yatskar, Kai-Wei Chang, and Vicente Ordonez. 2019b. Balanced Datasets Are Not Enough: Estimating and Mitigating Gender Bias in Deep Image Representations. In ICCV. IEEE, 5309–5318.
- Wu and Gan (2021) Qi Wu and Zhe Gan. 2021. From VQA to VLN: Recent Advances in Vision-and-Language Research. Tutorial at CVPR 2021. https://vqa2vln-tutorial.github.io/.
- Yang et al. (2020) Zekun Yang, Noa Garcia, Chenhui Chu, Mayu Otani, Yuta Nakashima, and Haruo Takemura. 2020. BERT Representations for Video Question Answering. In WACV. IEEE, 1545–1554.
- You et al. (2016) Quanzeng You, Hailin Jin, Zhaowen Wang, Chen Fang, and Jiebo Luo. 2016. Image Captioning with Semantic Attention. In CVPR. IEEE Computer Society, 4651–4659.
- Zhang et al. (2021) Pengchuan Zhang, Xiujun Li, Xiaowei Hu, Jianwei Yang, Lei Zhang, Lijuan Wang, Yejin Choi, and Jianfeng Gao. 2021. VinVL: Revisiting Visual Representations in Vision-Language Models. In CVPR. Computer Vision Foundation / IEEE, 5579–5588.
- Zhao et al. (2021) Dora Zhao, Angelina Wang, and Olga Russakovsky. 2021. Understanding and Evaluating Racial Biases in Image Captioning. In ICCV. IEEE, 14810–14820.
- Zhao et al. (2017) Jieyu Zhao, Tianlu Wang, Mark Yatskar, Vicente Ordonez, and Kai-Wei Chang. 2017. Men Also Like Shopping: Reducing Gender Bias Amplification using Corpus-level Constraints. In EMNLP. Association for Computational Linguistics, 2979–2989.
- Zhu et al. (2016) Yuke Zhu, Oliver Groth, Michael S. Bernstein, and Li Fei-Fei. 2016. Visual7W: Grounded Question Answering in Images. In CVPR. IEEE Computer Society, 4995–5004.
Appendix A Gender Bias in VQA
Gender words
We list the female/male words that are used to define female/male questions: woman, female, lady, mother, girl, aunt, wife, actress, princess, waitress, sister, queen, pregnant, daughter, girlfriend, chairwoman, policewoman, she, her, hers, herself, man, male, father, gentleman, boy, uncle, husband, actor, prince, waiter, son, brother, guy, emperor, dude, cowboy, boyfriend, chairman, policeman, he, his, him, himself and their plurals. Orange denotes female words, whereas green denotes male words. We select the gender words by investigating the datasets manually.
Answer distributions are skewed toward each gender.


In the main paper, we show the top- answers of VQA 2.0 (Goyal et al., 2017). In the appendix, we also show the results of the other datasets (GQA (Hudson and Manning, 2019), Visual Genome (Krishna et al., 2017), Visual7W (Zhu et al., 2016), and OK-VQA (Marino et al., 2019)). As well as VQA 2.0, the distributions for women/men questions are skewed toward each gender in the other datasets.
Gender-answer correlations reflect gender stereotypes and discrimination.
Here, we describe the detailed setting for BS (Section 4.3 in the main paper). We filter answers that do not appear more than times in women/men questions. For each dataset, we use: (VQA 2.0), (Visual Genome), (GQA), (Visual7W), (OK-VQA).
We show the results of BS for GQA, Visual Genome, Visual7W, and OK-VQA in Figure 12. As in the case of VQA 2.0 in the main paper, the distributions are highly skewed toward each gender.


Gender-stereotypical samples
Appendix B Racial Bias in VQA
Racial-related words and nationality-related words
We show the full list of racial-related words and nationality-related words used for the analysis in the paper.
The list of racial-related words is: Black, African, Africa, Latino, Latina, Latinx, Hispanic, White, Caucasian, Asian, Oriental, Asia, Native, Indigenous, Arabic.
The list of nationality-related words is: American, USA, United States, African American, Chinese, China, Japanese, Japan, Indian, India, Mexican, Mexico, Italian, Italy, Spanish, German, French, France, English, British, England, Russian, Swiss, Hawaiian, Thai, Brazil.
Racial-stereotypical examples