EvoRobogami: Co-designing with Humans in Evolutionary Robotics Experiments
Abstract.
We study the effects of injecting human-generated designs into the initial population of an evolutionary robotics experiment, where subsequent population of robots are optimised via a Genetic Algorithm and MAP-Elites. First, human participants interact via a graphical front-end to explore a directly-parameterised legged robot design space and attempt to produce robots via a combination of intuition and trial-and-error that perform well in a range of environments. Environments are generated whose corresponding high-performance robot designs range from intuitive to complex and hard to grasp. Once the human designs have been collected, their impact on the evolutionary process is assessed by replacing a varying number of designs in the initial population with human designs and subsequently running the evolutionary algorithm. Our results suggest that a balance of random and hand-designed initial solutions provides the best performance for the problems considered, and that human designs are most valuable when the problem is intuitive. The influence of human design in an evolutionary algorithm is a highly understudied area, and the insights in this paper may be valuable to the area of AI-based design more generally.
1. Introduction
Evolutionary Robotics (ER) (e.g., (Bongard, 2013)) is a powerful tool for robot design, being able to explore interwoven design spaces of coupled body, brain, and environmental interactions. Its fitness-based performance assessment is particularly useful in this role, as unintuitive, surprising designs (Lehman et al., 2020) can be assessed in a bias-free manner and large, complex design spaces can be automatically explored in the pursuit of desired behaviours. ER is overwhelmingly implemented as a fully automated process: a robot-producing black box that relies on computational power, parallelisation, and extensive trial-and-error to tackle high-dimensional design problems over a wide design space. Conversely, human-centered design relies on creativity, intuition, and domain knowledge that digital systems often struggle to replicate, but typically a narrower design space.
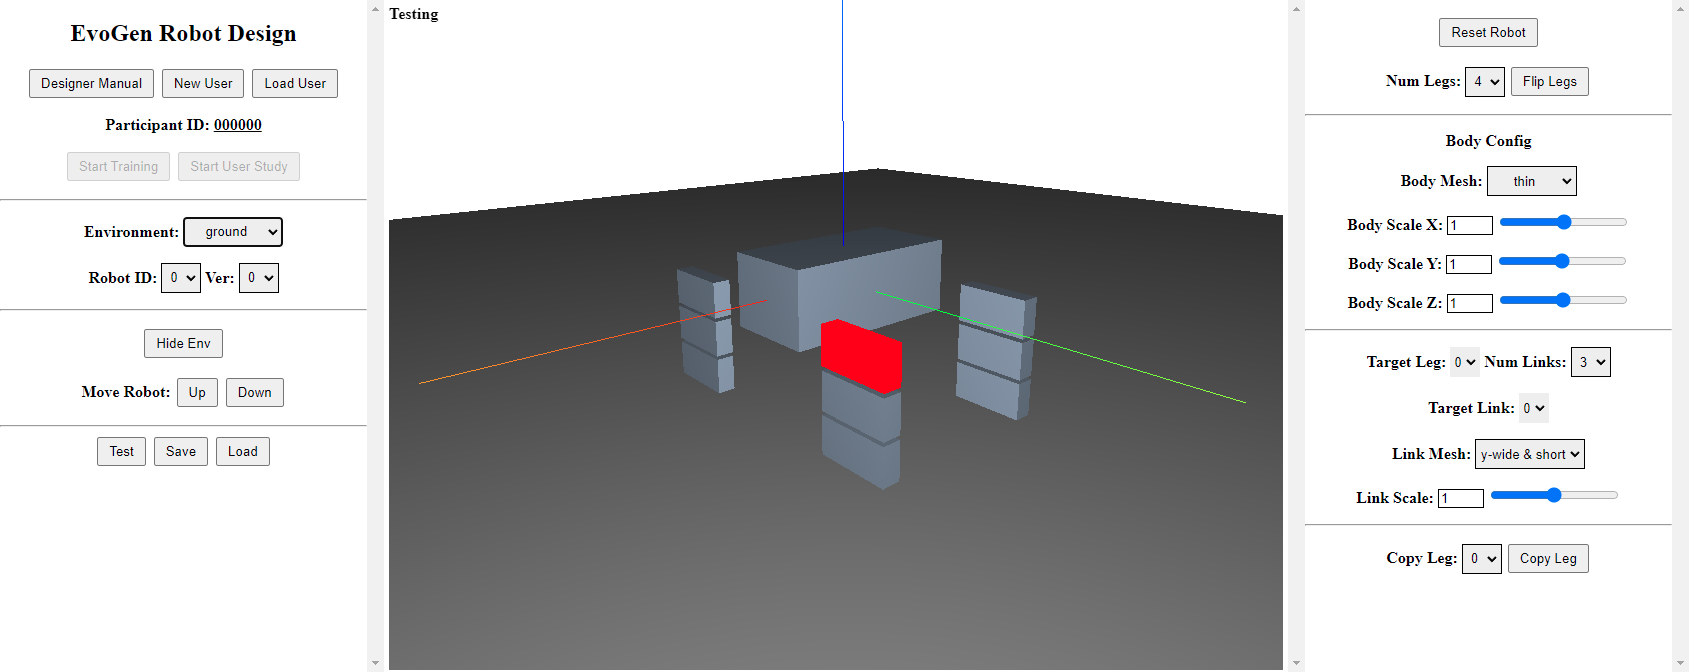
Here, we investigate the impact of injecting human designs (and thus human creativity, intuition, and expertise) into the initial population of an ER experiment that produces legged robots (Figure 1). In this way, the human designer can influence the search for solutions that satisfy design requirements, whilst also exploiting the design space coverage afforded by evolutionary search. We implement a quality-diversity (Pugh et al., 2016) evolutionary algorithm based on MAP-Elites (Mouret and Clune, 2015), providing an effective performance-design space map. We couple this to the Robogami (Schulz et al., 2017a) design tool, which enables interactive human-led design exploration and provides a straightforward way to integrate human designs into the evolutionary process.
We hypothesise that the inclusion of human designs in an ER experiment affects the running progress and the final result of the algorithm, either in terms of the performance of the evolved robots, the coverage of the map, or both.
MAP-Elites is typically initialized with a purely random sample of the design space, which makes the initial population highly diverse across the feature space. This increases the likelihood that the high-performing region would be explored and illuminated. We observe, however, that for many design tasks, a human designer will already have some intuition for what a successful design looks like. They may also approach a design problem from creative directions. Both of these features can be used to enhance a design process by seeding the initial population with more focus on the high-performing regions, especially when the regions are at corners. The better the human designer’s intuition is, the closer the initial population will be to the optimal region, and the less evaluations it will take to illuminate the region and surrounding areas. At the same time, if the design task is complex or difficult for human designers, their intuition may actually be detrimental to the search since the designs may not only fail to bring the initial population closer to the optimal region, but sacrifice diversity as well. We seek to quantify these effects.
We focus the study mainly on two research questions: RQ1 What effects would human input have on the intermediate population when algorithm is running? RQ2 What effects would the human input have on the final population?
First, we collect human designs across a range of terrains using a visual design interface (Figure 7). Humans are tasked to design robot morphologies that generate high-performance locomotion behaviour across a range of increasingly difficult (for the robot) and decreasingly intuitive (for the designer) terrains (Figure 5). In stage 2, we conduct a range of experiments that use varying ratios of human and randomly-initialised designs. We assess the effect of changing ratios of human and random designs in the initial population. Overall, results indicate that human inputs could have either positive or negative impact on the final evolved robot fitness, depending on the quality of the designs, and a negative impact on early stage map coverage. Optimal ratios of human and random designs are shown to depend on environmental complexity.
The main contributions of this work are (i) the first work that uses human designs to evolve robot morphologies, (ii) extensions to the Robogami software that allow for coupling to MAP-Elites and a multi-participant user study, and (iii) a detailed analysis of the effects of adding human inputs to the initial population.
2. background
2.1. Computational Co-design
Human-influenced computational design aims to combine compute-based rapid assessment with human intuition and expert knowledge to collaboratively explore and optimise within a given design space. Typical goals include reducing designer effort and reaching parts of the design space that are otherwise difficult to access. Applications are diverse, including optimising CAD models (Schulz et al., 2017b), designing model aeroplanes (Umetani et al., 2014), and assisting in the sketching of levels for computer games (Liapis et al., 2013). Visualisation plays an important role, particularly when dealing with indirect solution representations which may be unintuitive to explore without visual and performance feedback (Hoisl, 2012). Works closely related to ER include interactive design of 3D printable mechanical characters (Coros et al., 2013) that reproduce desired animatronic motions through the computationally-assisted placement of actuation mechanisms, and robotic creatures (Megaro et al., 2015) including legged robots (Desai et al., 2018), where computational design is used to generate a plausible gait for a given hand-designed morphology. In all cases, the human predominantly leads and controls the design process, with the computational element used in a supporting role, e.g., to generate suggestions, verify the design, or support the designer by creating working actuation for their designs.
2.2. Interactive Evolutionary Algorithms
Human input can be integrated into an Evolutionary Algorithm (EA) in several ways. For example, expert knowledge can be used to set parameter limits and to design fitness functions (Howard et al., 2020). Typically, the only feedback the user receives on their choices is at the end of the experiment, when solutions can be analysed to see if these settings produced the intended results. Interactive Evolution (Banzhaf, 2000) is concerned with more in-depth interplay between user input and evolutionary processes. Early examples include Sims’ ‘Galapagos’ exhibit where a human’s interest (measured by the time spent looking at a specific screen displaying an evolved art piece) was used to drive the evolutionary process, and indirectly-represented digital art (McCormack et al., 1993), as well as the interactive evolution of dynamical systems (Sims, 1992). Interactive EAs have applications as diverse as molecular design (Lameijer et al., 2006) to evolution of digital images (Secretan et al., 2008) and brochures (Quiroz et al., 2009) to game level design (Cardamone et al., 2011; Schrum et al., 2020). Work on exploring the design space around a provided CAD model (Clune et al., 2013), e.g., injecting user designs and then evolving them, demonstrates the benefits of mixing user inputs and evolution. We also note the success of interactive evolution in the domain of parametric design (Harding and Brandt-Olsen, 2018), which is our target domain.
2.2.1. Interactive Quality-Diversity
Quality-Diversity (QD) algorithms (Pugh et al., 2016) are a family of evolutionary algorithms that aim to produce a wide range of high-quality designs, with two popular variants being NSLC (Lehman and Stanley, 2011) (using Pareto optimisation to maintain diversity) and MAP-Elites (Mouret and Clune, 2015) (which uses a discretised feature map). QD is particularly suited to design tasks, as a wide variety of performant designs are encouraged to effectively map out an entire design space (Gaier et al., 2018), generating valuable feedback to the designer and identifying regions where interesting solutions might lie. MAP-Elites has also been investigated in the context of interactive evolution, where game level designs can be selected from the map and edited by the user during an evolutionary run (Alvarez et al., 2021), with preliminary work showing the ability for human designs to unlock previously undiscovered areas of the design space.
2.2.2. Interactive Evolutionary Robotics
Evolutionary Robotics (ER) (see numerous overviews e.g., (Bongard, 2013; Doncieux et al., 2015; Nolfi and Floreano, 2000)) studies the automatic generation of robot morphology and control within a given environment, primarily to generate suitable behaviours, or as a tool to study theories of embodiment, e.g., (Howard et al., 2019). Originally simulated (Sims, 1994), ER is now frequently associated with fabrication and physical instantiation of both rigid (Lipson and Pollack, 2000) and soft robots (Howard et al., 2021) via 3D printing. Robogen is a pertinent UI/simulation enabled evolutionary robotics platform (Auerbach et al., 2014). In our work, we use the Robogami software, which was designed for user interaction and which offers a direct route to eventual fabrication-based studies through 3D printing or folding of the resulting robots through autogenerated fabrication plans. Interactive evolutionary robotics is sparsely covered in the literature. ER automation of certain design tasks can reduce barriers to robot design (Bongard et al., 2012), for example, by handling controller optimisation of non-adaptive morphology, by using controller input to add new rules on-the-fly for an evolved classifier-based robot controller (Katagami and Yamada, 2002), and interactive approaches based on cellular representations (ed eric Gruau and Quatramaran, 1996). To the best of our knowledge, interactive evolutionary morphology generation does not appear in the literature.
2.3. Literature Summary and Motivation
Our work sits at the intersection of Evolutionary Robotics and Computational Co-Design: users interactively design solutions, which are then harnessed to improve an evolutionary process. Rather than tweaking computed designs, users iteratively tweak their own designs based on fitness and visual behavioural feedback from the simulator. This paper details the first such experiment in an evolutionary robotics context. Our approach combines the benefits of evolved and human designs in a way that does not require the user to constantly interact with the design software to ’tweak’ designs, nor stop the evolutionary process to wait for user input. Compared to conventional computational co-design, the emphasis for discovery is shifted more onto the computational (evolutionary) element, which is responsible for ultimately evolving high-performance solutions yet is guided by its given input designs.
3. System Overview
| Name | Value |
| initial population size | 30 |
| number of iterations | 2000 |
| evaluations per iteration (batch size) | 30 |
| archive map size | 20 20 |
| crossover rate | 0.75 |
| mutation rate | 0.1 |
Our study builds a closed-loop system that let users first build robots via a interactive design tool backed by the Robogami software (Schulz et al., 2017a), then use a MAP-Elites (Mouret and Clune, 2015) based searcher to evolve their designs and generate better solutions.
3.1. Robogami Designer
Robogami is a interactive robotic design tool based on a design-by-composition framework that let users design robots by composing independently manufacturable robot parts together. The software also includes algorithm that provides interactive feedback to users, guiding their exploration by checking validity and manufacturability of the design at each step. This provides a novice user a smooth approach to get started and generate a design that reflects their wish. To integrate this front-end to our system loop, we (1) simplify the user interface and add design constraints to the software to limit the design space as described in Section 3.2; (2) link the software to a simulator described in Section 3.3 that evaluates the design’s fitness and provides user with visual feedback; (3) develop a compiler that compiles the user design to the design vector that can be loaded by the MAP-Elites searcher described in Section 3.4; (4) wrap the software with a user study guiding system that helps the users go through the user study described in Section 4 with minimum interruption by the researchers.
The resulted UI is shown in Figure 7.
3.2. Robot Morphology and Gaits
ER uses a range of robot representations, which can be classified as direct or indirect. The choice of genome vector dictates the types and variety of robot designs that can be achieved. More descriptive genomes permit a larger design space, potentially improving the quality of the output design. However, larger genomes increase training time as a larger design space must be explored. Our choice must balance genome complexity and design space expressiveness with the ability for changes in genome parameters to be easily understood by corresponding changes in the robot to aid in human design exploration. As such, we use a direct representation that captures these features.
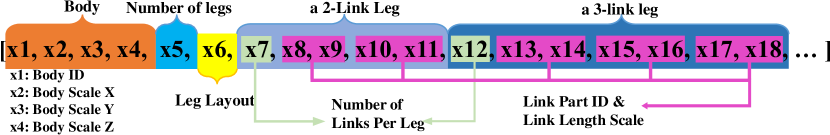
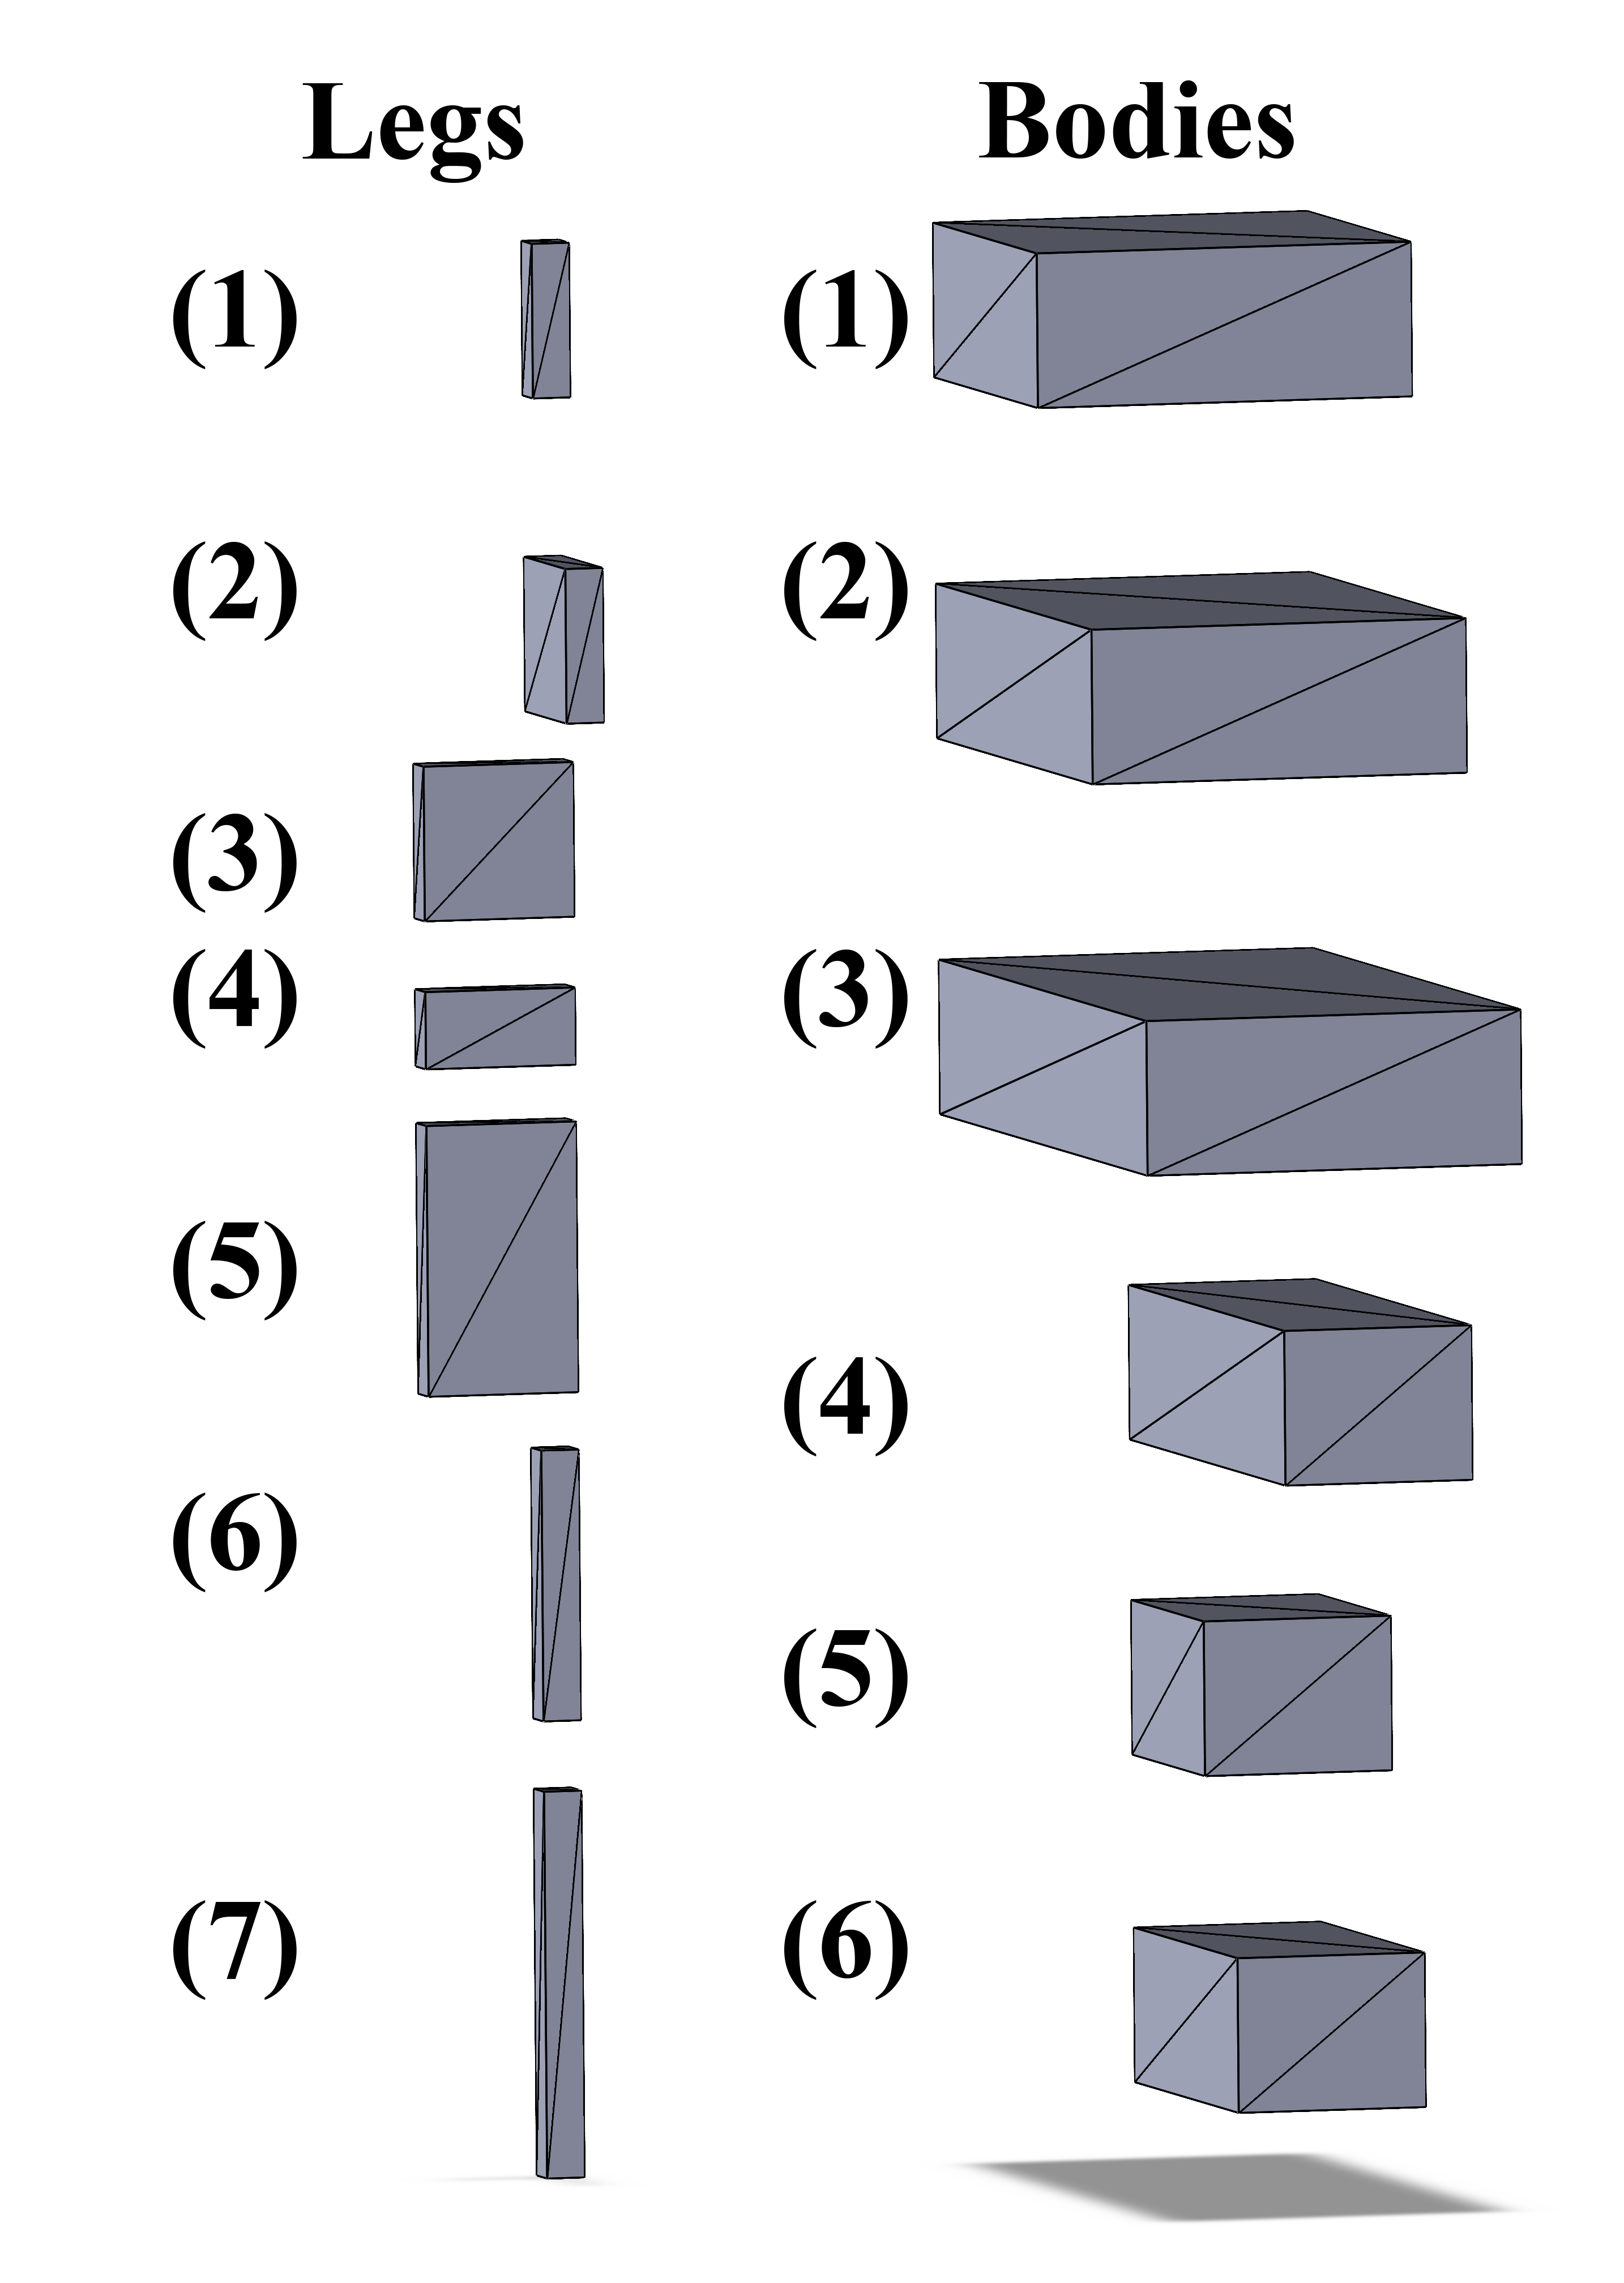
In this study, we consider legged robots with 2-6 legs, each of which has 2 or 3 links. The genome, allele ranges, and mapping to a phenotype (robot) are presented in Figure 3(a). The genome vector contains 17 to 53 variables depending on the complexity of the robot. Body Shape ID and Link Shape ID correspond to rectangular prisms of different aspect ratios, and the Body Scale and Link Scale are multipliers directly applied to the corresponding dimensions of the parts, providing a flexible and scalable design space suitable for both human and evolutionary exploration.
Legs are evenly distributed on each side of the robot’s body and attached to the middle point of the direction (See Figure 5 for direction definitions). A layout-mirroring flag controls which side of the robot has more legs when an odd number of total legs is inputted. This flag is ignored for robots with even number of legs. Leg links are connected to each other in series with joints located at either end of the link. All joints are revolute joints with axes of rotation parallel to the axis. The robot parts are assumed all to be of uniform density (2.5 g/cm3), with dimension details shown in Figure 3.
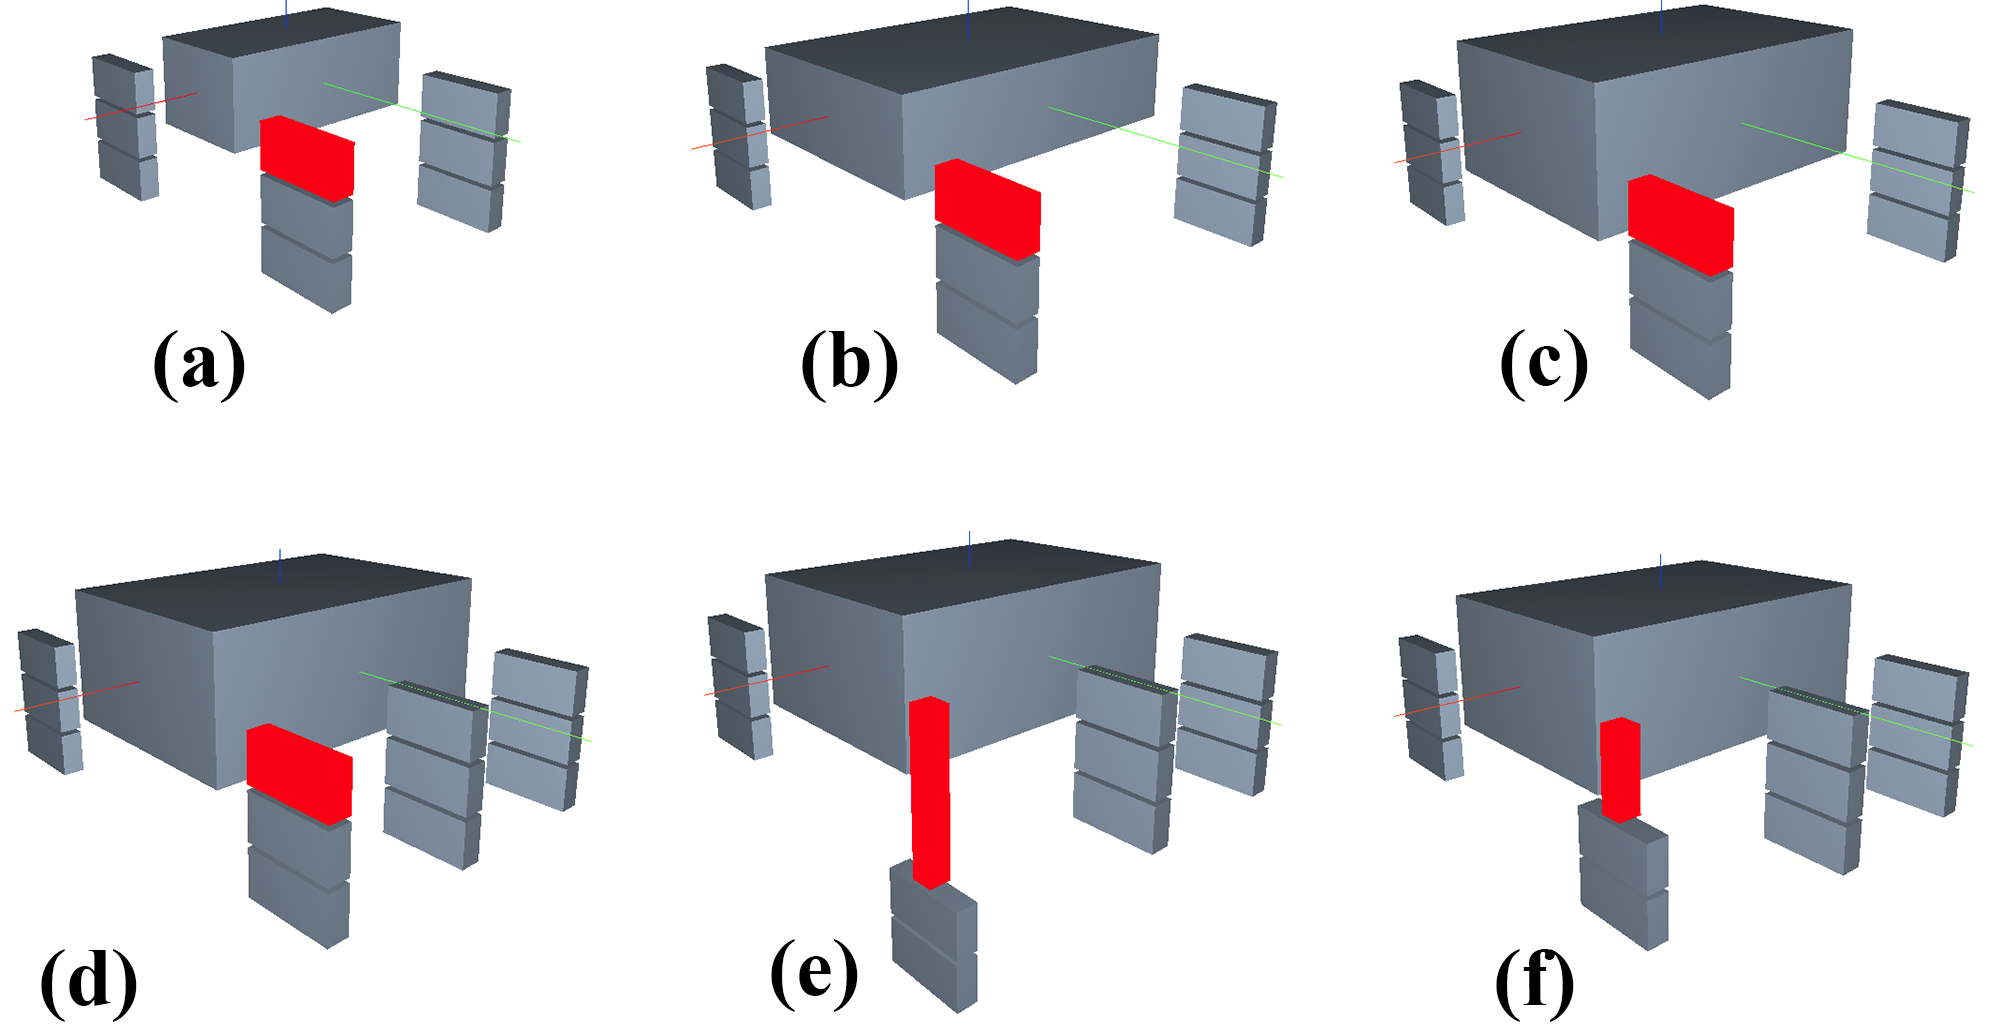
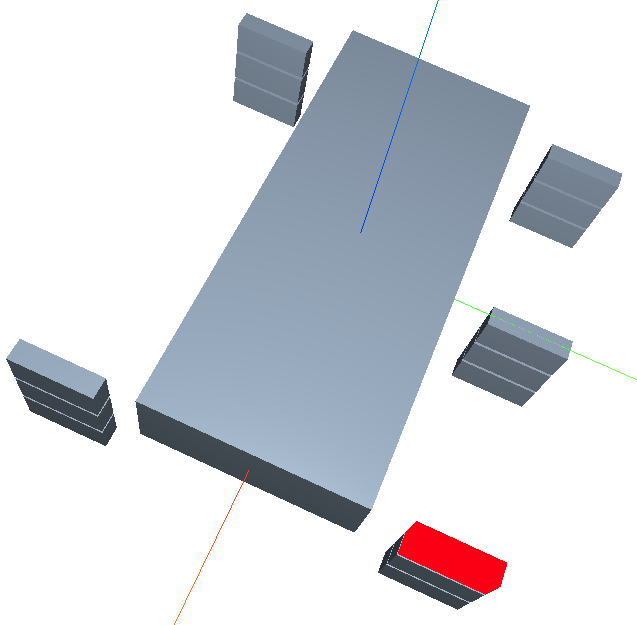
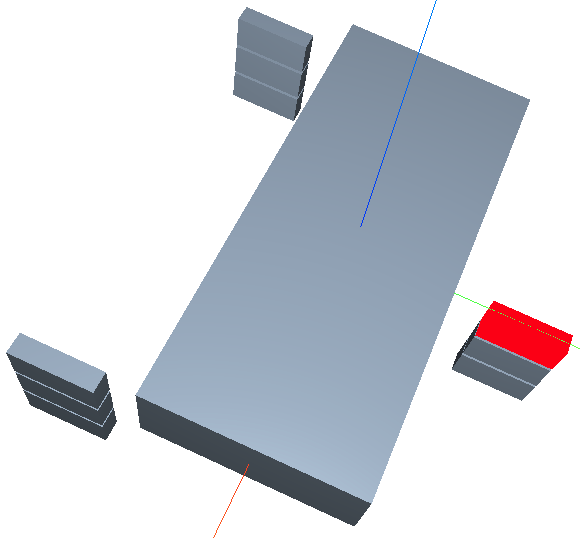
Even with this simple robot representation, a variety of robot geometries and kinematic structures can be achieved, including asymmetric robots with differing numbers of legs or leg links on each side. (Figure 2).
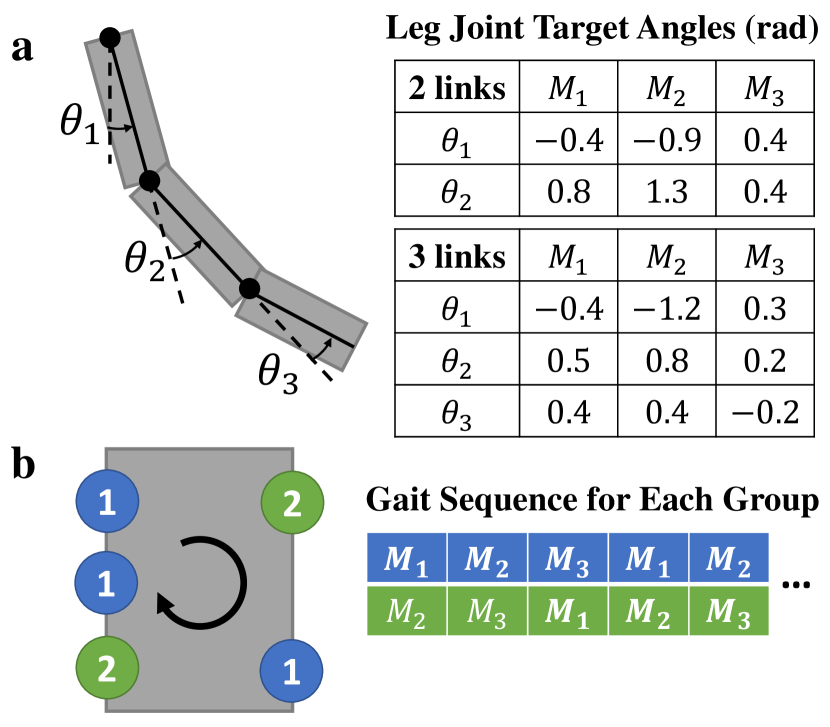
The gait of the robot is directly determined by the morphology, with a set of predefined joint movements based on the design and layout of legs. Each of the legs follows a motion sequence depending on the number of links in the leg (Figure 4) with an offset depending on its placement on the robot body. In particular, the legs are divided into two groups. Starting from the front left leg, alternating group numbers are assigned in clockwise order. Group 1 executes the motion sequence simultaneously as Group 2 executes , and the process repeats over multiple gait cycles. The group switches to the next joint target when all of the joint angles are within 0.01 rad of the target angle, or 3 s after the other group finishes its current motion, whichever happens earlier. The joint angles and motion sequences associated with the joints in the legs are kept constant over all robot designs; that is, they are not included in the evolutionary design. The gait is controlled by a PI controller over both velocity () and position (), with a maximum joint velocity of 2 rad/s. A deterministic controller was used to remove a potential level of indirection, in the form of body-brain optimisation, from the user design problem, allowing a predictable control output per morphology to simplify the design process.
| Name | Range |
| Body Shape ID | Integer 1 - 6 |
| Body Scale , , | Double [0.5, 1.5] |
| Number of Legs | Integer 2 - 6 |
| Leg Layout | Bool true, false |
| Number of Links | Integer 2, 3 |
| Link Shape ID | Integer 1 - 7 |
| Link Length Scale | Double [0.5, 1.5] |
| ID | X | Y | Z |
| 1 | 10 | 10 | 4 |
| 2 | 15 | 10 | 4 |
| 3 | 20 | 10 | 4 |
| 4 | 10 | 5 | 4 |
| 5 | 15 | 5 | 4 |
| 6 | 7 | 5 | 4 |
| ID | X | Y | Z |
| 1 | 1 | 1 | 4 |
| 2 | 4 | 1 | 4 |
| 3 | 1 | 4 | 4 |
| 4 | 1 | 4 | 2 |
| 5 | 1 | 4 | 7 |
| 6 | 1 | 1 | 7 |
| 7 | 1 | 1 | 10 |
3.3. Task and Fitness
To make sure the participants of the user study could get good intuition on some problems, we define the task for the robot to be simply walking forward in different environments, and define the fitness to be heavily determined by the distance traveled during the given time.
At the start of each simulation, the robot is placed at a fixed point at one end of the environment, with position determined by having the foot of its longest leg lifted above the terrain surface directly under it by 2 cm. The robot is then simulated forward for 30 s of simulated time with simulation step size of 0.005 s. We use Project Chrono (Tasora et al., 2015) as our simulator.
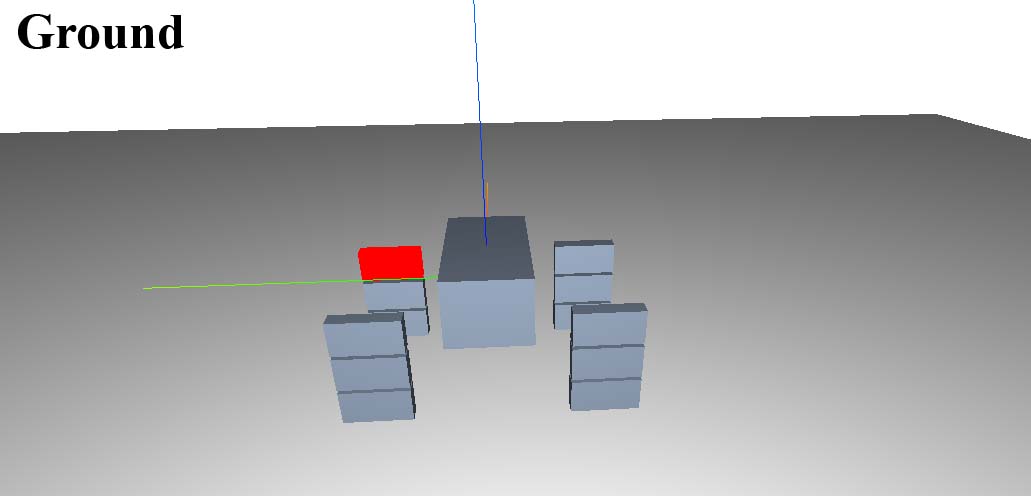
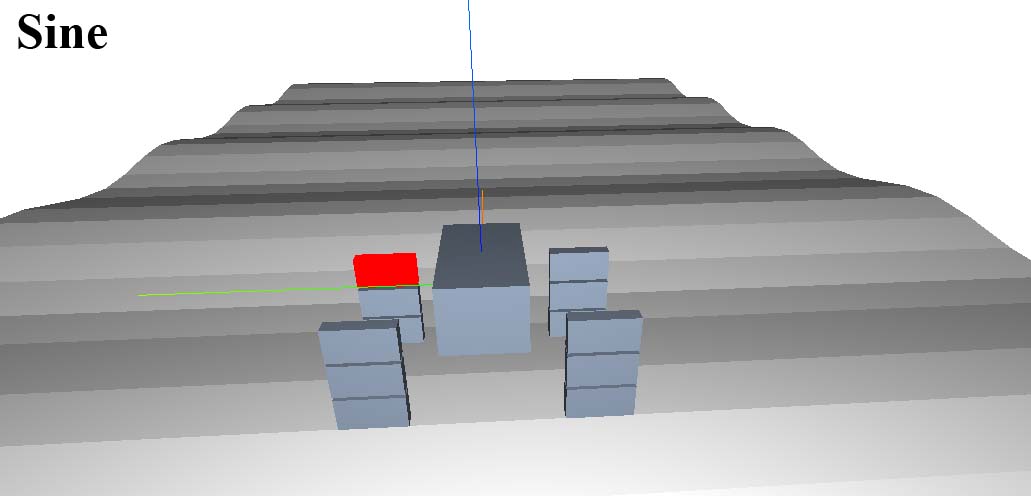
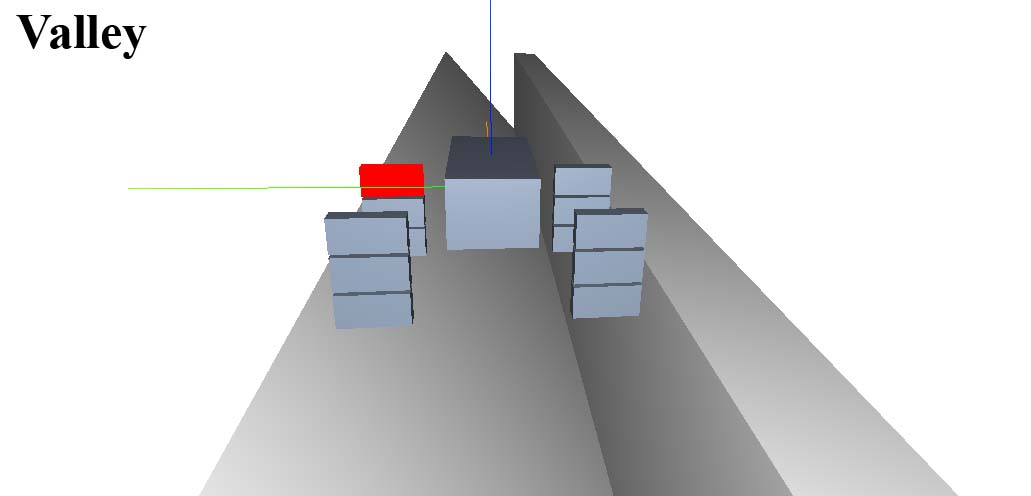
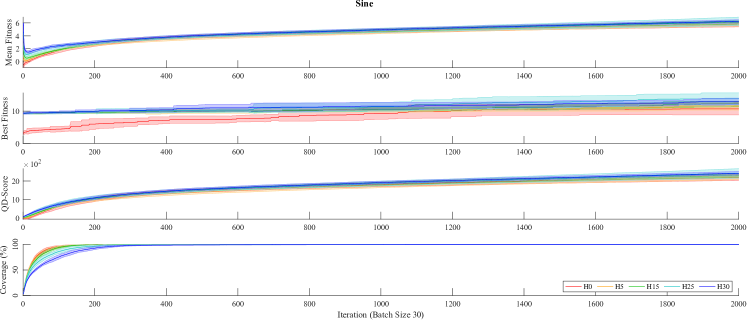
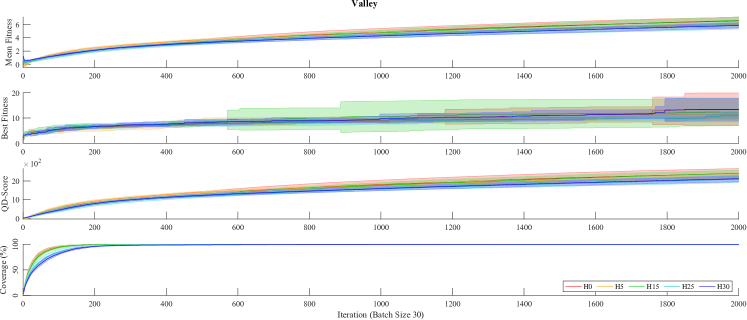
Since we expect the impact of human-created designs to differ depending on the complexity of the design task and the quality of human intuition, we designed three environments Ground (G), Sine (S), Valley (V) (Figure 5) with increasing degrees of difficulty of walking forward. Ground is expected to be the easiest task for a human as the environment has little impact on robot behaviour. Sine introduces additional difficulty by requiring designers to think how navigate robots through the bumps. Valley is the most difficult due to the introduced asymmetry, which is counter to most human designers’ intuition. The fitness objective is to maximize the distance of the robot moving forward while minimizing divergence from a straight line:
| (1) |
where is the net displacement in the forward direction and is the net displacement perpendicular to the forward direction at the time when the simulation stops. If the system detects the robot has fallen off the edge of the environment, the simulation terminates with fitness taken from the robot’s last position.
3.4. MAP-Elites Searcher
We build the evolutionary searcher upon MAP-Elites, and link it to the simulator described in Section 3.3 for fitness and feature evaluation. MAP-Elites holds its population in the archive map, which is a discretized low-dimensional projective space of the search space. We use a 2D map of cells, with the 2 dimensions (features) being: (1) the length of the body along the direction (Figure 5 for direction definition), and (2) the standard deviation of the leg lengths. The length of the robot’s body directly affects its separation of legs on the forward direction, which then decides robot’s maximum feasible leg length and stability given our controller (Figure 4). The standard deviation of the leg lengths quantifies asymmetry of the robot design. These two features were chosen through a small number of test runs using random initial populations. Compared to other tested features, e.g., average length of legs, maximum length of legs, total volume of robots, length of genome, etc., these two were found to be two of the most significant factors related to the environments and fitness (Eq. 1) we use.
We set the size of initial population to be 30 and run the algorithm for 2000 iterations. For each iteration, 30 parent designs are randomly selected from the archive map to generate a batch of 30 children designs with mutation rate of 0.1 and crossover rate of 0.75. The children designs are evaluated according to a fitness metric and projected back onto and stored in the archive map. If the projected cell is occupied, or if two children designs are projected to the same cell, the individual with the highest fitness is retained.
4. Human Data Collection
A user study111This user study has been approved by the IRB of University of Pennsylvania under the title Robotic design decision making (protocol #849907). was conducted to collect human designs with the UI described in Section 3.1. Data was collected from 13 students (5 undergraduate, 8 graduate) who all had some prior experience in robot design. Each participant started with a 10-min. tutorial explanation of the user interface on a sample design, then a 10-min. exploration session to familiarize themselves with the system and ask questions, in which they could design and test robots for an unlimited number of times on a different training environment. After the training, each participant was given the task and the definition of fitness, and asked to design a robot for each of the three environments. At the start of each new environment, all options on the right panel of the UI are set to the middle point of their range, showing the default “neutral robot.” The participant would adjust the parameters and design a robot that reflects their intuition and knowledge, and send the robot to simulation for walking visualisation and fitness. Although the purpose of the data collection was to gather designers’ intuition about the optimal design, we also wanted to remove the potential negative effects from the users’ unfamiliarity with the simulation and design software. Each participant was allowed to update the design 10 times per environment, and each update was considered to include all of design changes made between two consecutive simulation requests. Design genomes were saved at each iteration, resulting in 11 total designs per environment per user. Giving participants multiple chances to test their design was to make sure they could fully express their intuition and make the robot faithfully behave as they wish, without setting back by the bias and barriers caused by the unfamiliarity to the system. And the participants were not given unlimited trials either, so that they didn’t unintentionally evolve their designs by trial-and-error.
The order of the environments was randomized for each user to mitigate the bias from one environment to the next, introduced by the increasing familiarity to the system.
We expect the fitness of the design to improve over the iterations up until the user is satisfied with their design quality, at which point they commit to their design by simulating the same design for the remaining iterations or they test minor tweaks.
A total of 143 designs (11 robots from 13 users) were collected for each environment. In a post-processing step, we removed duplicates from when the user requested a simulation multiple times for the same design, resulting in 125 total designs for the Ground, 128 for the Sine, and 130 for the Valley.
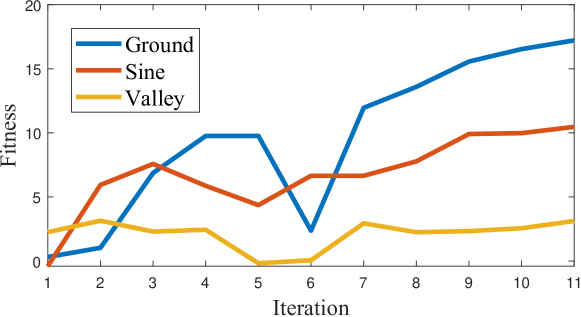
Figure 6(a)(b) shows the fitness progression of the design iterations on different environments for one participant. As expected, for the Ground and Sine, designs improved over the course of design iterations for the first few iterations before fitness increases slow down near the final value. The robot designs also undergo larger changes during earlier iterations than later ones. The general fitness increases support the suitability of our approach as a design tool. In the Valley, however, the fitness achieved the by the participant remained low and throughout the iterations and the designs exhibited larger changes between iterations, indicating that users performed more exploration for this task and that it was overall more difficult for them to use their intuition on.
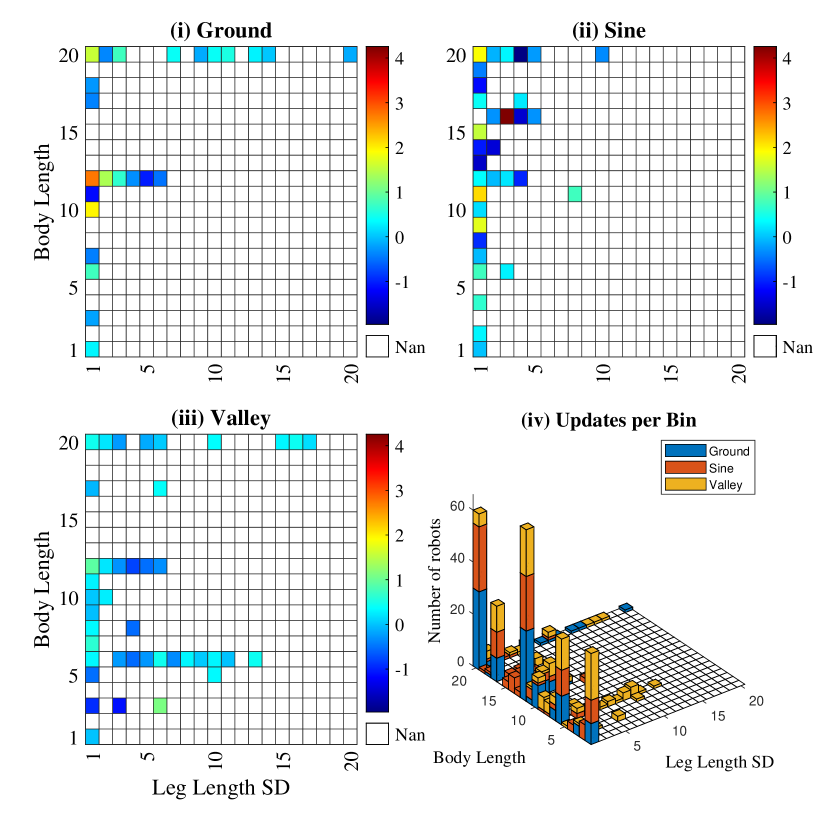
Figure 6(b)(c) (i) - (iii) show the archive maps with all designs from all users for the corresponding environment are inputted. A large number of designs are concentrated on the left side of the map corresponding to symmetric designs for all environments. Comparing to the sample archive maps of the final population of H25 shown in Figure 10, we see the users successfully placed their designs in the high-performing region for Ground and Sine, but not for the Valley, indicating the less productive intuition for the latter. And we see more cells in Figure 6(b)(c)(iii) are filled, as the users were forced to explore more areas in the design space. Figure 6(b)(c)(iv) shows the number of robots that goes into each cell in the feature map, with all robots included. The preference of cells is another indicator that humans’ exploration of the design space is relatively condensed.
5. Results
To explore RQ1 and RQ2, we set up 5 test conditions with varying numbers of human and random designs.
-
(H0)
No human designs and 30 random robots.
-
(H5)
5 human designs and 25 random robots. Human inputs were the top 5 designs, with at most 1 design per user.
-
(H15)
15 human designs and 15 random robots. Human inputs were the top 15 designs, with at most 2 designs per user.
-
(H25)
25 human designs and 5 random robots. Human inputs were the top 25 designs, with at most 3 designs per user.
-
(H30)
30 human designs and 0 random robots. Human inputs were the top 30 designs, with at most 3 designs per user.
Each test condition H is repeated 10 times with random designs uniformly re-sampled for each repeat. The experiments are conducted on a desktop computer with a quad core 10th Gen Intel i7 @ 3.4GHz CPU, taking approximately 6 hours per run.
The curves in Figure 8 show the transitional
changes of key metrics during the running of algorithm. Box plots in
Figure 9(a) show key MAP-Elites metrics of the final
population. (Mouret and Clune, 2015) Figure 10
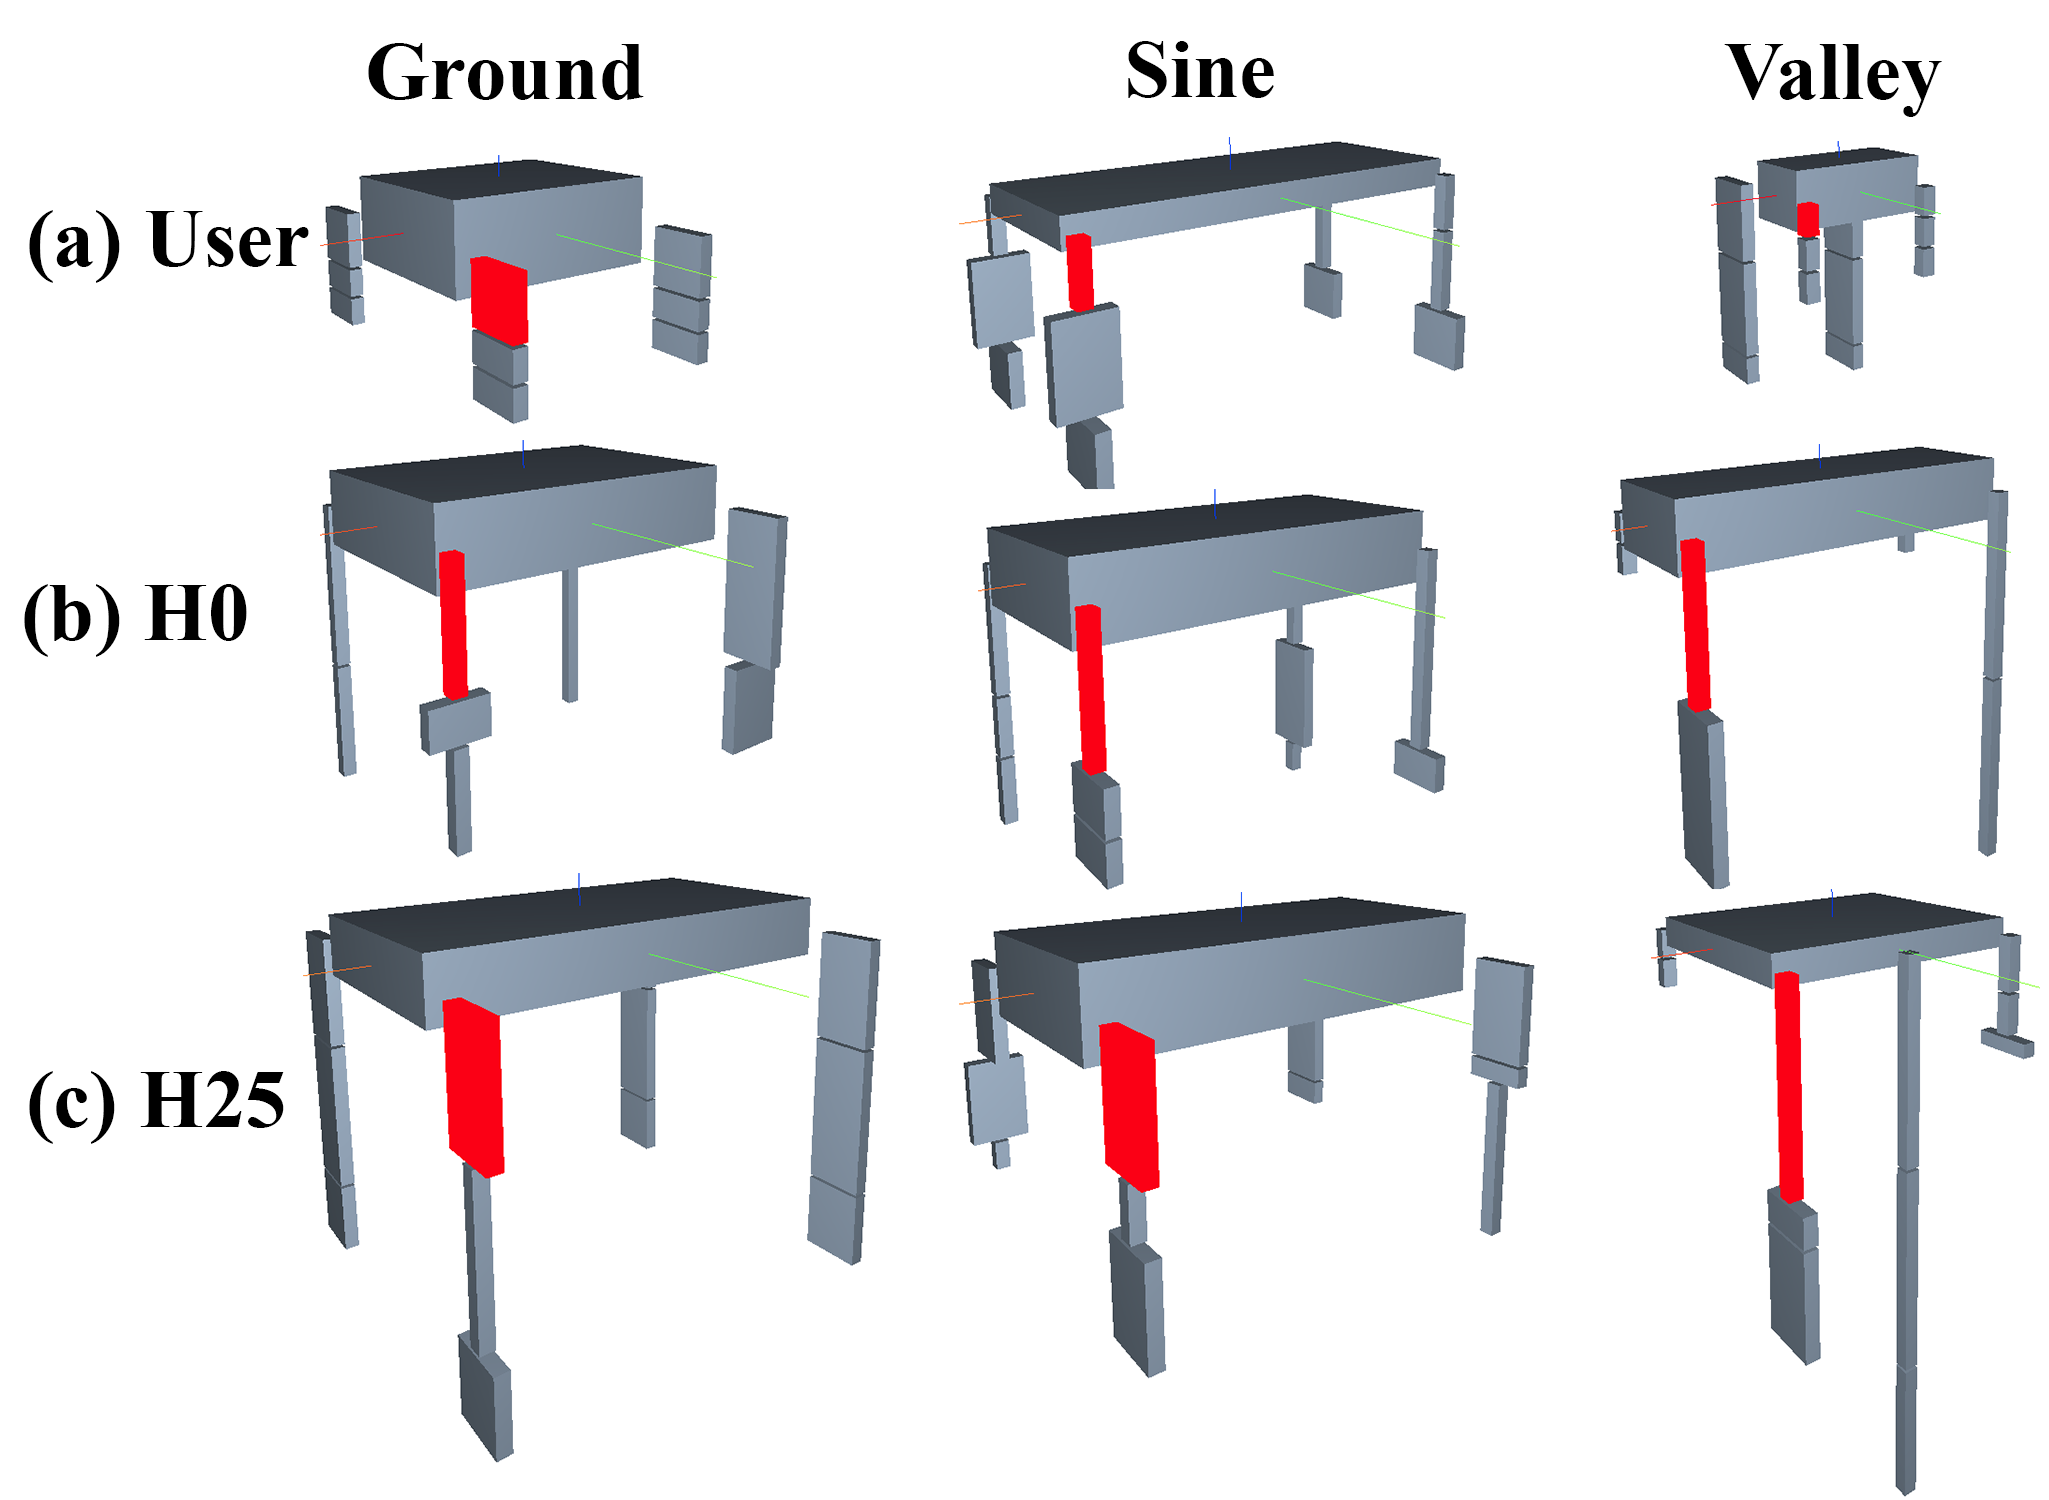
shows sample archive maps from H0 and H25 for three environments, and
Figure 1 shows initial and
high-performing robots sampled from those archive maps.
Figure 13(c) shows the Mann-Whitney U-test result for
mean and best fitness of the final population of different test
conditions.222Supplementary data and resources are available at:
https://sung.seas.upenn.edu/publications/evorobogami-gecco-2022..

| Env | Mean Fitness | Human / | ||||
| Human | H25 I | H25 F | H0 I | H0 F | Final H0 | |
| G | 7.4 | 5.76 | 8.09 | -0.64 | 6.5 | |
| S | 5.99 | 4.61 | 6.25 | -0.56 | 5.79 | |
| V | 1.24 | 1.02 | 5.83 | -0.06 | 6.52 | |
| G(B) | 11.96 | 11.96 | 17.29 | 3.08 | 12.19 | |
| S(B) | 9.2 | 9.2 | 13.89 | 3.05 | 10.68 | |
| V(B) | 3.14 | 9.2 | 10.84 | 2.16 | 13.45 | |
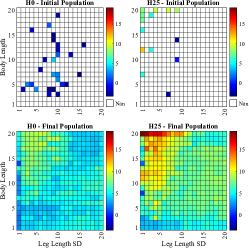
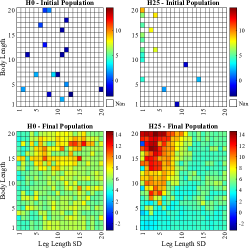
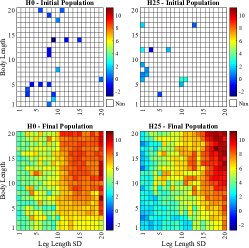
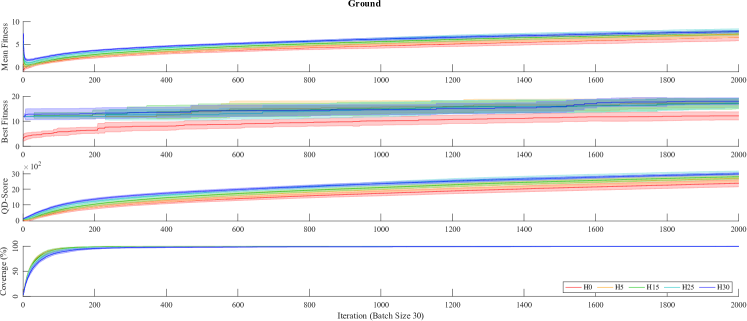
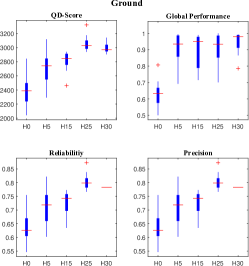
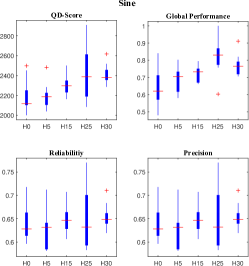
Figure 8 contains the curves of mean and best fitness, QD-score (Pugh et al., 2016) and coverage at the end of each iteration, showing the progress of the algorithm running. Figure 9(a) shows MAP-Elites related metrics of the final archive map, including QD-score, global performance, reliability, and precision (Mouret and Clune, 2015).
5.1. (RQ1) Affects of human influence during algorithm running
For mean fitness, the random H0 test condition follows a generally increasing trend. However, test conditions with human input shows sharp dips in fitness in the first few iterations: the human designs are relatively high fitness and early additions to the map decrease the mean. For Ground and Sine, higher amounts of human input maintain higher average and elite (top 10% of the archive by fitness) fitness. For the Valley, the difficulty of the design task reduces effectiveness of the human input and the fitness curves largely overlap.
We additionally verified whether human input impacted on the rate of fitness gain over a run. To do this, we (following the initial dip) recorded the average iteration that the elite designs of that run achieved a given percentage of the final mean fitness value. We compared H25 (typically the overall best fitness-wise) to H0 on the Ground. Figure 11(c) shows that the H25 case achieved milestones almost twice as fast as the H0 case, indicating that in addition to providing some benefits to the final design achieved, adding human input also has the potential to reduce computation by allowing the algorithm to terminate earlier while still achieving the same quality of results. This can be attributed to the subsequent repeated use of human-designed genetic material as a basis for genetic exploration. For the Ground, H25 was able to match the final elite mean fitness of H0 by iteration 1480 on average. The same test on the Valley shows that H25 fitness values improved more slowly than H0; in other words, success of the approach relies on a human’s ability to grasp the requirements of the problem.
For the best fitness, the test conditions with human inputs all start at the same high level on Ground and Sine, as the best human design is guaranteed to be included in the initial population by the way we select human inputs. And the curve for H0 starts at a significantly lower point than the rest, and also converges to a lower value. While for the Valley, the curve of H0 is indistinguishable to the others. The differences between H0 and other conditions at the start of the curve in different environments also indicates that the Ground and Sine are easy environments to the users.
QD-score is a performance measurement for quality diversity algorithm considering both quality and diversity of the population. For the Ground, all test conditions have the QD-score curve started roughly at the same point, and the test conditions with human designs move above H0 and stay up for the whole time. H25 shows on top of everyone in the late stage. The results of the Sine show a similar trend, but with narrower gap between H25 and H0. While for the Valley, H0 gets the best QD-score shortly after a few iterations, and holds the position for the rest of the run. This implies human designs with bad quality bring negative effect to QD-score.
Coverage curves show a rapid increase in map coverage at the beginning of the run, followed by a slower convergence to 100% coverage. Lower amounts of human input achieve higher coverage faster, however 100% coverage is attained within 400 iterations in all cases, indicating that in our experiment setup, human input affects only the rising speed of coverage. Figure 12(c) shows the average number of iterations each test condition takes to reach different percentage of coverage, where numeric comparisons can be made. Figure 14(c) shows the difference in number of generations for each test condition to reach and , with statistical significance verified by the Mann-Whitney U-Test at . This statistically confirms the negative impact of human input on coverage on all three environments in almost all cases.
Finally, to understand the effect of human input on the rate of coverage, we recorded the iteration at which each run was able to achieve a given coverage of the archive map, where . The H0 condition reaches the target coverage in fewer iterations than H25 and H30 conditions for all environments and all , and H30 performs worse in terms of coverage than almost all other conditions across all environments. Despite providing some insight into the dynamics of the evolutionary process under various conditions, we note that overall coverage is not affected, reaching in all cases within 400 iterations. In other words, coverage is not critically affected by the injection of human designs for the problem considered, although this may differ with differing map size.
| Progress | Number of iterations | ||||
| H0 | H5 | H15 | H25 | H30 | |
| 101.1 | 51.3 | 25.0 | 25.0 | 25.0 | |
| 273.7 | 172.2 | 32.5 | 25.0 | 25.0 | |
| 521.9 | 346.5 | 159.5 | 91.0 | 25.0 | |
| 772.3 | 544.0 | 346.8 | 358.8 | 122.6 | |
| 1031.6 | 797.3 | 644.6 | 656.2 | 393.1 | |
| 1322.7 | 1295.4 | 1200.6 | 1114.0 | 1053.9 | |
| 1622.8 | 1507.3 | 1517.7 | 1578.1 | 1390.3 | |
| Progress | Number of iterations | ||||
| H0 | H5 | H15 | H25 | H30 | |
| 25.0 | 25.0 | 25.0 | 25.0 | 25.0 | |
| 74.0 | 77.3 | 25.0 | 25.0 | 25.0 | |
| 274.1 | 278.5 | 82.4 | 108.2 | 25.0 | |
| 483.2 | 489.2 | 279.9 | 345.9 | 99.0 | |
| 765.5 | 749.1 | 540.4 | 693.9 | 347.9 | |
| 922.0 | 1032.3 | 1026.1 | 1135.9 | 1029.2 | |
| 1512.4 | 1461.0 | 1431.4 | 1569.1 | 1292.0 | |
| Progress | Number of iterations | ||||
| H0 | H5 | H15 | H25 | H30 | |
| 64.8 | 25.0 | 92.7 | 98.7 | 110.1 | |
| 155.8 | 127.8 | 188.8 | 191.3 | 200.8 | |
| 305.8 | 330.3 | 335.0 | 361.3 | 379.9 | |
| 508.8 | 569.3 | 611.9 | 647.4 | 671.1 | |
| 821.8 | 838.7 | 957.0 | 968.3 | 959.2 | |
| 1225.2 | 1032.1 | 1200.6 | 1293.4 | 1250.2 | |
| 1626.6 | 1556.1 | 1607.1 | 1568.9 | 1641.6 | |
| Coverage | Number of iterations | ||||
| H0 | H5 | H15 | H25 | H30 | |
| 7.0 | 6.9 | 7.3 | 8.3 | 9.2 | |
| 10.8 | 11.1 | 10.8 | 12.8 | 14.6 | |
| 15.4 | 15.7 | 15.7 | 18.6 | 21.8 | |
| 21.5 | 21.4 | 22.4 | 26.9 | 31.1 | |
| 31.1 | 30.5 | 31.7 | 39.6 | 45.4 | |
| 45.7 | 44.4 | 47.8 | 57.2 | 67.2 | |
| 73.4 | 72.0 | 74.1 | 95.9 | 116.7 | |
| Coverage | Number of iterations | ||||
| H0 | H5 | H15 | H25 | H30 | |
| 6.9 | 7.0 | 6.9 | 8.3 | 11.1 | |
| 10.5 | 10.9 | 11.2 | 13.6 | 20.3 | |
| 15.5 | 15.4 | 16.7 | 21.5 | 34.1 | |
| 21.5 | 21.9 | 24.5 | 33.0 | 53.5 | |
| 29.8 | 31.1 | 37.1 | 50.1 | 82.3 | |
| 42.2 | 45.4 | 53.2 | 77.1 | 117.6 | |
| 64.4 | 70.8 | 81.1 | 121.7 | 174.4 | |
| Coverage | Number of iterations | ||||
| H0 | H5 | H15 | H25 | H30 | |
| 6.7 | 6.9 | 7.7 | 9.9 | 12.0 | |
| 10.4 | 10.8 | 12.1 | 15.9 | 19.4 | |
| 15.1 | 15.6 | 17.7 | 24.6 | 30.6 | |
| 21.4 | 22.8 | 24.7 | 37.6 | 45.2 | |
| 30.0 | 32.4 | 34.3 | 54.8 | 64.4 | |
| 42.3 | 47.5 | 49.7 | 80.4 | 91.1 | |
| 68.6 | 76.4 | 78.7 | 123.8 | 139.9 | |
5.2. (RQ2) Affects of human inputs on final result
Figure 9(a) shows the statistics of the final result of experiments. For Ground and Sine, human inputs help to achieve better QD-score, global performance, reliability and precision than H0. And in most cases, H25 outperforms other test conditions in all metrics. While for the Valley, H0 records the best QD-score, precision and reliability. The Mann-Whitney U-test results for mean archive fitness and best fitness at are shown in Figure 13(c). For the Ground and Sine, the human designs had a positive effect on the mean fitness of the final archive map, and clearly beats H0 for the best fitness. We however note that for the Valley, the H0 initial population produced an archive map with a mean fitness that was statistically significantly higher than almost all other test conditions. The low mean fitness of the user designs (1.24) compared to the final mean fitness of the H0 runs (6.52) indicates that users found the Valley task difficult and biased the search to an unpromising area of the design space.
Results indicate that using only human inputs in the initial population can hinder the search. For the Ground, H30 condition resulted in a statistically significantly lower mean fitness in the archive map compared to H25 while for the Sine, the mean fitness of the two archive maps were approximately the same, indicating no great benefit from the additional human designs. This implies that although human intuition was valuable in directing the search to particular portion of the archive map, there is a benefit to adding random robots to diversify the population and encourage design exploration. Importantly, the evolutionary process does not dilute the benefits of using user designs; stark fitness benefits are observed even after 2000 iterations of evolution with no additional interaction. User designs are also frequently replaced in their niche by evolved designs; evolution uses the provided genetic material to improve solutions throughout the map.
Given best fitness performance, we conclude that user inputs are beneficial to evolution in all cases, but more so when the user has a sound grasp of the problem to be solved. When this is the case, the users bias the search process towards promising areas of the design space, as well as providing useful genetic material for further tinkering by evolution.
| A | H5 | H15 | H25 | H30 |
| H0 | + | + | + | + |
| H5 | + | + | + | |
| H15 | + | + | ||
| H25 | - |
| B | H5 | H15 | H25 | H30 |
| H0 | + | + | + | + |
| H5 | - | + | ||
| H15 | + | + | ||
| H25 | + |
| A | H5 | H15 | H25 | H30 |
| H0 | + | + | + | |
| H5 | + | + | + | |
| H15 | + | + | ||
| H25 |
| B | H5 | H15 | H25 | H30 |
| H0 | + | + | + | + |
| H5 | + | + | + | |
| H15 | + | + | ||
| H25 | - |
| A | H5 | H15 | H25 | H30 |
| H0 | - | + | - | - |
| H5 | + | - | - | |
| H15 | - | - | ||
| H25 |
| B | H5 | H15 | H25 | H30 |
| H0 | - | - | - | - |
| H5 | + | - | + | |
| H15 | - | + | ||
| H25 | + |
| H5 | H15 | H25 | H30 | |
| H0 | +0.3 | +0.3 | +3.2 | +6.4 |
| H5 | +2.9 | +6.1 | ||
| H15 | +2.9 | +6.1 | ||
| H25 | +3.2 |
| H5 | H15 | H25 | H30 | |
| H0 | -1.4 | -0.7 | +22.5 | +43.3 |
| H5 | +2.1 | +23.9 | +44.7 | |
| H15 | +21.8 | +42.6 | ||
| H25 | +20.8 |
| H5 | H15 | H25 | H30 | |
| H0 | -0.1 | +1.2 | +6.0 | +18.6 |
| H5 | +1.3 | +6.1 | +18.7 | |
| H15 | +4.8 | +17.4 | ||
| H25 | +12.6 |
| H5 | H15 | H25 | H30 | |
| H0 | +6.7 | +17.0 | +57.6 | +110.3 |
| H5 | +10.3 | +50.9 | +103.6 | |
| H15 | +40.6 | +93.3 | ||
| H25 | +52.7 |
| H5 | H15 | H25 | H30 | |
| H0 | +0.5 | +2.6 | +9.5 | +15.5 |
| H5 | +2.1 | +9 | +15 | |
| H15 | +6.9 | +12.9 | ||
| H25 | +6 |
| H5 | H15 | H25 | H30 | |
| H0 | +7.8 | +10.1 | +55.2 | +71.3 |
| H5 | +2.3 | +47.4 | +63.5 | |
| H15 | +45.1 | +61.2 | ||
| H25 | +16.1 |
6. Discussion
In summary, this paper shows the effects of adding human designs to the initial population of an evolutionary robotics experiment. Our approach is ‘set and forget’: it does not require constant/repeated user interaction to achieve its stated benefits, and is an accessible way to bring intuition into evolutionary design problems without slowing down evolutionary run time. It can also be viewed as the inverse of related approaches wherein computational designs are suggested to the user for tweaking; here the human does the suggesting and evolution does the tweaking.
Results demonstrate that when humans have a reasonable understanding of the problem to be solved, their inputs have beneficial effects on the subsequent evolutionary process, yielding higher best fitness and higher mean archive fitness. Evolution biases the initial population into high-performing regions of the search space (a form of expert knowledge injection), and subsequently exploits the high-quality genetic material to generate performant designs. We note that evolution plays the key designer role in this process; initial human inputs are not seen in the final populations and are frequently overtaken in their niches by evolved designs based on their genome parameters. We also see that the fitness benefits are not simply wiped out by the ongoing genetic process; instead fitness benefits are lasting and readily observable in the final evolved populations. Additionally, archive coverage is not unduly affected by the use of user designs. Maximum map coverage is readily achieved in all cases within 400 iterations, so would only be detrimental in very short runs that are commonly not used with MAP-Elites. A mixture of human and random designs (H25) achieves good results in all metrics for Ground and Sine, where the human intuition is reasonable, suggesting an optimal balance of the two sources of designs.
We note some limitations with this study. First, it is dependent on human input and a cohort of experienced users, which may not be available. However this limitation is true of any user-based study. Furthermore, many CAD packages and robot simulators can readily support this functionality, and many potential users exist in academia (with access to students) or industry (with access to peer employees). The range of applications can therefore be considered to be relatively large. Finally, results suggest that our approach is highly beneficial, but is particularly powerful when the human designers have a reasonable grasp of the problem. This effect is still to be quantified, but nevertheless this observation may guide the application of this technique into other domains.
Future work will focus on assessing the impact of representation on a user’s ability to design, and the interaction of different representations and evolutionary methods with the process. We note that Robogami is capable of much more design diversity than used in this study, so expanding the design space is a key goal. Additional studies will explore questions such as: Are there regions that humans can reach that evolution struggles with, or vice versa? Similarly, we wish to exploit the ability to easily fabricate the robots and move some of the experimentation to reality.
Acknowledgements.
This work was conducted at the General Robotics, Automation, Sensing & Perception (GRASP) Laboratory at the University of Pennsylvania. The work was supported in part by the National Science Foundation under Grant #1845339.References
- (1)
- Alvarez et al. (2021) Alberto Alvarez, Jose Font, Steve Dahlskog, and Julian Togelius. 2021. Assessing the Effects of Interacting with MAP-Elites. Proceedings of the AAAI Conference on Artificial Intelligence and Interactive Digital Entertainment 17, 1 (Oct. 2021), 124–131. https://ojs.aaai.org/index.php/AIIDE/article/view/18899
- Auerbach et al. (2014) Joshua Auerbach, Deniz Aydin, Andrea Maesani, Przemyslaw Kornatowski, Titus Cieslewski, Grégoire Heitz, Pradeep Fernando, Ilya Loshchilov, Ludovic Daler, and Dario Floreano. 2014. Robogen: Robot generation through artificial evolution. In ALIFE 14: The Fourteenth International Conference on the Synthesis and Simulation of Living Systems. MIT Press, 136–137.
- Banzhaf (2000) Wolfgang Banzhaf. 2000. Interactive evolution. Evolutionary Computation 1 (2000), 228–234.
- Bongard et al. (2012) Josh Bongard, Paul Beliveau, and Gregory Hornby. 2012. Avoiding Local Optima with Interactive Evolutionary Robotics. In Proceedings of the 14th Annual Conference Companion on Genetic and Evolutionary Computation (Philadelphia, Pennsylvania, USA) (GECCO ’12). Association for Computing Machinery, New York, NY, USA, 1405–1406. https://doi.org/10.1145/2330784.2330955
- Bongard (2013) Josh C Bongard. 2013. Evolutionary robotics. Commun. ACM 56, 8 (2013), 74–83.
- Cardamone et al. (2011) Luigi Cardamone, Daniele Loiacono, and Pier Luca Lanzi. 2011. Interactive evolution for the procedural generation of tracks in a high-end racing game. In Proceedings of the 13th annual conference on Genetic and evolutionary computation. 395–402.
- Clune et al. (2013) J. Clune, A. Chen, and H. Lipson. 2013. Upload any object and evolve it: Injecting complex geometric patterns into CPPNS for further evolution. In 2013 IEEE Congress on Evolutionary Computation. 3395–3402. https://doi.org/10.1109/CEC.2013.6557986
- Coros et al. (2013) Stelian Coros, Bernhard Thomaszewski, Gioacchino Noris, Shinjiro Sueda, Moira Forberg, Robert W. Sumner, Wojciech Matusik, and Bernd Bickel. 2013. Computational Design of Mechanical Characters. ACM Trans. Graph. 32, 4, Article 83 (jul 2013), 12 pages. https://doi.org/10.1145/2461912.2461953
- Desai et al. (2018) Ruta Desai, Beichen Li, Ye Yuan, and Stelian Coros. 2018. Interactive co-design of form and function for legged robots using the adjoint method. arXiv preprint arXiv:1801.00385 (2018).
- Doncieux et al. (2015) Stephane Doncieux, Nicolas Bredeche, Jean-Baptiste Mouret, and Agoston E Gusz Eiben. 2015. Evolutionary robotics: what, why, and where to. Frontiers in Robotics and AI 2 (2015), 4.
- ed eric Gruau and Quatramaran (1996) Fr ed eric Gruau and Kameel Quatramaran. 1996. Cellular encoding for interactive evolutionary robotics. Technical Report.
- Gaier et al. (2018) Adam Gaier, Alexander Asteroth, and Jean-Baptiste Mouret. 2018. Data-efficient design exploration through surrogate-assisted illumination. Evolutionary computation 26, 3 (2018), 381–410.
- Harding and Brandt-Olsen (2018) John Harding and Cecilie Brandt-Olsen. 2018. Biomorpher: Interactive evolution for parametric design. International Journal of Architectural Computing 16, 2 (2018), 144–163. https://doi.org/10.1177/1478077118778579 arXiv:https://doi.org/10.1177/1478077118778579
- Hoisl (2012) Frank Hoisl. 2012. Visual, interactive 3D spatial grammars in CAD for computational design synthesis. Ph.D. Dissertation. Technische Universität München.
- Howard et al. (2019) David Howard, Agoston E Eiben, Danielle Frances Kennedy, Jean-Baptiste Mouret, Philip Valencia, and Dave Winkler. 2019. Evolving embodied intelligence from materials to machines. Nature Machine Intelligence 1, 1 (2019), 12–19.
- Howard et al. (2021) David Howard, Jack O’Connor, Jordan Letchford, James Brett, Therese Joseph, Sophia Lin, Daniel Furby, and Gary W. Delaney. 2021. Getting a Grip: in Materio Evolution of Membrane Morphology for Soft Robotic Jamming Grippers. arXiv:2111.01952 [cs.RO]
- Howard et al. (2020) Gerard Howard, Thomas Lowe, and Wade Geles. 2020. Diversity-based design assist for large legged robots. In Proceedings of the 2020 Genetic and Evolutionary Computation Conference Companion. 81–82.
- Katagami and Yamada (2002) D. Katagami and S. Yamada. 2002. Interactive evolutionary robotics from different viewpoints of observation. In IEEE/RSJ International Conference on Intelligent Robots and Systems, Vol. 2. 1108–1113 vol.2. https://doi.org/10.1109/IRDS.2002.1043879
- Lameijer et al. (2006) Eric-Wubbo Lameijer, Joost N Kok, Thomas Bäck, and Ad P IJzerman. 2006. The molecule evoluator. An interactive evolutionary algorithm for the design of drug-like molecules. Journal of chemical information and modeling 46, 2 (2006), 545–552.
- Lehman et al. (2020) Joel Lehman, Jeff Clune, Dusan Misevic, Christoph Adami, Lee Altenberg, Julie Beaulieu, Peter J Bentley, Samuel Bernard, Guillaume Beslon, David M Bryson, et al. 2020. The surprising creativity of digital evolution: A collection of anecdotes from the evolutionary computation and artificial life research communities. Artificial life 26, 2 (2020), 274–306.
- Lehman and Stanley (2011) Joel Lehman and Kenneth O Stanley. 2011. Evolving a diversity of virtual creatures through novelty search and local competition. In Proceedings of the 13th annual conference on Genetic and evolutionary computation. 211–218.
- Liapis et al. (2013) Antonios Liapis, Georgios N Yannakakis, and Julian Togelius. 2013. Sentient sketchbook: computer-assisted game level authoring. (2013).
- Lipson and Pollack (2000) Hod Lipson and Jordan B Pollack. 2000. Automatic design and manufacture of robotic lifeforms. Nature 406, 6799 (2000), 974–978.
- McCormack et al. (1993) Jon McCormack et al. 1993. Interactive evolution of L-system grammars for computer graphics modelling. Complex Systems: from biology to computation (1993), 118–130.
- Megaro et al. (2015) Vittorio Megaro, Bernhard Thomaszewski, Maurizio Nitti, Otmar Hilliges, Markus Gross, and Stelian Coros. 2015. Interactive Design of 3D-Printable Robotic Creatures. ACM Trans. Graph. 34, 6, Article 216 (oct 2015), 9 pages. https://doi.org/10.1145/2816795.2818137
- Mouret and Clune (2015) Jean-Baptiste Mouret and Jeff Clune. 2015. Illuminating search spaces by mapping elites. arXiv preprint arXiv:1504.04909 (2015).
- Nolfi and Floreano (2000) Stefano Nolfi and Dario Floreano. 2000. Evolutionary robotics: The biology, intelligence, and technology of self-organizing machines. MIT press.
- Pugh et al. (2016) Justin K Pugh, Lisa B Soros, and Kenneth O Stanley. 2016. Quality diversity: A new frontier for evolutionary computation. Frontiers in Robotics and AI 3 (2016), 40.
- Quiroz et al. (2009) Juan C. Quiroz, Amit Banerjee, Sushil J. Louis, and Sergiu M. Dascalu. 2009. Document design with interactive evolution. 309–319. https://doi.org/10.1007/978-3-642-02937-0_28 Copyright: Copyright 2009 Elsevier B.V., All rights reserved.
- Schrum et al. (2020) Jacob Schrum, Jake Gutierrez, Vanessa Volz, Jialin Liu, Simon Lucas, and Sebastian Risi. 2020. Interactive Evolution and Exploration within Latent Level-Design Space of Generative Adversarial Networks. In Proceedings of the 2020 Genetic and Evolutionary Computation Conference (Cancún, Mexico) (GECCO ’20). Association for Computing Machinery, New York, NY, USA, 148–156. https://doi.org/10.1145/3377930.3389821
- Schulz et al. (2017a) Adriana Schulz, Cynthia Sung, Andrew Spielberg, Wei Zhao, Robin Cheng, Eitan Grinspun, Daniela Rus, and Wojciech Matusik. 2017a. Interactive robogami: An end-to-end system for design of robots with ground locomotion. The International Journal of Robotics Research 36, 10 (2017), 1131–1147. https://doi.org/10.1177/0278364917723465 arXiv:https://doi.org/10.1177/0278364917723465
- Schulz et al. (2017b) Adriana Schulz, Jie Xu, Bo Zhu, Changxi Zheng, Eitan Grinspun, and Wojciech Matusik. 2017b. Interactive design space exploration and optimization for cad models. ACM Transactions on Graphics (TOG) 36, 4 (2017), 1–14.
- Secretan et al. (2008) Jimmy Secretan, Nicholas Beato, David B D Ambrosio, Adelein Rodriguez, Adam Campbell, and Kenneth O Stanley. 2008. Picbreeder: evolving pictures collaboratively online. In Proceedings of the SIGCHI Conference on Human Factors in Computing Systems. 1759–1768.
- Sims (1992) Karl Sims. 1992. Interactive evolution of dynamical systems. In Toward a practice of autonomous systems: Proceedings of the first European conference on artificial life. 171–178.
- Sims (1994) Karl Sims. 1994. Evolving virtual creatures. In Proceedings of the 21st annual conference on Computer graphics and interactive techniques. 15–22.
- Tasora et al. (2015) Alessandro Tasora, Radu Serban, Hammad Mazhar, Arman Pazouki, Daniel Melanz, Jonathan Fleischmann, Michael Taylor, Hiroyuki Sugiyama, and Dan Negrut. 2015. Chrono: An open source multi-physics dynamics engine. In International Conference on High Performance Computing in Science and Engineering. Springer, 19–49.
- Umetani et al. (2014) Nobuyuki Umetani, Yuki Koyama, Ryan Schmidt, and Takeo Igarashi. 2014. Pteromys: Interactive design and optimization of free-formed free-flight model airplanes. ACM Transactions on Graphics (TOG) 33, 4 (2014), 1–10.