Observation of the X17 anomaly in the 7Li(,)8Be direct proton-capture reaction
Abstract
Angular correlation spectra of pairs produced in the 7Li(,)8Be nuclear reaction have been studied at the sharp = 441 keV resonance as well as at = 650 keV, 800 keV and 1100 keV proton beam energies. The spectra measured at the resonance can be understood through the M1 internal pair creation process, but in the case of the off-resonance regions (direct proton capture) significant anomalies were observed in the angular correlations supporting the X17 hypothetical particle creation and decay.
I Introduction
Recently, we studied electron-positron angular correlations for the 17.6 MeV and 18.15 MeV transitions in 8Be and an anomalous angular correlation was observed for the 18.15 MeV transition kr16 . This was interpreted as the creation and decay of an intermediate bosonic particle with a mass of =16.700.35(stat)0.5(sys) MeV, which is now called X17. The possible relation of the X17 boson to the dark-matter problem triggered an enormous interest in the wider physics community da19 ; ins .
The first theoretical interpretation of the experimental results was provided by Feng et al. fe16 ; fe17 . They generalized the theory of the dark photon so that the new particle, which in the literature was named X17, could be coupled not only to the electric charge but also to the quarks. Coupling constants were determined using our, and previously obtained, experimental data. They called their theory protophobic because the X17 boson was coupled much weaker to protons than to neutrons. They predicted that the X17 particle should also be created in the 17.6 MeV transition of the 8Be nucleus, with a branching ratio 2.3 times smaller than in the case of the 18.15 MeV transition. However, in our original publication we did not find any anomaly in that transition, which could confirm this prediction.
In 2017, we re-investigated the 8Be anomaly with an improved, and independent setup, and confirmed the signal of the assumed X17 particle kra18 ; kra19 . We studied also the 17.6 MeV M1 transition to check the different theoretical predictions, but obtained different branching ratios kr137 ; kr141 ; kr17 .
Recently, we also observed a similar anomaly in 4He kra19 ; fi20 ; kr20 ; kr21 . The signal could be described by the creation and subsequent decay of a light particle during the proton capture process on 3H to the ground state of the 4He nucleus. The derived mass of the particle ((stat.)(syst.) MeV) agrees well with that of the proposed X17 particle. It was also shown that the branching ratios of the X17 particle are identical within uncertainties for three beam energies, proving that the X17 particle was most likely formed in direct proton capture, which has a dominant multipolarity of E1. Our results obtained for 4He at different beam energies agree well with the present theoretical results calculated with ab-initio models by Viviani et al. vi21 .
Zhang and Miller zh21 studied the protophobic vector boson explanation in 8Be, by deriving an isospin relation between the coupling of photon and X17 to nucleons. They concluded that the X17 production may be dominated by direct-capture (E1) transitions and a smooth energy dependence is predicted for all proton beam energies above the 17.6 MeV Jπ=1+ resonance zh21 . (However, for the resonance they found the M1-induced X17 production is also very important.)
The aim of the present work was to study the off-resonance region for the 7Li(,)8Be reaction in order to check if the X17 particle is created at these energies as well, as predicted by Zhang and Miller zh21 .
II Experiments
A proton beam with a typical current of 5 A bombarded LiF and Li2O targets for about 50 hours for each bombarding energy. The target thickness for the on-resonance measurement was 30 , and for the off-resonance measurements 300 . All of the targets were evaporated onto aluminum strips with thicknesses of 10 m.
The Plexiglas rods, we used previously for holding the targets kr16 ; gu16 , were replaced with Al rods to get a better cooling of the targets to prevent the diffusion of Li/Li2O into the target backing. In this way we managed to significantly increase the lifetime of the targets, which made it possible to perform on- and off-resonance measurements with the same target. Unfortunately, such Al rods produced a somewhat larger background induced by the -rays on the rods, as shown in Fig. 1 b), than what we observed in Fig. 9 of Ref. gu16 .
Our previous detector setup kr16 ; gu16 has recently been upgraded. The details of the upgrade are described in detail in kr21 . Time and energy signals of the scintillators, as well as the time, energy and position signals of the DSSD detectors were recorded.
In order to search for the assumed X17 particle, both the energy-sum spectrum of the pairs measured by the telescopes, and their angular correlations, determined by the DSSD detectors, have been analyzed. For the real “signal” events we always required that the energy-sum for the -pairs should be equal to the transition energy, which we want to investigate.
The energy calibration of the telescopes, the energy and position calibrations of the DSSD detectors, the Monte Carlo simulations as well as the acceptance calibration of the whole coincidence pair spectrometer were performed in a similar way as we described in Ref. kr21 .
Reasonably good agreement was obtained with the results of the Monte Carlo simulations, as presented in Fig. 1 for the present setup. The average difference is within % in the 40∘ - 170∘ range.
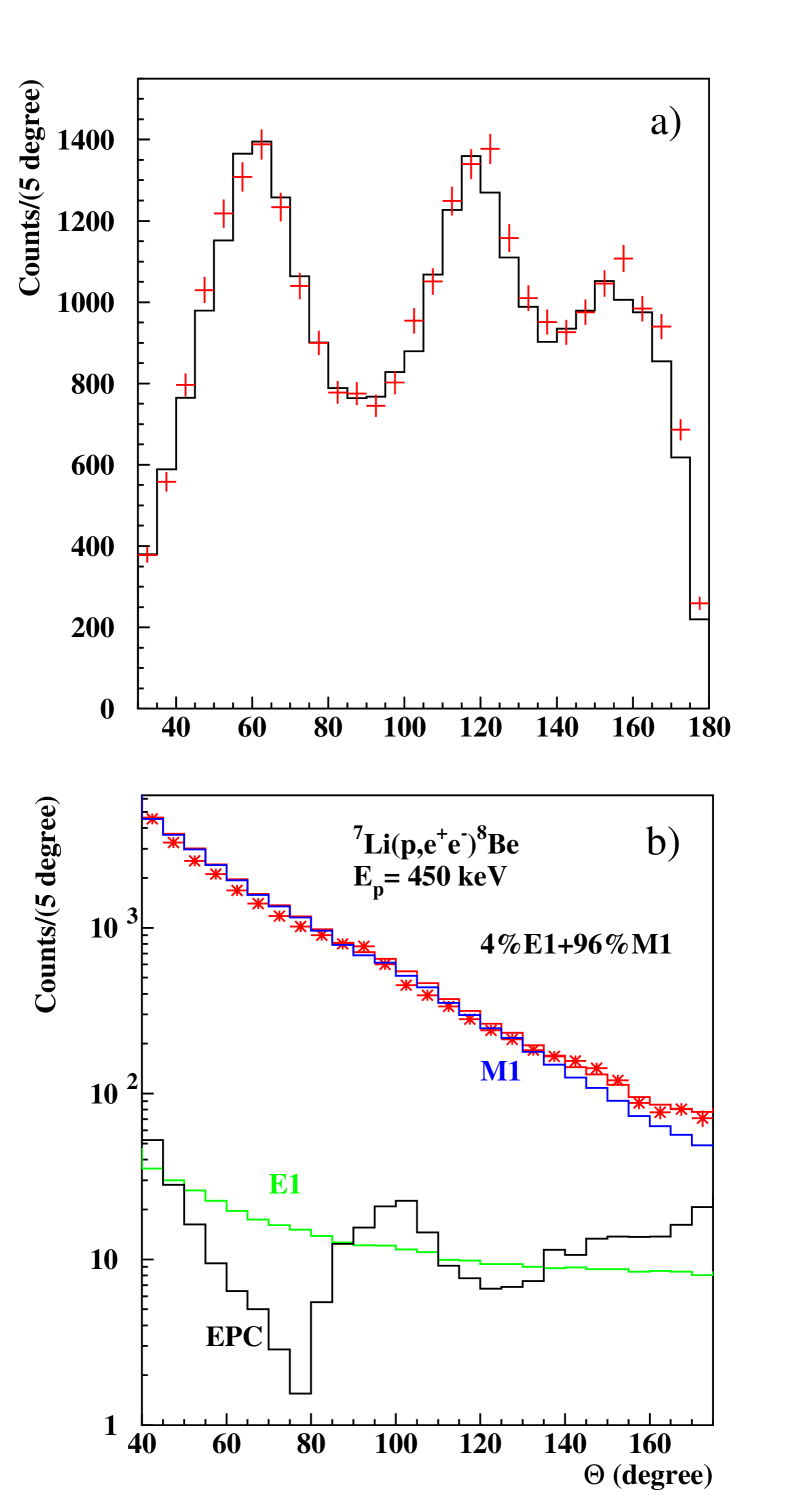
In order to test the accuracy of these simulations for describing our experiments, we made measurements with the 7Li(,)8Be reaction. The results for the angular correlations from this data obtained at the Ep = 441 keV resonance (red dots with error bars) are shown in Fig. 1 b), together with the corresponding IPC Monte Carlo simulation (histogram) coming mostly from the M1 nuclear transition. The contribution coming from the External Pair Creation (EPC) of the 17.6 MeV -rays is shown by solid black-line histogram. We note here that the direct-capture contribution is negligible compared to the M1 IPC due to the large resonance capture cross section and the thin target. The ratio of the event numbers used for the simulations are determined by the internal pair creation coefficient of the 17.6 MeV M1 transition.
As it can be seen in Fig. 1, the simulation of this single (IPC) process manages to describe the shape of the e+e- angular correlation data distribution accurately, and the contribution of EPC created on the different parts of the spectrometer is reasonably low. It is especially true for the Al backing of the target. We performed simulations without such backing and with backing. Their difference was smaller than 10% of the full EPC contribution in the angular range.
III Experimental results
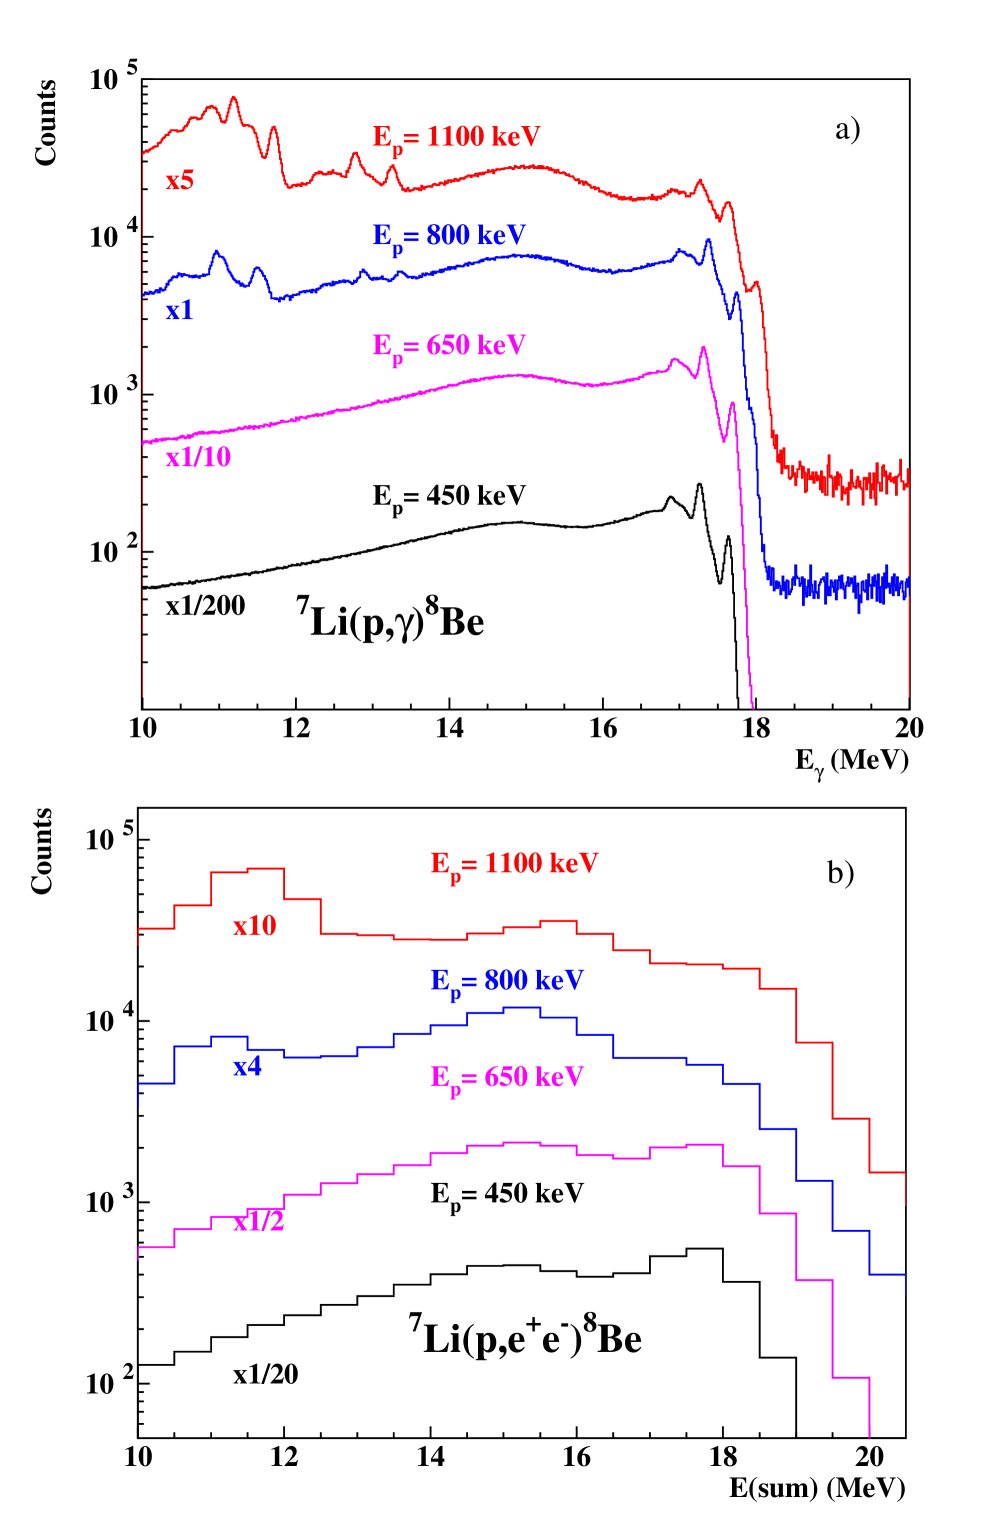
At the low bombarding energies we used, the monitoring -ray spectra observed in the 13.5 MeV - 20 MeV energy range were very clean as shown in Fig. 2 a). The corresponding energy-sum spectra of the pairs measured by the telescopes are shown in Fig. 2 b). The “signal” region for E(sum) was chosen to be very wide, from 13.5 MeV to 20.0 MeV including both the transition to the ground state and the transition to the first-excited state of 8Be.
The angular correlations of the pairs were determined from the position data of the DSSD detectors for each beam energy. The Cosmic Ray Background CRB contributions were subtracted. Considering the kinematics of the pair-creation process, we also required the following condition for the asymmetry parameter: , where and denote the kinetic energies of the positron and electron, respectively. The raw angular correlations were then corrected for the detector response shown in Fig. 1.
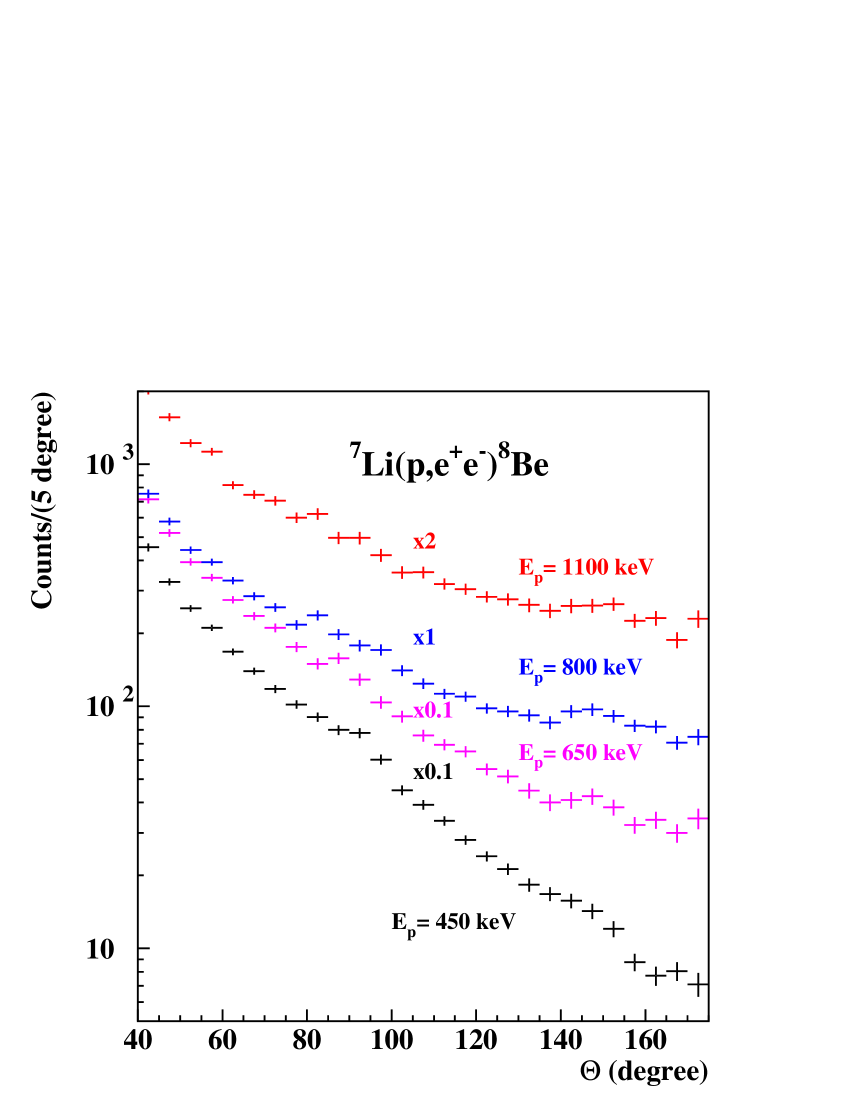
The resulting angular-correlation spectra are indicated in Fig. 3 by dots with error bars for Ep= 450 keV (black) and 650 keV (magenta), 800 keV (blue) and 1100 keV (red). For better visibility, some spectra are multiplied by factors as shown in the figure.
The slopes of the angular correlations differ significantly. They are expected to have contributions from M1 multipolarity transitions coming from the resonant proton capture (17.6 and 18.15 MeV states) as well as from the E1 multipolarity transitions resulting from the direct proton-capture process. Since the simulated angular correlation drops much steeper for the M1 than for the E1 multipolarities as shown in Fig. 1, the experimental angular correlation could be fitted by the linear combination of the two (M1 and E1) simulated curves in the 40-130 degree angular range, where no anomaly is expected in Fig. 3. The results of the fits are shown in Fig. 4., which can be reasonably well explained as follows:
-
1.
the M1 contribution is the largest for the 441 keV (Ep= 450 keV) resonance and dominates the distribution.
-
2.
The E1 distribution resulting from the proton direct capture starts to dominate at Ep=650 keV, but since the proton energy loss in the target is about 200 keV, the M1 distribution from the strong 441 keV resonance is still visible.
-
3.
The contribution of the E1 distribution is the largest at Ep=800 keV. There is only 9.5% M1 contribution, which may be coming from the tail of the 1030 keV resonance.
-
4.
The contribution of the M1 distribution increased by a factor of more than 3 at Ep=1100 keV, when we are on the top of the 1030 keV resonance.
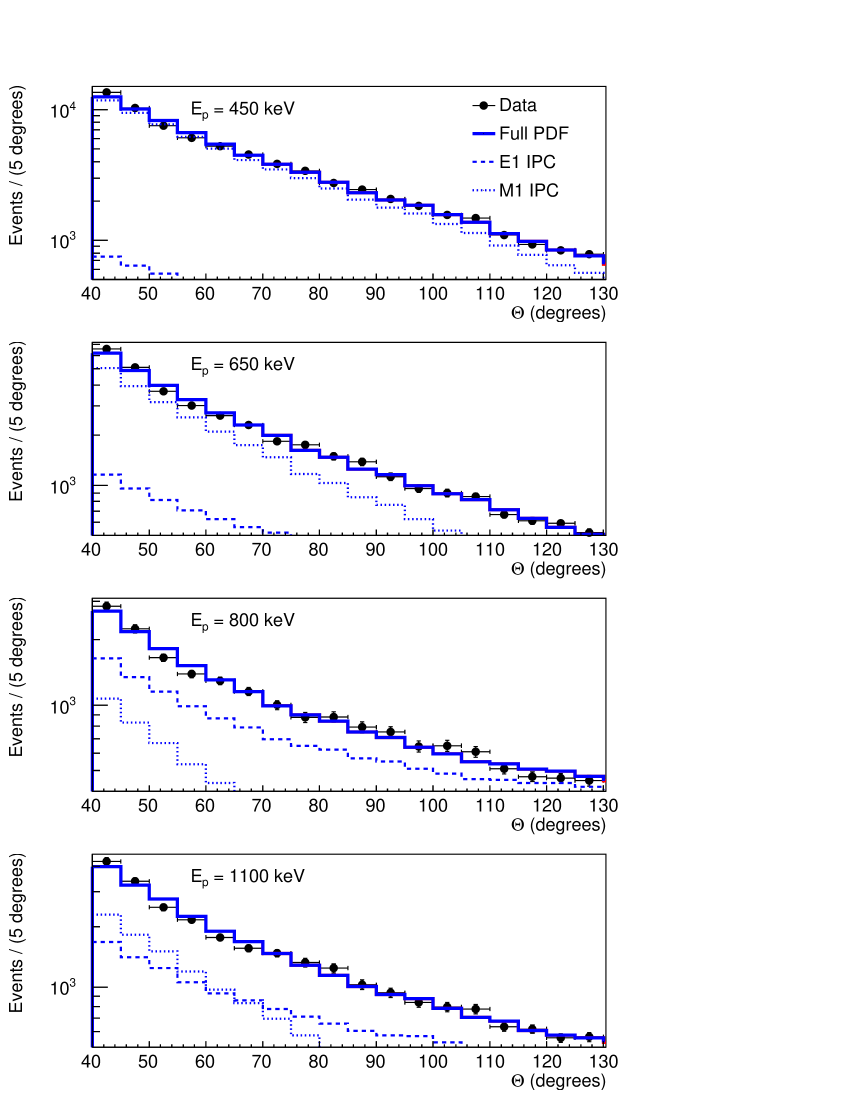
The fitted E1 and M1 simulated angular correlations are assumed to be valid also at larger angles up to 175 degrees (the last bin of the distributions where the acceptance of the spectrometer is the smallest was rejected from the fit) and the anomaly is defined as the difference of the experimental and simulated distributions.
The anomaly around 140∘ was then fitted with the mixed E1+M1 angular correlation with the mixing ratio obtained for the 40∘-175∘ angular range, and the expected decay of the assumed X17 particle. The fit was performed with RooFit Verkerke:2003ir in a similar way as we did in our previous work kr21 . The results of the fits corresponding to the different proton bombarding energies are shown in Fig. 5.
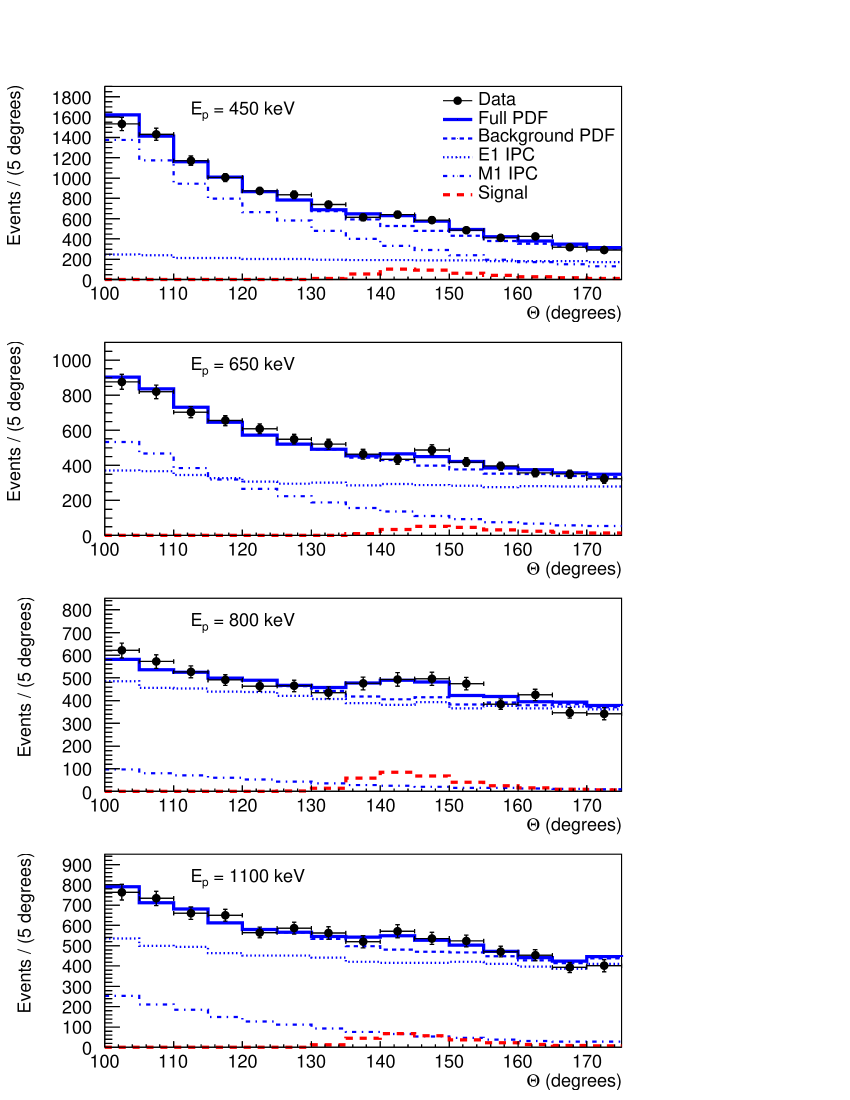
The fitting parameters for the E1 and M1 and IPC distributions as well as the contribution of the X17 particle are summarized in Table 1. The significance of the fits on average is: 4.5.
| Ep | m(X17) | I(X17) | I(E1) | I(M1) | B(X17) |
|---|---|---|---|---|---|
| (keV) | (MeV/c2) | ||||
| 450 | 16.6(3) | 43(49) | 30(25) | 79(2) | 1.4(16) |
| 650 | 16.94(14) | 24(16) | 46(5) | 32(4) | 0.5(3) |
| 800 | 16.81(9) | 33(10) | 62(4) | 5.9(4) | 0.53(14) |
| 1100 | 17.11(12) | 28(8) | 66(2) | 15(1) | 0.41(13) |
Checking the fitted parameters, the ratio of I(M1)/I(E1) determined at the Ep= 1030 keV resonance compared to the one determined at 800 keV is about a factor of two larger, as suggested recently by Hayes et al. in Fig. 3. of Ref. ha21 . It seems also that the amplitude of the X17 contribution, I(X17), correlates with the amplitude of the E1 multipolarity, I(E1), and not with the M1 one as suggested in Ref. 1. This result supports the vector character of the X17 particle and not the axial-vector one as suggested in earlier publications.
IV Summary
We have studied the energy-sum and angular correlation spectra of pairs produced in the 7Li(,)8Be reaction at Ep= 450, 650, 800 and 1100 keV proton energies. The main features of the spectra can be understood rather well by taking into account the internal pair creations following the M1 radiations coming from the decay of the states and the E1 ones coming from the direct proton capture on the target.
We observed a peak-like anomalous excess of pairs in the angular correlation spectra around 140∘ at each beam energy. This excess can be described by the creation and subsequent decay of a light particle, created during the proton-capture process to the ground state of the 8Be nucleus. The derived mass of the particle ((stat.)(syst.) MeV) agrees well with that of the X17 particle, which we recently suggested kr16 ; kra18 ; kra19 for describing the anomaly observed in 8Be.
The contribution anomalous excess at 450 keV was much smaller than in the other measurements, which seems to contradict with the theoretical prediction of Zhang and Miller zh21 .
It seems that the particle is created in the direct proton-capture process and not in the M1 decay of the 17.6 and 18.15 MeV J states. Our present results obtained for 8Be at different beam energies above Ep=450 keV agree well with the prediction of Zhang and Miller zh21 and do not invalidate the protophobic vector boson interpretation of Feng et al. fe16 .
V Acknowledgements
We wish to thank Z. Pintye for the mechanical design of the experiment. This work has been supported by the Hungarian NKFI Foundation No. K124810 and by the GINOP-2.3.3-15-2016-00034 and
GINOP-2.3.3-15-2016-00005 grants.
VI Appendix: Comparison with our previous results
The difference between our previous results kr16 and the present ones needs some explanation. Especially, the angular correlation spectrum at Ep=800 keV seems to differ considerably from the one reported from our previous experiment kr16 . We did not report about an anomaly at this energy. The contradiction can be resolved taking into account that the observation or non-observation of the anomaly depends strongly on how one models the background.
The shape of the background depends strongly on the ratio of the induced M1 and E1 IPC processes . It turned out that properties of the used targets can considerably modify this ratio, which will be discussed further below.
The results of our previous angular-correlation measurement kr16 performed at Ep=800 keV are shown in Fig. 6. Red circles with error bars indicate the previous results, the black histogram represents the fitted background using the E1/M1 ratio observed in the present measurement, while the blue histogram represent the results of the simulations performed for the X17 boson.
It can be clearly seen in Fig. 6 that with the new background, the peak-like anomaly is also visible at Ep=800 keV in our previous measurement, not only at Ep=1100 keV as we wrote in our previous publication. In this way, the two data sets do not actually contradict each other.
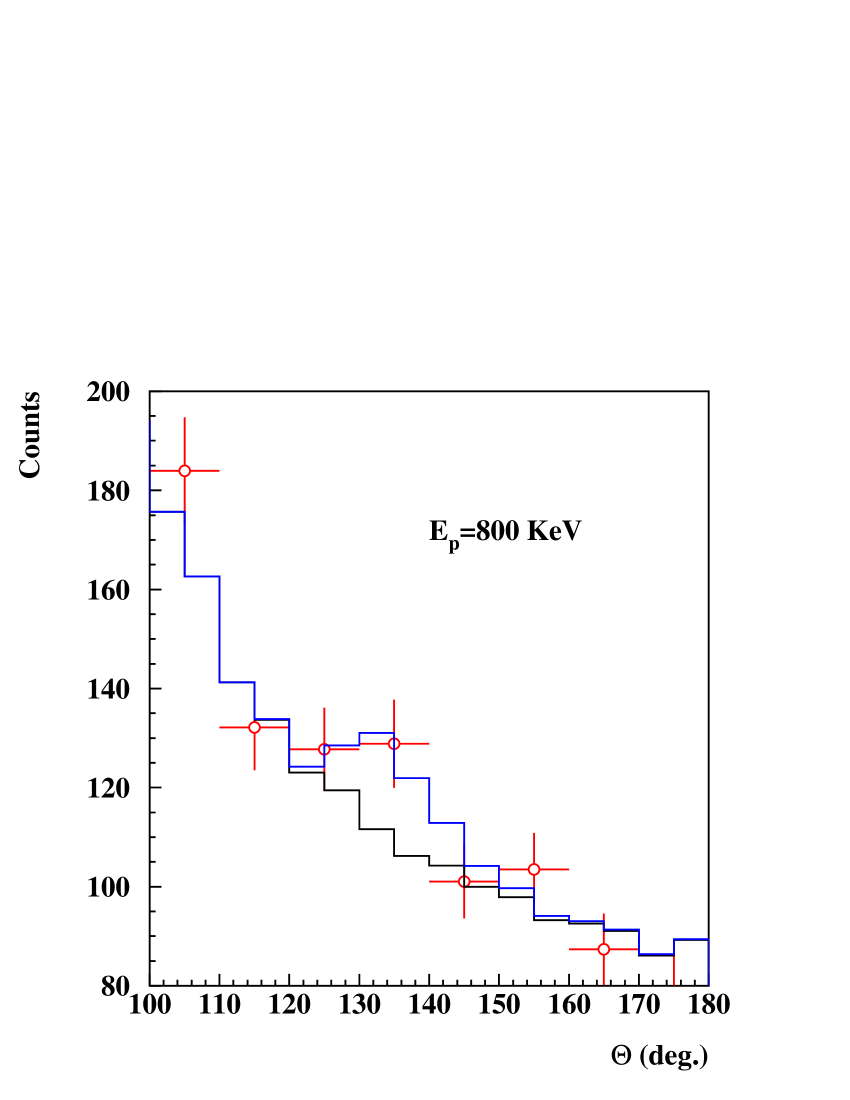
In Fig. 3 of Ref. kr16 , measurements at Ep = 1040 keV and Ep = 1100 keV were performed first. For these measurements, metal Li evaporated on Al backing was used as the target. After the targets were made, and until they were used, they could come into contact with air several times and thus become heavily oxidized, as indicated by their milky white color.
After the anomaly was observed at these energies, the off-resonance measurements were performed with thicker targets, and the transportation was made in an Argon atmosphere with more care taken so as not to oxidize the targets. We used thicker targets to offset the much smaller cross sections off resonance. However, by heating the target through bombardment by the proton beam, the metal Li diffused into the Al backing. Hence, the actual target thickness became equal to the backing thickness, which was 10 m, and in which the 800 keV protons were already completely stopped. Accordingly, we obtained significant amounts of pairs not only from the off-resonance region, but also from the strong 441 keV resonance, whose multipolarity being M1, increased the background at small angles. (Examining the gamma spectra measured at that time, the 17.6 MeV transition from the 441 keV resonance can also be intensively observed.) This was the reason that the shape of the background was assumed to be similar during the on- and off-resonance measurements in Ref. kr16 , although it should have been different as the M1 content should have been smaller at Ep = 800 keV than at Ep = 1100 keV. By using the present results for the shape of the background the anomaly becomes visible also at Ep = 800 keV, like in the present data. However, it should be mentioned that the new background underestimates the background of Ref. kr16 at smaller angles, which was coming mostly from the 17.6 MeV M1 transition in that case.
References
- (1) A.J. Krasznahorkay et al., Phys. Rev. Lett. 116 (2016) 042501.
- (2) A. Datta, J. Feng, S. Kamali, J. Kumar, arXiv:1908.08625.
- (3) Citations for Ref. [1]: http://inspirehep.net/search?ln=en&p=refersto%3Arecid%3A1358248
- (4) J.L. Feng, B. Fornal, I. Galon, S. Gardner, J. Smolinsky, T.M.P. Tait, P. Tanedo, Phys. Rev. Lett. 117 (2016) 071803.
- (5) J.L. Feng, B. Fornal, I. Galon, S. Gardner, J. Smolinsky, T.M.P. Tait, P. Tanedo, Phys. Rev. D 95 (2017) 035017.
- (6) A.J. Krasznahorkay et al., J. Phys.: Conf. Series 1056 (2018) 012028.
- (7) A.J. Krasznahorkay et al., Acta Phys. Pol. B 50 (2019) 675.
- (8) A.J. Krasznahorkay et al., EPJ Web of Conferences 137 (2017) 08010.
- (9) A.J. Krasznahorkay et al., EPJ Web of Conferences 142 (2017) 01019.
- (10) A.J. Krasznahorkay et al., Proceedings of Science (Bormio 2017) 036 (2017).
- (11) D.S. Firak et al., EPJ Web of Conferences 232 (2020) 04005.
- (12) A.J. Krasznahorkay et al., J. Phys.: Conf. Ser. 1643 (2020) 012001.
- (13) A.J. Krasznahorkay et al., Phys. Rev. C 104 (2021) 044003.
- (14) M. Viviani et al., Phys. Rev. C 105 (2022) 014001.
- (15) Xilin Zhang, and Gerald A. Miller, Phys. Lett. B 813 (2021) 136061.
- (16) U. Ellwanger and S. Moretti, JHEP 11 (2016) 39.
- (17) J. Gulyás et al., Nucl. Instr. Meth. Phys. Res. A 808 (2016) 21.
- (18) R. Brun, F. Bruyant, M. Maire, A.C. McPherson, P. Zanarini, Geant3 User’s guide, Report number: CERN-DD-EE-84-01 (1987).
- (19) M.E. Rose, Phys. Rev. 76 (1949) 678; M.E. Rose, Phys. Rev. 78 (1950) 184.
- (20) S. Ravan, P. Pujahari, S. Prasad, and C.A. Pruneau, Phys. Rev. C 89 (2014) 024906.
- (21) W. Verkerke and D. P. Kirkby, “The RooFit toolkit for data modeling”, eConf C 0303241 (2003) MOLT007 [physics/0306116].
- (22) A.C. Hayes, J. Friar, G.M. Hale, G.T. Garvey, arXiv:2106.06834v1 (2021).