Geminga contribution to the cosmic-ray positron excess according to the gamma-ray observations
Abstract
We attempt to interpret the cosmic-ray positron excess by injection from the nearby pulsar Geminga, assuming a two-zone diffusion scenario and an injection spectrum with a low energy cutoff. Since the high energy positrons and electrons from Geminga can induce rays via inverse Compton scattering, we take into account the extended -ray observations around Geminga from HAWC for TeV and from Fermi-LAT for GeV. According to the extended -ray observation claimed by an analysis of Fermi-LAT data, we find that Geminga could explain the positron excess for a energy conversion efficiency into positrons and electrons. However, based on the constraint on the extended rays given by another Fermi-LAT analysis, positrons from Geminga would be insufficient to account for the positron excess. A further robust analysis of Fermi-LAT data for the extended rays would be crucial to determine whether Geminga can explain the positron excess or not.
I Introduction
Since 2008, the measurements of cosmic-ray (CR) positrons by PAMELA PAMELA:2008gwm , Fermi-LAT Fermi-LAT:2011baq , and AMS-02 AMS:2013fma ; AMS:2019iwo have shown an unexpected excess at energies . Possible interpretations for this excess include annihilating/decaying dark matter Bergstrom:2008gr ; Cholis:2008hb ; Yin:2008bs ; Yuan:2013eja and astrophysical sources like nearby pulsars within kpc Hooper:2008kg ; Yuksel:2008rf . In particular, the middle-aged pulsar Geminga with a distance of is widely assumed to produce high energy positrons that could propagate to the Earth Hooper:2008kg ; Yuksel:2008rf ; Yin:2013vaa ; Feng:2015uta ; Hooper:2017tkg ; Cholis:2017ccs ; Fang:2018qco ; Profumo:2018fmz ; Cholis:2018izy ; Tang:2018wyr ; Xi:2018mii ; Johannesson:2019jlk ; DiMauro:2019yvh ; Fang:2019ayz ; Manconi:2020ipm ; Wang:2021xph ; Fang:2022mdg .
In 2017, the HAWC experiment observed rays spatially extended about 2 degrees around Geminga, which would be produced by positrons and electrons of energies via inverse Compton scattering (ICS) off low energy photons HAWC:2017kbo . Therefore, this observation confirms that Geminga is a source of high energy positrons and electrons. But the surface brightness profile (SBP) measured by HAWC implies a diffusion coefficient smaller than the conventional value by at least two orders of magnitude. The recent observation of another extended halo around the middle-aged pulsar J0621+3749 by LHAASO further established the general conclusion of slow diffusion around pulsars LHAASO:2021crt . Such slow diffusion results in much less CR positrons arriving at the Earth, unlikely to explain the positron excess. Nonetheless, by assuming a two-zone diffusion model with slow diffusion in a small zone around the source but normal diffusion outside the zone, positrons originated from Geminga can still sufficiently contribute to the positron excess Fang:2018qco ; Profumo:2018fmz ; Bao:2021hey .
In addition, positrons and electrons from Geminga are also expected to induce extended ICS rays in the energy range of Fermi-LAT. Based on two-zone diffusion templates, an analysis of 10-yr Fermi-LAT -ray data by Xi et al. Xi:2018mii (denoted as X19 below) did not find such extended emission and derive a stringent constraint on the -ray flux in the energy range. According to this constraint and the HAWC data, from Geminga with a single power-law injection spectrum can only contribute a small faction to the CR positron spectrum observed by AMS-02.
On the other hand, taking into account both a larger region of interest and the proper motion of the Geminga pulsar, another analysis of Fermi-LAT data by Di Mauro et al. DiMauro:2019yvh (denoted as D19 hereafter) claimed a discovery of extended -ray emissions around Geminga in the energy range of – . However, considering both the corresponding -ray flux and the HAWC data, the Geminga contribution to the position flux they obtained is not enough for the AMS-02 excess.
Both the X19 and D19 analyses assumed a single power-law Geminga injection spectrum with a high energy cutoff. The inconsistency with the AMS-02 data may indicate that there are less low energy positrons and electrons producing GeV rays. Therefore, we will attempt to modify the injection spectrum by adding a low energy cutoff, in order to simultaneously explain the HAWC, Fermi-LAT, and AMS-02 data. The results of the -ray flux from the X19 and D19 analyses will be considered separately.
This paper is organized as follows. In Section II, we describe the propagation of positrons and electrons produced by Geminga and the -ray flux induced by ICS. In Section III, we simultaneously interpret the HAWC data, the Fermi-LAT -ray observation given by D19, and the AMS-02 positron spectrum assuming an injection spectrum with a low energy cutoff. In Section IV, we use the Fermi-LAT -ray constraint given by X19 to explore how much contribution Geminga can supply to the AMS-02 positron excess. Section V gives the summary and discussion.
II Positrons and electrons from Geminga
The Geminga pulsar is a -ray source discovered by SAS-2 Fichtel:1975 . Its age is about Manchester:2004bp , and the distance for the Earth is Faherty:2007 . Geminga is expected to emit lots of positrons and electrons, which diffuse away from Geminga and lose energies by upscatter low energy photons in the cosmic microwave background (CMB) and interstellar radiation backgrounds through ICS processes.
The propagation of CR is described by the diffusion-cooling equation
| (1) |
where is the differential density, is the energy, is the diffusion coefficient, and is the source term. The energy loss rate includes both contributions from synchrotron radiation and ICS. The synchrotron energy loss rate in a magnetic field is given by Crusius:1988
| (2) |
where is the Thomson cross section, is the Lorentz factor, and is the energy density of the magnetic field. The energy loss rate due to ICS is estimated following Ref. Fang:2020dmi . We convert the propagation equation to a difference equation, which is solved using the numerical method described in Ref. Fang:2018qco .
We assume a spherically symmetrical two-zone diffusion scenario with the diffusion coefficient given by
| (3) |
Here is the distance from Geminga, and denotes the boundary of the two diffusion zones. Both and are assumed to have a form of , where is the diffusion coefficient at , and is adopted for a Kolmogorov-type diffusion Kolmogorov:1941 .
The morphological SBP study of the extended TeV -ray emissions around Geminga by HAWC gives a diffusion coefficient for around Geminga, while a similar study of another nearby pulsar Monogen (PSR B0656+14) leads to HAWC:2017kbo . The joint fit of both results in . Thus, for the inner zone with is at the order of . For the outer zone with , positrons and electrons propagate through the ordinary interstellar medium (ISM), and we take the GALPROP Moskalenko:1997gh default value , which is consistent with the measurements of CR secondary-to-primary ratios, particularly the ratio.
The source term for high energy injected by Geminga is assumed as
| (4) |
where
| (5) |
is the characteristic initial spin-down time scale of the Geminga pulsar, taken to be following Ref. HAWC:2017kbo . is the injection spectral index for . and are the high and low energy cutoffs, respectively. is a constant determined by the normalization relation
| (6) |
with the Geminga age and the spin-down luminosity Manchester:2004bp . Here is the conversion efficiency for the spin-down energy converted to energies. We will not consider the difference between the positrons and electrons when calculating the -ray flux, and the positron flux is just a half of the total flux.
The photon emissivity due to ICS based on the Klein-Nishina cross section is given by Fang:2007sc
| (7) |
is the number density of a background photon component with energy , temperature , and energy density , expressed as
| (8) |
where is the Boltzmann constant. The energy threshold for upscattering a target photon with energy to a photon with energy is
| (9) |
is the intensity, with denoting the speed, which approaches the light speed for high energy . The function is given by
| (10) |
with
| (11) |
Following Ref. HAWC:2017kbo , we consider three background photon components, including the CMB, the IR background, and the optical background, for the ICS processes. The temperatures and energy densities are presented in Table 1. Integrating along the light of sight Liu:2019sfl , we obtain the -ray flux for specific energy and angular separation ,
| (12) |
Then we integrate out to get the energy spectrum of the -ray flux , or integrate out to derive the SBP as a function of . The angular separation is integrated up to , which is consistent with the large regions of interest considered in the X19 Xi:2018mii and D19 DiMauro:2019yvh analyses of Fermi-LAT data.
| Component | (K) | () |
|---|---|---|
| CMB | 2.7 | 0.26 |
| IR | 20 | 0.3 |
| Optical | 5000 | 0.3 |
III Result according to the D19 gamma-ray observation
In this section, we try to interpret the HAWC and AMS-02 data according to the Fermi-LAT -ray observation from the D19 analysis DiMauro:2019yvh . Both the results without and with the low energy cutoff in the injection spectrum are calculated for comparison.
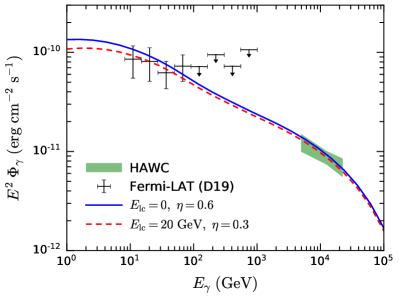
Firstly, we consider an injection spectrum without , and adjusting the energy conversion efficiency to meet the data. Setting the boundary radius , the diffusion coefficient at in the inner diffusion zone , the ISM magnetic field , the injection spectral index , and the high energy cutoff , we derive the -ray spectrum around Geminga, the Geminga SBP, and the CR positron spectrum at the Earth for , shown as the blue solid lines in Fig. 1.
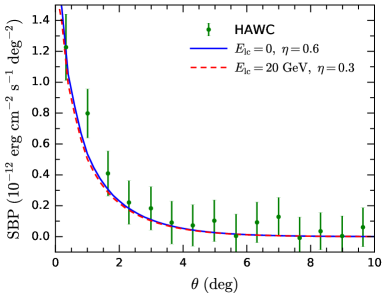
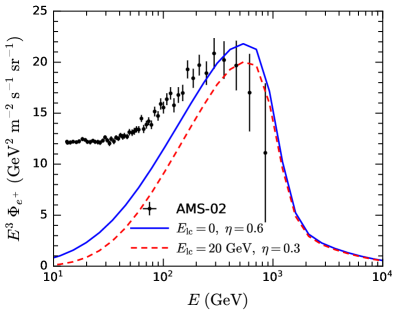
In order to compare the predictions and the observations, we show the spectral data measured by HAWC HAWC:2017kbo and the Fermi-LAT data points and upper limits from to given by the D19 analysis DiMauro:2019yvh in Fig. 1(a). The HAWC observation of the Geminga SBP HAWC:2017kbo is demonstrated in Fig. 1(b), while the positron spectrum measured by AMS-02 AMS:2019iwo is displayed in Fig. 1(c). For the above setup with , we find that the -ray prediction can well interpret the -ray spectrum and the SBP, and the predicted spectrum can explain the AMS-02 data at . However, a efficiency of the spin-down energy converted to energies looks unrealistic.
Secondly, we introduce a low energy cutoff in the injection spectrum with other parameters unchanged, and find that the observational data can be explained for , as illustrated as the red dashed lines in Fig. 1. Such a conversion efficiency is much more reasonable than the previous one. Now the predicted positron flux at seems slightly lower than the blue solid line, but we can still interpret the AMS-02 data at very well.
IV Result according to the X19 gamma-ray constraint
In contrast to the D19 analysis DiMauro:2019yvh , the X19 analysis of the Fermi-LAT data have not found any extended -ray emission around Geminga, deriving a rather stringent constraint on the -ray flux at Xi:2018mii . In this section, we consider this constraint to see how it affects the Geminga contribution to the CR positron spectrum, assuming a low energy cutoff in the injection spectrum. However, we find it impossible to simultaneously explain the HAWC, Fermi-LAT, and AMS-02 data, because the X19 constraint is too strict. Instead, we would like to know how much contribution Geminga can provide to the AMS-02 positron excess.
For this purpose, we treat , , , , , and in the inner diffusion zone as free parameters and perform a scan in the parameter space with fixed , utilizing the MultiNest algorithm Feroz:2008xx to improve the fitting efficiency. The ranges for the free parameters in the scan are chosen to be
| (13) |
| (pc) | |||
|---|---|---|---|
| (TeV) | |||
| (GeV) | |||
| () | |||
| () |
In order to get optimistic results, we adopt the most loose upper limits on the -ray flux in derived by the X19 analysis, i.e., the upper limits in the upper panel of Fig. 6 in the X19 paper Xi:2018mii . The parameters of the best results we obtain for are listed in Table 2. The corresponding predictions for the -ray spectrum, the SBP, and the positron spectrum are demonstrated in Fig. 2. While the HAWC data are properly fitted and the -ray flux in lies below the X19 upper limits, we find that Geminga can only supply less than of the AMS-02 positron flux at .
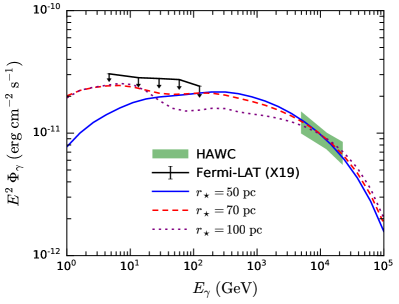
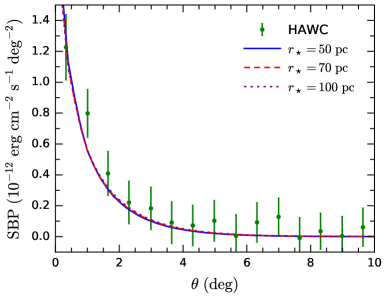
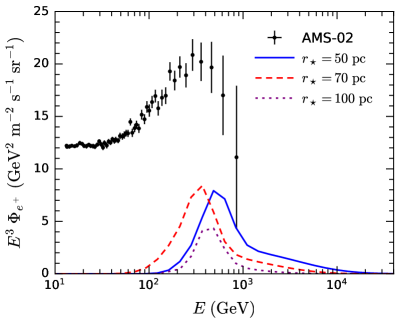
These results show that the X19 constraint favor , , and of several hundred GeV, which suppress the -ray flux at . According to an approximate relation Xi:2018mii
| (14) |
for ICS off CMB photons, rays are induced by . Thus, the X19 constraint implies less positrons and electrons from Geminga, resulting in a lower CR positron flux for at the Earth, which is insufficient to explain the AMS-02 excess.
V Summary and discussion
In this work, we attempt to explain the AMS-02 positron excess by the nearby pulsar Geminga assuming a two-zone diffusion scenario and an injection spectrum with a low energy cutoff, taking into account the -ray data from HAWC and Fermi-LAT. The analyses of Fermi-LAT data for extended -ray emissions around Geminga by two groups have obtained different results. While the X19 analysis found no such emission and derive upper limits on the -ray flux, the D19 analysis claimed an observation of the extended rays. We have considered both results separately.
By fitting the D19 observation and the HAWC data assuming no low energy cutoff in the injection spectrum, we find that the conversion efficiency should be as large as to account for the AMS-02 positron excess. Nonetheless, if a low energy cutoff is introduced, we would only need a conversion efficiency, which is much more realistic. Therefore, it is plausible to interpret the positron excess by Geminga, according to the D19 analysis.
On the other hand, if the stringent constraint from the X19 analysis is considered, we find that Geminga could not accounting for the total positron excess. We carry out a scan in the parameter space for the boundary radius and require to fit the HAWC data and satisfy the X19 constraint. The best results we obtain can only explain a faction of the AMS-02 positron flux lower than at . This may imply that more nearby pulsars or other sources are needed to interpret the positron excess.
Since the different conclusions obtained above come from the contradictory results of the two Fermi-LAT analyses, it is crucial to know whether result is true. This may require a more careful data analysis and more Fermi-LAT data.
Acknowledgements.
We thank Kun Fang for providing the code to solve the two-zone propagation equation. This work is supported in part by the National Natural Science Foundation of China under Grants No. 11875327 and No. 11805288, the Fundamental Research Funds for the Central Universities, and the Sun Yat-Sen University Science Foundation. Q.Y. is supported by the Program for Innovative Talents and Entrepreneur in Jiangsu.References
- (1) PAMELA Collaboration, O. Adriani et al., “An anomalous positron abundance in cosmic rays with energies 1.5-100 GeV,” Nature 458 (2009) 607–609, arXiv:0810.4995 [astro-ph].
- (2) Fermi-LAT Collaboration, M. Ackermann et al., “Measurement of separate cosmic-ray electron and positron spectra with the Fermi Large Area Telescope,” Phys. Rev. Lett. 108 (2012) 011103, arXiv:1109.0521 [astro-ph.HE].
- (3) AMS Collaboration, M. Aguilar et al., “First Result from the Alpha Magnetic Spectrometer on the International Space Station: Precision Measurement of the Positron Fraction in Primary Cosmic Rays of 0.5–350 GeV,” Phys. Rev. Lett. 110 (2013) 141102.
- (4) AMS Collaboration, M. Aguilar et al., “Towards Understanding the Origin of Cosmic-Ray Electrons,” Phys. Rev. Lett. 122 (2019) 101101.
- (5) L. Bergstrom, T. Bringmann, and J. Edsjo, “New Positron Spectral Features from Supersymmetric Dark Matter - a Way to Explain the PAMELA Data?,” Phys. Rev. D 78 (2008) 103520, arXiv:0808.3725 [astro-ph].
- (6) I. Cholis, L. Goodenough, D. Hooper, M. Simet, and N. Weiner, “High Energy Positrons From Annihilating Dark Matter,” Phys. Rev. D 80 (2009) 123511, arXiv:0809.1683 [hep-ph].
- (7) P.-f. Yin, Q. Yuan, J. Liu, J. Zhang, X.-j. Bi, and S.-h. Zhu, “PAMELA data and leptonically decaying dark matter,” Phys. Rev. D 79 (2009) 023512, arXiv:0811.0176 [hep-ph].
- (8) Q. Yuan, X.-J. Bi, G.-M. Chen, Y.-Q. Guo, S.-J. Lin, and X. Zhang, “Implications of the AMS-02 positron fraction in cosmic rays,” Astropart. Phys. 60 (2015) 1–12, arXiv:1304.1482 [astro-ph.HE].
- (9) D. Hooper, P. Blasi, and P. D. Serpico, “Pulsars as the Sources of High Energy Cosmic Ray Positrons,” JCAP 01 (2009) 025, arXiv:0810.1527 [astro-ph].
- (10) H. Yuksel, M. D. Kistler, and T. Stanev, “TeV Gamma Rays from Geminga and the Origin of the GeV Positron Excess,” Phys. Rev. Lett. 103 (2009) 051101, arXiv:0810.2784 [astro-ph].
- (11) P.-F. Yin, Z.-H. Yu, Q. Yuan, and X.-J. Bi, “Pulsar interpretation for the AMS-02 result,” Phys. Rev. D 88 (2013) 023001, arXiv:1304.4128 [astro-ph.HE].
- (12) J. Feng and H.-H. Zhang, “Pulsar interpretation of lepton spectra measured by AMS-02,” Eur. Phys. J. C 76 (2016) 229, arXiv:1504.03312 [hep-ph].
- (13) D. Hooper and T. Linden, “Measuring the Local Diffusion Coefficient with H.E.S.S. Observations of Very High-Energy Electrons,” Phys. Rev. D 98 (2018) 083009, arXiv:1711.07482 [astro-ph.HE].
- (14) I. Cholis, T. Karwal, and M. Kamionkowski, “Features in the Spectrum of Cosmic-Ray Positrons from Pulsars,” Phys. Rev. D 97 (2018) 123011, arXiv:1712.00011 [astro-ph.HE].
- (15) K. Fang, X.-J. Bi, P.-F. Yin, and Q. Yuan, “Two-zone diffusion of electrons and positrons from Geminga explains the positron anomaly,” Astrophys. J. 863 (2018) 30, arXiv:1803.02640 [astro-ph.HE].
- (16) S. Profumo, J. Reynoso-Cordova, N. Kaaz, and M. Silverman, “Lessons from HAWC pulsar wind nebulae observations: The diffusion constant is not a constant; pulsars remain the likeliest sources of the anomalous positron fraction; cosmic rays are trapped for long periods of time in pockets of inefficient diffusion,” Phys. Rev. D 97 (2018) 123008, arXiv:1803.09731 [astro-ph.HE].
- (17) I. Cholis, T. Karwal, and M. Kamionkowski, “Studying the Milky Way pulsar population with cosmic-ray leptons,” Phys. Rev. D 98 (2018) 063008, arXiv:1807.05230 [astro-ph.HE].
- (18) X. Tang and T. Piran, “Positron flux and -ray emission from Geminga pulsar and pulsar wind nebula,” Mon. Not. Roy. Astron. Soc. 484 (2019) 3491–3501, arXiv:1808.02445 [astro-ph.HE].
- (19) S.-Q. Xi, R.-Y. Liu, Z.-Q. Huang, K. Fang, and X.-Y. Wang, “GeV observations of the extended pulsar wind nebulae constrain the pulsar interpretations of the cosmic-ray positron excess,” Astrophys. J. 878 (2019) 104, arXiv:1810.10928 [astro-ph.HE].
- (20) G. Johannesson, T. A. Porter, and I. V. Moskalenko, “Cosmic-Ray Propagation in Light of the Recent Observation of Geminga,” Astrophys. J. 879 (2019) 91, arXiv:1903.05509 [astro-ph.HE].
- (21) M. Di Mauro, S. Manconi, and F. Donato, “Detection of a -ray halo around Geminga with the Fermi -LAT data and implications for the positron flux,” Phys. Rev. D 100 (2019) 123015, arXiv:1903.05647 [astro-ph.HE]. [Erratum: Phys.Rev.D 104, 089903 (2021)].
- (22) K. Fang, X.-J. Bi, and P.-F. Yin, “Reanalyze the pulsar scenario to explain the cosmic positron excess considering the recent developments,” Astrophys. J. 884 (2019) 124–128, arXiv:1906.08542 [astro-ph.HE].
- (23) S. Manconi, M. Di Mauro, and F. Donato, “Contribution of pulsars to cosmic-ray positrons in light of recent observation of inverse-Compton halos,” Phys. Rev. D 102 (2020) 023015, arXiv:2001.09985 [astro-ph.HE].
- (24) S.-H. Wang, K. Fang, X.-J. Bi, and P.-F. Yin, “Test of the superdiffusion model in the interstellar medium around the Geminga pulsar,” Phys. Rev. D 103 (2021) 063035, arXiv:2101.01438 [astro-ph.HE].
- (25) K. Fang and X.-J. Bi, “Interpretation of the puzzling gamma-ray spectrum of the Geminga halo,” Phys. Rev. D 105 (2022) 103007, arXiv:2203.01546 [astro-ph.HE].
- (26) HAWC Collaboration, A. U. Abeysekara et al., “Extended gamma-ray sources around pulsars constrain the origin of the positron flux at Earth,” Science 358 (2017) 911–914, arXiv:1711.06223 [astro-ph.HE].
- (27) LHAASO Collaboration, F. Aharonian et al., “Extended Very-High-Energy Gamma-Ray Emission Surrounding PSR J0622+3749 Observed by LHAASO-KM2A,” Phys. Rev. Lett. 126 (2021) 241103, arXiv:2106.09396 [astro-ph.HE].
- (28) L.-Z. Bao, K. Fang, and X.-J. Bi, “Slow diffusion is necessary to explain the gamma-ray pulsar halos,” arXiv:2107.07395 [astro-ph.HE].
- (29) C. E. Fichtel, R. C. Hartman, D. A. Kniffen, D. J. Thompson, G. F. Bignami, H. Ögelman, M. E. Özel, and T. Tümer, “High-energy gamma-ray results from the second Small Astronomy Satellite.,” Astrophys. J. 198 (1975) 163–182.
- (30) R. N. Manchester, G. B. Hobbs, A. Teoh, and M. Hobbs, “The Australia Telescope National Facility pulsar catalogue,” Astron. J. 129 (2005) 1993, arXiv:astro-ph/0412641.
- (31) J. Faherty, F. Walter, and J. Anderson, “The trigonometric parallax of the neutron star Geminga,” Astrophys. Space Sci. 308 (2007) 225–230.
- (32) A. Crusius and R. Schlickeiser, “Synchrotron radiation in a thermal plasma with large-scale random magnetic fields,” Astron. Astrophys. 196 (1988) 327–337.
- (33) K. Fang, X.-J. Bi, S.-J. Lin, and Q. Yuan, “Klein–Nishina Effect and the Cosmic Ray Electron Spectrum,” Chin. Phys. Lett. 38 (2021) 039801, arXiv:2007.15601 [astro-ph.HE].
- (34) A. N. Kolmogorov, “The local structure of turbulence in incompressible viscous fluid for very large Reynolds numbers,” C. R. Acad. Sci. URSS 30 (1941) 301–305.
- (35) I. V. Moskalenko and A. W. Strong, “Production and propagation of cosmic ray positrons and electrons,” Astrophys. J. 493 (1998) 694–707, arXiv:astro-ph/9710124.
- (36) J. Fang and L. Zhang, “Non-thermal emission from old supernova remnants,” Mon. Not. Roy. Astron. Soc. 384 (2008) 1119, arXiv:0711.4173 [astro-ph].
- (37) R.-Y. Liu, C. Ge, X.-N. Sun, and X.-Y. Wang, “Constraining the Magnetic Field in the TeV Halo of Geminga with X-Ray Observations,” Astrophys. J. 875 (2019) 149, arXiv:1904.11438 [astro-ph.HE].
- (38) F. Feroz, M. P. Hobson, and M. Bridges, “MultiNest: an efficient and robust Bayesian inference tool for cosmology and particle physics,” Mon. Not. Roy. Astron. Soc. 398 (2009) 1601–1614, arXiv:0809.3437 [astro-ph].