The clamped intensity of femtosecond laser pulses varying with gas pressure in the presence of external focusing
Abstract
We perform a theoretical investigation of the clamped laser intensity inside the filament plasma as a function of gas pressure with external focusing. Unlike the clamped intensity under the self-focusing condition, which is independent on the gas pressure, the clamped intensity with external focusing decreases with the gas pressure. Our findings can explain the changes of the signals of femtosecond-laser-induced 391-nm forward emission and fluorescence with the nitrogen gas pressure.
pacs:
Valid PACS appear hereFemtosecond laser pulses propagating in gases with the power larger than a critical power produce self-guided high-intensity plasma filaments marburger1975self ; couairon2007femtosecond ; chin2010femtosecond . Because of a balance between Kerr self-focusing and plasma defocusing, the laser intensity is clamped inside the filaments chin2010femtosecond ; liu2014intensity . The clamped intensity sets an upper limit to the intensity at the self-focus in gases. Once the clamped laser intensity is achieved, it is not only stabilized along the propagation distance, but also almost invariable with the increase of the input laser energy. The intensity clamping is one of the fundamental characteristics of the filamentation phenomenon. It governs the major dynamics of the laser-gas interaction and is a key to understand various physical phenomenon inside the filament, such as tunnel ionization chin2016tunnel , plasma fluorescence becker2001intensity , the cut-off frequency of the high order harmonic spectrum lange1998high . The self-focusing clamped intensity in air is kasparian2000critical .
In many experiments, an external lens is used to force self-focusing within the limit of the length of the medium and the laboratory space. Under external focusing, the intensity clamping still holds but the clamped intensity increases theberge2007self ; kosareva2009can ; xu2012intensity ; liu2010tightly . Bernhardt et al showed that the peak intensities inside filaments were experimentally determined to be about and by using a 20-cm focal-length lens in air and argon, respectively xu2012intensity . With a tighter external focusing (), Liu et al have found that the peak intensity is clamped at a level of by measuring the electron density in air liu2010tightly .
The theoretical analysis showed that the clamped intensity is independent on gas pressure under self-focusing condition chin2010femtosecond . Is this claim also established with external focusing? This article answers the question.
We begin with the balance of the nonlinear index of refraction between Kerr self-focusing and plasma defocusing . is
| (1) |
where is the Kerr nonlinear index of refraction and is the laser intensity. is
| (2) |
where and are the electron density and critical plasma density, respectively. with , , and denoting the vacuum permittivity, the mass of electron, the laser angular frequency and the elementary charge, respectively. For a titanium–sapphire laser with a central wavelength of 800 nm, is . The balance equation reads
| (3) |
is linearly proportional to the neutral gas density with for nitrogen gas borzsonyi2010measurement ; nibbering1997determination . The electron density is also linearly proportional to the neutral gas density . and represent the ionization rate and ionization time. The Eq. 3 can be written as
| (4) |
It can be seen the clamped intensity under self-focusing is unchanged with the gas pressure.
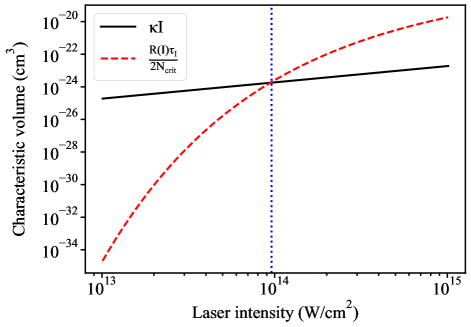
Choosing the gas as nitrogen, the ionization rate is calculated by Ammosov, Delone and Krainov’s (ADK) model ammosov1986tunnel . The lowest three ionic states ), ) and ) with corresponding ionization potentials 15.581, 16.699 and 18.875 eV itikawa2006cross , respectively, are taken into account, as all of them have been observed in femtosecond laser fields gibson1991dynamics . The ionization time is set to be 100 fs which is on the order of the laser pulse duration. We can draw the right-hand side of Eq. 4 as a function of laser intensity as shown in Fig. 1 (dashed red line). The left-hand side of Eq. 4 is easily obtained as shown in Fig. 1 (solid black line). As and have the unit of cubic meter, they are called characteristic volumes here. The abscissa of the intersection of the two curves is the self-focusing clamped intensity. The is in nitrogen for the 800-nm femtosecond laser pulse.
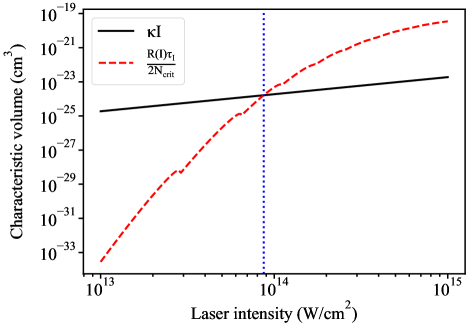
In the range of of 800-nm laser, another model of Perelemov, Popov and Trentev’s (PPT) model is often used to calculate the ionization rate, which fits very well the experimental ion yields perelomov1966ionization ; talebpour1998suppressed ; talebpour1999semi . Figure 2 shows that the self-focusing clamped intensity is in nitrogen with the ionization rate calculated by PPT model. The simulated clamped intensities with the helps of ADK model and PPT model are closed to each other. They are higher than the value of estimated by Kasparian et al in air, because the ionization potential of nitrogen is higher than that of oxygen which accounts for more than 80% of the overall plasma in air kasparian2000critical .
When an external lens is added, the new equilibrium becomes chin2010femtosecond
| (5) |
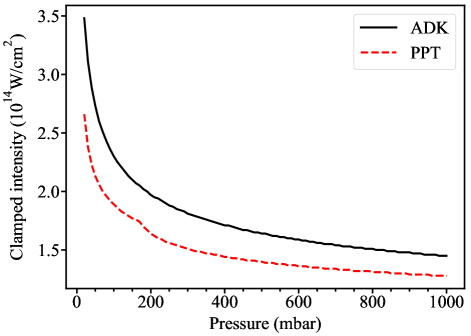
where is the change in the index of refraction generated by the external focusing. Since the ionization rate increases non-linearly with the laser intensity, there exists a larger intensity that makes the left-hand side equals right-hand side in Eq. 5. Hence, the clamped intensity increases with the external focusing. We do not know how to calculate the value of . Previous studies have revealed that it is related to the focal length liu2014intensity ; theberge2007self ; kosareva2009can ; xu2012intensity ; liu2010tightly . In the current case, it is taken as a parameter and is used, where is a coefficient and is the value of with the self-focusing clamped intensity in 1000-mbar nitrogen gas. With the help of Eq. 5, we can explore the clamped intensity as a function of nitrogen pressure (). Figure 3 shows that the simulated decreases with the nitrogen gas pressure from 10 to 1000 mbar. The drops significantly fast at the low pressure range (10-100 mbar) and decreases slowly at high pressures. This feature is due to that the clamped intensity varies inversely with the pressure according to Eq. 5. The clamped intensities are more than with the coefficient by using both ADK and PPT models to calculate the ionization rate. The obtained via ADK model is higher than that obtained via PPT model, because the ionization predicted by ADK model is smaller than that predicted by PPT model for the same laser intensity talebpour1999semi .
Two examples related to the 391-nm transition from to are given here, which can be explained by the simulated results of Fig. 3.
1. The dependence of 391-nm forward emission inside the plasma filaments on nitrogen gas pressure. The 391-nm forward emission was found by Yao et al in 2011 and has attracted a lot of attention yao2011high ; yao2013remote ; yao2016population ; liu2017unexpected ; tikhonchuk2021theory . Figure 4 shows the intensity of the 391-nm forward emission as a function of gas pressure. It first goes up with the pressure increasing from 2 to 10 mbar and then declines in the range of 10–100 mbar. After the pressure exceeds 100 mbar, the 391-nm forward emission disappears. The similar results have been reported previously wang2015population ; mysyrowicz2019lasing . Wang et al and Mysyrowicz et al observed the optimum pressures at 10 mbar and 30 mbar, respectively, by using the convex lenses of the focal length 30 cm and 40 cm wang2015population ; mysyrowicz2019lasing . The 391-nm forward emission is confirmed to be superradiance and/or superfluorescence inside the plasma filaments pumped by 800-nm femtosecond lasers li2014signature ; liu2015recollision ; wang2021superradiance . One of the prerequisites of superradiance and/or superfluorescence is population inversion between the upper and lower energy states dicke1954coherence ; bonifacio1971quantum ; macgillivray1976theory ; polder1979superfluorescence ; bonifacio1975cooperative . By solving the time-dependent Schrödinger equation, Xu et al calculated the population dynamics in the and showed that the population inversion between to is established when the 800-nm laser intensity exceeds xu2015sub . The relative population difference of to varies from 0 to 0.55 corresponding to the 800-nm laser intensity ranging from xu2015sub .
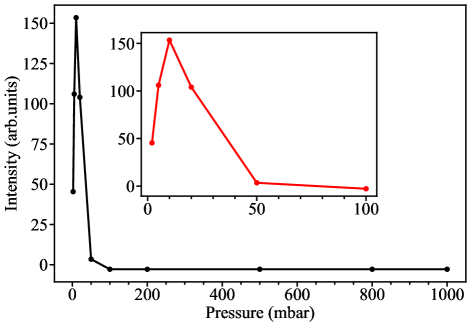
The reduction and disappearance of the 391-nm forward emission can be explained by the decrease of clamped intensity as shown in Fig. 3, which leads to a weaker and weaker inversion level. When the clamped intensity is lower than a certain value, the population inversion can not be achieved and the 391-nm forward emission disappears. The increase of the 391-nm forward emission is due to the increased number of and with the unchanged relative population difference, by assuming that the laser intensities are unchanged in the range of 2-10 mbar and have the same value as the 10 mbar.
2. The dependence of 391-nm side fluorescence inside the plasma filaments on nitrogen gas pressure. As shown in Fig. 5, the fluorescence intensities first increase and then decrease with increasing the gas pressure from 2 to 1000 mbar. The similar behaviour of 391-nm fluorescence emission have been reported wang2015population ; talebpour2001spectroscopy . Unlike the 391-nm forward emission, the fluorescence emission exists in the full range of gas pressure and the optimum pressure shows up around 100 mbar. As is well known, the fluorescence intensity is proportional to the population of the upper level and not related to the lower level. The number of the can be expressed by
| (6) |
with and denoting the ionization rate of and the plasma volume. According to with and being the pule energy and duration, the radius of the filamemt plasma will increase with the gas pressure as the clamped intensity decreases in Fig. 3, By assuming that the plasma length is unchanged, the plasma volume can be written as , where is a coefficient. Substituting into Eq. 6, we get
| (7) |
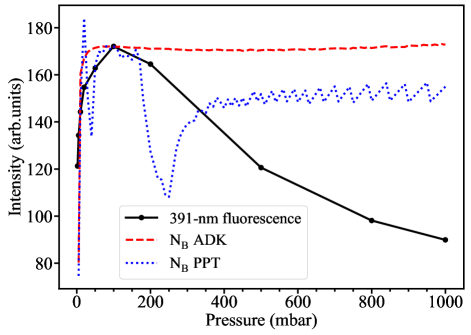
The assumption that the laser intensity in the range of 2–10 mbar has the same value as the 10 mbar is utilized again. By using the clamped intensities in Fig. 3, the population of is calculated based on Eq. 7. Figure 5 shows the simulated as a function of nitrogen gas pressure from 2 to 1000 mbar. The dashed red line is acquired by putting the solid black line in Fig. 3 into Eq. 7 and using the ADK model to calculate the ionization rate of . The dotted blue line is acquired by putting the dashed red line in Fig. 3 into Eq. 7 and using the PPT model to calculate the ionization rate of . The simulated in Fig. 5 is normalized to the fluorescence intensity at 100 mbar. The (dashed red line) induced by ADK model goes up with the gas pressure increasing from 2 to 20 mbar and are almost unchanged in the range of 50–1000 mbar. The (dotted blue line) induced by PPT model has similar tendency with that induced by ADK model, except the irregular oscillations in the 0–400 mbar pressure region. The irregular oscillations are due to the non-smooth ionization rate calculated by PPT model as shown in Fig. 2.
The intensities of 391-nm fluorescence increase at low pressures because of the increased population . The excited-state decay contains radiative (fluorescence) process and non-radiative processes such as collisional quenching. The constant of the rate of quenching by molecules is arnold2012excited ; valk2010measurement ; shakhatov2008kinetics . The non-radiative decay rate caused by the collisional quenching is proportional to the gas pressure and the corresponding non-radiative decay lifetimes from 100 to 1000 mbar are 1.38 to 0.38 ns, which is larger than the fluorescent life time 62 ns valk2010measurement . Hence, the depopulation of through the non-radiative decay is intenser and intenser with the pressure increasing and the fluorescence intensities decrease in the range of 100-1000 mbar as shown in Fig. 5.
To conclude, the clamped intensity inside the filament plasma as a function of gas pressure is theoretically investigated. With the external focusing, the clamped intensities decrease as the gas pressure increases. The variation of 391-nm forward emission and side fluorescence of with gas pressure are explained with the help of our findings. We hope it can be used as a fundamental characteristic of filament plasma to understand more relevant phenomena.
This work was supported by the National Natural Science Foundation of China (Grants No. U1932133, No. 11905089, and No. 12004147).
Q. Wang and Y. Zhang contributed equally to this work.
References
- (1) J. H. Marburger, Prog. Quant. Electron. 4, 35 (1975).
- (2) A. Couairon and A. Mysyrowicz, Phys. Rep. 441, 47 (2007).
- (3) S. L. Chin, Femtosecond laser filamentation, Vol. 55 (Springer, New York, 2010).
- (4) W. W. Liu, Chin. J. Phys. 52, 465 (2014).
- (5) S. L. Chin and H. Xu, J. Phys. B: At. Mol. Opt. Phys. 49, 222003 (2016).
- (6) A. Becker, N. Ak¨ozbek, K. Vijayalakshmi, E. Oral, C. M. Bowden, and S. L. Chin, Appl. Phys. B 73, 287 (2001).
- (7) H. R. Lange, A. Chiron, J. F. Ripoche, A. Mysyrowicz, P. Breger, and P. Agostini, Phys. Rev. Lett. 81, 1611 (1998).
- (8) J. Kasparian, R. Sauerbrey, and S. L. Chin, Appl. Phys. B 71, 877 (2000).
- (9) F. Théberge, J. Filion, N. Aközbek, Y. Chen, A. Becker, and S. L. Chin, Appl. Phys. B 87, 207 (2007).
- (10) O. G. Kosareva, W. Liu, N. A. Panov, J. Bernhardt, Z. Ji, M. Sharifi, R. Li, Z. Xu, J. Liu, Z. Wang, J. Ju, X. Lu, Y. Jiang, Y. Leng, X. Liang, V. P. Kandidova, and S. L. Chin, Laser Phys. 19, 1776 (2009).
- (11) S. Xu, J. Bernhardt, M. Sharifi, W. Liu, and S. L. Chin, Laser Phys. 22, 195 (2012).
- (12) X. L. Liu, X. Lu, X. Liu, T. T. Xi, F. Liu, J. L. Ma, and J. Zhang, Opt. Express 18, 26007 (2010).
- (13) Á. Börzsönyi, Z. Heiner, A. P. Kovács, M. P. Kalashnikov, and K. Osvay, Opt. Express 18, 25847 (2010).
- (14) E. T. J. Nibbering, G. Grillon, M. A. Franco, B. S. Prade, and A. Mysyrowicz, J. Opt. Soc. Am. B 14, 650 (1997).
- (15) M. V. Ammosov, N. B. Delone, and V. P. Krainov, Sov. Phys. JETP 64, 1191 (1986).
- (16) Y. Itikawa, J. Phys. Chem. Ref. Data 35, 31 (2006).
- (17) G. N. Gibson, R. R. Freeman, and T. J. McIlrath, Phys. Rev. Lett. 67, 1230 (1991).
- (18) A. M. Perelomov, V. S. Popov, and M. V. Terent’Ev, Sov. Phys. JETP 23, 924 (1966).
- (19) A. Talebpour, S. Larochelle, and S. L. Chin, J. Phys. B: At. Mol. Opt. Phys. 31, L49 (1998).
- (20) A. Talebpour, J. Yang, and S. L. Chin, Opt. Commun. 163, 29 (1999).
- (21) J. Yao, B. Zeng, H. Xu, G. Li, W. Chu, J. Ni, H. Zhang, S. L. Chin, Y. Cheng, and Z. Xu, Phys. Rev. A 84, 051802(R) (2011).
- (22) J. Yao, G. Li, C. Jing, B. Zeng, W. Chu, J. Ni, H. Zhang, H. Xie, C. Zhang, H. Li, H. Xu, S. L. Chin, Y. Cheng, and Z. Xu, New J. Phys. 15, 023046 (2013).
- (23) J. Yao, S. Jiang, W. Chu, B. Zeng, C. Wu, R. Lu, Z. Li, H. Xie, G. Li, C. Yu, Z. Wang, H. Jiang, Q. Gong, and Y. Cheng, Phys. Rev. Lett. 116, 143007 (2016).
- (24) Y. Liu, P. Ding, N. Ibrakovic, S. Bengtsson, S. Chen, R. Danylo, E. R. Simpson, E. W. Larsen, X. Zhang, Z. Fan, A. Houard, J. Mauritsson, A. L’Huillier, C. L. Arnold, S. Zhuang, V. Tikhonchuk, and A. Mysyrowicz, Phys. Rev. Lett. 119, 203205 (2017).
- (25) V. T. Tikhonchuk, Y. Liu, R. Danylo, A. Houard, and A. Mysyrowicz, New J. Phys. 23, 023035 (2021).
- (26) P. Wang, C. Wu, M. Lei, B. Dai, H. Yang, H. Jiang, and Q. Gong, Phys. Rev. A 92, 063412 (2015).
- (27) A. Mysyrowicz, R. Danylo, A. Houard, V. Tikhonchuk, X. Zhang, Z. Fan, Q. Liang, S. Zhuang, L. Yuan, and Y. Liu, APL Photonics 4, 110807 (2019).
- (28) G. Li, C. Jing, B. Zeng, H. Xie, J. Yao, W. Chu, J. Ni, H. Zhang, H. Xu, Y. Cheng, and Z. Xu, Phys. Rev. A 89, 033833 (2014).
- (29) Y. Liu, P. Ding, G. Lambert, A. Houard, V. Tikhonchuk, and A. Mysyrowicz, Phys. Rev. Lett. 115, 133203 (2015).
- (30) Q. Wang, P. Ding, S. G. Wilkins, M. AthanasakisKaklamanakis, Y. Zhang, Z. Liu, and B. Hu, arXiv:2105.00675 (2021).
- (31) R. H. Dicke, Phys. Rev. 93, 99 (1954).
- (32) R. Bonifacio, P. Schwendimann, and F. Haake, Phys. Rev. A 4, 302 (1971).
- (33) J. C. MacGillivray and M. Feld, Phys. Rev. A 14, 1169 (1976).
- (34) D. Polder, M. Schuurmans, and Q. Vrehen, Phys. Rev. A 19, 1192 (1979).
- (35) R. Bonifacio and L. Lugiato, Phys. Rev. A 11, 1507 (1975).
- (36) H. Xu, E. Lötstedt, A. Iwasaki, and K. Yamanouchi, Nat. Commun. 6, 8347 (2015).
- (37) A. Talebpour, M. Abdel Fattah, S. L. Chin, and A. D. Bandrauk, Laser Phys. 11, 68 (2001).
- (38) B. R. Arnold, S. D. Roberson, and P. M. Pellegrino, Chem. Phys. 405, 9 (2012).
- (39) F. Valk, M. Aints, P. Paris, T. Plank, J. Maksimov, and A. Tamm, J. Phys. D Appl. Phys. 43, 385202 (2010).
- (40) V. A. Shakhatov and Y. A. Lebedev, High Energy Chem. 42, 170 (2008).