A fiber Fabry-Perot cavity based spectroscopic gas sensor
Abstract
Optical spectroscopic sensors are powerful tools for analysing gas mixtures in industrial and scientific applications. Whilst highly sensitive spectrometers tend to have a large footprint, miniaturized optical devices usually lack sensitivity or wideband spectroscopic coverage. By employing a widely tunable, passively stable fiber Fabry-Perot cavity (FFPC), we demonstrate an absorption spectroscopic device that continuously samples over several tens of terahertz. Both broadband scans using cavity mode width spectroscopy to identify the spectral fingerprints of analytes and a fast, low-noise scan method for single absorption features to determine concentrations are exemplary demonstrated for the oxygen A-band. The novel scan method uses an injected modulation signal in a Pound-Drever-Hall feedback loop together with a lock-in measurement to reject noise at other frequencies. The FFPC-based approach provides a directly fiber coupled, extremely miniaturized, light-weight and robust platform for analyzing small analyte volumes that can straightforwardly be extended to sensing at different wavelength ranges, liquid analytes and other spectroscopic techniques with only little adjustments of the device platform.
I Introduction
Optical absorption spectroscopy is a key tool for analysing the chemical composition of matter since the early days of optics wollaston1802xii ; fraunhofer1817bestimmung ; kirchhoff1860fraunhofer . Its sensitivity depends on the optical depth of the analyte, which can be strongly enhanced by enclosing it in an optical cavity. Cavity enhanced absorption spectroscopy using cavity ring-downs zalicki1995cavity ; berden2000cavity , mode width cygan2013cavity , or more elaborate techniques like noise-immune cavity-enhanced optical heterodyne molecular spectroscopy (NICE-OHMS) foltynowicz2008noise have found applications in many fields of research, in particular in gas spectroscopy foltynowicz2008noise , in analysing atmosphere brown2003absorption and chemical compositions nitkowski2008cavity ; chen2016ultra ; singh2019chemical , or in medical diagnosis wojtas2015application . Whilst conventional macroscopic Fabry-Perot cavities can be used to reach extreme sensitivity (analyte absorption coefficients of berden2000cavity ), their susceptibility to ambient disturbance and their meter-scale size limits them to laboratory-based setups and requires large analyte volumes. This restricts their applicability under harsh external conditions or where a small-footprint device is required, like in aerospace technology or for highly integrated, low-maintenance industrial devices. Miniaturized resonator geometries on the other hand overcome these limitations, but usually face a trade-off between sensitivity and spectral coverage.
High finesse fiber Fabry-Perot cavities (FFPCs) hunger2010fiber ; pfeifer2022achievements have evolved as a miniaturized optical cavity platform within the last decade and have been used within numerous different experiments from interfacing single quantum emitters steiner2013single ; gallego2018strong ; albrecht2014narrow ; toninelli2010scanning ; besga2015polariton , to mechanical resonators flowers2012fiber or for various sensing tasks mader2015scanning ; petrak2014purcell ; wagner2018direct ; mader2022quantitative . They merge the advantages of Fabry-Perot cavities, an open mode volume and tunability of the cavity resonance, with the benefits of miniaturized resonators, a high level of integration, strong field-concentration and a small footprint. Although the smaller cavity length of FFPCs (mm-length record size ott2016millimeter ) impairs the reachable sensitivity in theses systems, the ability to produce high finesse resonators (, rochau2021dynamical ) partly compensates this drawback. This, together with their high level of miniaturization, the direct fiber integration and the large tunability, makes FFPCs superior to many competing platforms.
In this article, we demonstrate gas sensing and spectroscopy of diatomic oxygen with a high finesse FFPC. We use the oxygen A-Band (about to ) to show the broadband performance of our devices that can resolve spectral fingerprints of molecules with a spectral resolution only limited by the employed laser source linewidth in a continuously sampled spectrum. Spectroscopy of oxygen absorption bands finds applications for example in the analysis of the structure and composition of earth’s or even Mars’ atmosphere mlynczak2001simultaneous ; mlynczak2007sounding ; guslyakova2014o2 . The operation range of our devices can be adjusted by using different cavity mirror coatings, for example into the near to mid infrared, to resolve the vibrational spectrum of atmospheric gases. We furthermore showcase a continuous, low-noise, high-speed scanning technique, which makes use of a modulation signal fed in a Pound-Drever-Hall (PDH) feedback loop. By using stable, tunable, high finesse FFPC, we demonstrate a miniaturized yet broadband and tunable spectroscopy device with high sensitivity and direct fiber coupling.
II Stable and tunable fiber cavity device
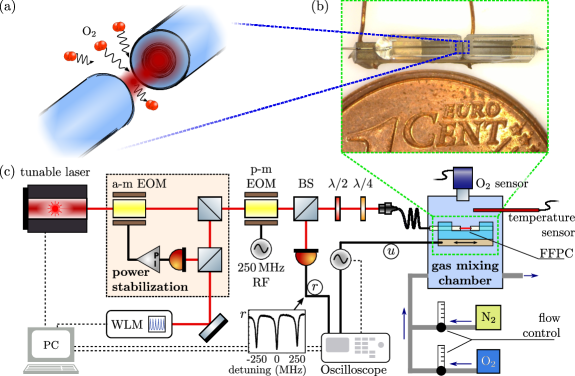
The employed cavity design makes use of a recently introduced robust FFPC realization saavedra2021tunable . It combines rigid, symmetric fiber Fabry-Perot cavities inside glass ferrules gallego2016high with structural cuts and a piezo-electrical tuning element. Thereby, tuning over more than one free spectral range of the Fabry-Perot resonator is achieved. This FFPC design both features high tunability and passive frequency stability against ambient noise. The particular FFPC used in this article is shown in Fig. 1 (b). The two fiber mirrors (transmissivity: , mirror losses , high reflectivity range: ) are separated by about constituting an FFPC with a base finesse at (FWHM mode width: ). Longer cavities, still with high finesse, are in principle possible for optimized mirror diameters and radii of curvature of the fiber mirrors, here: .
The accessibility of the open mode volume of the FFPC allows to freely introduce different gas mixtures. In the presented experiment, we place the FFPC device inside a gas mixing chamber, where the concentration of oxygen at room temperature and ambient pressure is controlled by the flux rates of oxygen and nitrogen into the mixing chamber volume (see Fig. 1 (c)). For reference, the oxygen concentration in the chamber is monitored by an electrochemical oxygen sensor111Go Direct®O2 Gas (GDX-O2) from Vernier™ and the inside temperature is measured to maintain reproducible experiment conditions.
The FFPC system is used together with a widely tunable () diode laser222Lion Series ECDL from Sacher Lasertechnik (laser linewidth within ) with an additional power stabilization and wavelength readout333Wavelength Meter WS7-60 from HighFinesse as shown in Fig. 1 (c). A phase-modulating electro-optical modulator (EOM) is incorporated after the laser power stabilization to add sidebands spaced by . They are either used to increase the number of probed frequencies in a single cavity scan in the cavity mode width spectroscopy or for generating the error signal in the PDH-lockdrever1983laser of the PDH modulation spectroscopy.
We monitor the reflection signal from the FFPC, while the cavity resonance is scanned over the laser using the attached piezo (drive signal ). The reflection signal is split from the incident laser beam using a non polarizing beam splitter (90/10). A combination of a half and quarter wave plate is used to couple light to one polarization mode of the cavity. The observed signal features three reflection dips at the EOM sideband spacing () from which the cavity mode width is extracted (FWHM empty cavity mode width ).
III Oxygen absorption spectroscopy
We test our spectroscopic sensor using the well-known oxygen A-band foltynowicz2008noise ; greenblatt1990absorption ; drouin2017multispectrum ; van2004measurement ; drouin2013high that shows characteristic absorption features in the range from 444All simulated spectrum data in this article is obtained using the web-based tool SpectraPlot: https://www.spectraplot.com/ goldenstein2017spectraplot , which makes use of NIST’s HITRAN databaserothman2013hitran2012 .. The A-band manifold of vibration assisted transitions consists of absorption features with a collision- and Doppler-broadened FWHM linewidth of few GHz and maximum absorption coefficients of up to . Our results can however be transferred to other species and wavelength ranges for adjusted mirror coating parameters. To characterize the sensitivity of our device, we use the resolvable analyte absorption coefficient. In principle, the device can be used to investigate any other loss process caused by the analyte medium.
III.1 Cavity mode width spectroscopy
Cavity mode width spectroscopycygan2013cavity (CMWS) is a spectroscopy technique that uses the change of the linewidth of an optical resonator mode to determine the absorbance of a medium inside. For this, we express the finesse of the Fabry-Perot resonator in terms of the resonator round-trip losses , where , , are the transmission, absorption and clipping losses of the -th mirror and are the losses caused by the medium inside upon a single transmission. The cavity mode width directly relates to the finesse via the free spectral range of the cavity through with , where is the speed of light and is the cavity length. We obtain by measuring the cavity length and is measured by scanning the cavity length such that successively the two sidebands and the main laser tone come into resonance with the cavity mode. The spacing of the laser tones is thereby used as a frequency meter for translating the measured resonance width into saavedra2021tunable . of the FFPC is known from measuring with a cavity without absorbing medium, either by using an inert species inside or by measuring off-resonant to the absorption lines of oxygen. As the expected amount of absorption is on the order of parts per million, we linearly approximate Beer-Lambert’s law such that , where is the absorption coefficient of the medium. Knowing and the sum of mirror losses, can therefore be obtained directly by measuring . This basic CMWS scheme is also depicted in Fig. 2 (a). Neglecting the effects of collision induced absorption (effects \ceO2-\ceO2 versus \ceO2-\ceN2 collisions greenblatt1990absorption ; newnham1998visible ), the absorption coefficient is expected to be linearly dependent on the oxygen concentration at ambient conditions (room temperature and ). The expected change of the optical mode-width correspondingly reads
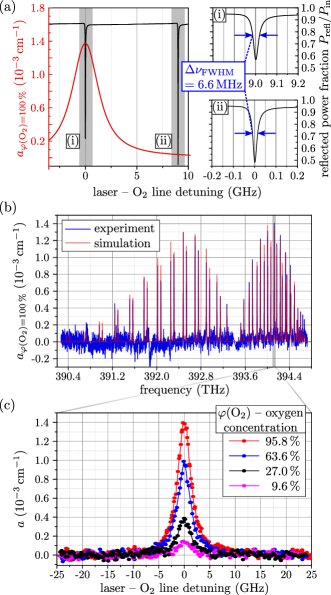
To determine the absorption coefficient at a given point in the spectrum, we set our laser to a specific investigation wavelength . We then tune the cavity resonance over the laser tone such that subsequently the first EOM-modulated sideband, the main laser tone, and the second sideband are getting into resonance. During the scan, the measured reflection signal features a train of three cavity dips (see inset of Fig. 1) with a Lorentzian plus dispersive shapegallego2016high ; bick2016role . The mode widths of the dips are extracted from fitting the measured lineshapes, yielding measurements at and . The average mode width and standard deviation are obtained by tuning the cavity twenty times over the laser tones at each . To measure the spectrum of an oxygen absorption line, is step-wise scanned over the feature with measurements between each step. Arbitrarily fine spaced with spectral information down to the line width of the laser are in principle possible at the cost of long measurement times. For wide spectral measurements like a molecular fingerprint a coarser spacing is used.
Using the described technique, we measured the full oxygen A-band between to as shown in Fig. 2 (b). To optimize the resolution and required measurement time, the spacing of frequencies in the recorded spectrum between the center laser tones is swept. At the high frequency end of the broad spectrum the spacing is and at the low frequency end . The acquisition of the full spectrum with twenty scans per investigated spectrum point was performed within approximately three hours. Faster acquisition of the spectrum either comes at the cost of less statistical information per spectrum point or less sampling density, as faster scanning of the cavity resonance has to be avoided to stay in the steady cavity field regime (for details see supplementary material part A). Since the optical properties of the coating slightly vary within the full spectrum range, the baseline mode width was measured and adjusted accordingly in the evaluation of the cavity spectra. The measured A-band lines are in good agreement with the expected spectrum within the expected absolute calibration error of the utilized wavelength meter ().
As the cavity resonance frequency is continuously tunable, the measurement resolution is only limited by the linewidth of the available laser source. This allows a high density sampling of individual absorption lines as shown in Fig. 2 (c). At ambient conditions the absorption coefficient at the oxygen A-band lines is to very good approximation linear with the concentration of oxygengreenblatt1990absorption ; newnham1998visible . Therefore, the FFPC-device can also be used as a concentration sensor. The low concentration limit of this sensor is given by the accuracy of the mode width measurement. For CMWS, this accuracy is determined by the cavity frequency noise resulting from the integration of the noise spectrum over frequencies present in a cavity scan saavedra2021tunable (see supplementary material part B). For the scan parameters used here, the inaccuracy amounts to corresponding to or minimum oxygen concentration. This could potentially be reduced by improving the cavity frequency stability e.g. by a more stable FFPC designsaavedra2021tunable . Faster cavity scans that limit the influence of low frequency noise would not be suitable as they would not yield a steady state intra-cavity field (see supplementary material part A). Whilst CMWS in general is a straightforward measurement technique, it has a rather high sensitivity limit. It can be improved by using longer FFPCs, lower absorption mirror coatings or by changing to other operation modes like cavity ring-down spectroscopy berden2000cavity ; zalicki1995cavity (CRDS), phase-shift CRDS engeln1996phase ; cheema2012simultaneous , cavity-enhanced frequency-modulation spectroscopy ye1998ultrasensitive ; ma1999ultrasensitive or the closely related noise-immune cavity-enhanced optical heterodyne molecular spectroscopy (NICE-OHMS) foltynowicz2008noise ; gianfrani1999cavity .
III.2 PDH modulation spectroscopy
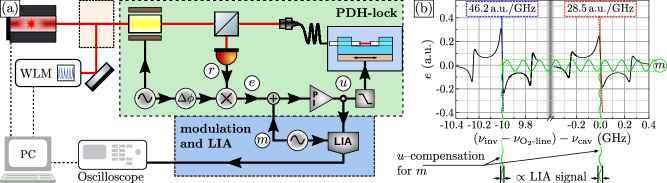
Commonly used techniques like NICE-OHMS use a simultaneous excitation of cavity resonances by EOM-modulated sidebands of the laser. In the case of our long cavity, this would require the generation of sidebands at several THz spacing. It is thus only applicable for longer FFPC realizations (e.g. with mm-long cavities ott2016millimeter or hollow core fiber-based cavity geometries flannery2018fabry ). Nevertheless, one can use the interference signal of sidebands with less spacing to increase the sensitivity of the FFPC-enhanced spectroscopy. For this, we utilize the PDH error signal drever1983laser ; black2001introduction that is used to lock the cavity to the laser source. By inserting an additional modulation signal in the locked-cavity PDH-feedback loop, we measure the slope of the PDH error signal that is directly connected to the intra-cavity losses, thus coining this scheme PDH modulation spectroscopy (PDH-MS). The benefits of this method are a reduced noise background and a considerable increase of the measurement rate. A schematic of the measurement setup is shown in Fig. 3. Here, we choose to add a modulation signal to the measured error signal before the PI-controller featuring a proportional (P) and integrator (I) control system part. The frequency of is below the feedback bandwidth of the system, thus the controller will act on the cavity system to actuate it such that the un-modulated error signal compensates for resulting in . This requires a modulation of the driving signal of the cavity piezo at the modulation frequency with a magnitude depending on the slope of . To extract this frequency component of and thereby , with the drive detuning from the cavity resonance, we use a lock-in amplifier (LIA)555LIA-MV-200-H from FEMTO Messtechnik GmbH. The LIA extracts and amplifies the component of at the modulation frequency. The cavity is thereby in a state locked to the laser and the output voltage of the LIA is proportional to . If the laser is scanned over an absorption line of oxygen, the cavity linewidth and mode matching change, resulting in a changed that can directly be read off the signal from the LIA. For a full mathematical treatment of the dependence of the measured signal on the cavity mode width and the impedance matching of the cavity see supplementary material part C.
There are several possible options for setting up the modulation signal and readout within the feedback loop or by modulating the laser frequency. The particular choice mostly depends on the targeted modulation frequency. For example, for a modulation with a frequency larger than the feedback bandwidth of the PI-controller, but lower than the bandwidth of the piezo-element, can be added onto and then be read-off directly on . The modulation signal should be chosen to fit in a low-noise area of the frequency-noise spectrum of the locked cavity saavedra2021tunable thereby minimizing the measurement noise of the PDH-MS. In the presented scheme (see Fig. 3), a modulation frequency of below the PI-controller feedback bandwidth was used with an amplitude corresponding to well within the center linear slope part of the PDH error signal.
As the FFPC is tunable by more than one free spectral range, this measurement technique can be used for continuous, wide range frequency scans, provided the utilized laser source runs mode-hop free within the scan. Scanning a single absorption line of oxygen as shown in Fig. 4 (a) was performed within compared to for the shown high-sampling rate line scans using CMWS, dramatically reducing the measurement time. The required scan time for a fixed frequency range using PDH-MS is determined by the laser scan speed, here: , and the LIA integrator setting, here: integration time. The LIA integrator thereby sets the amount of averaging and has to be adjusted to be significantly below the time required for scanning the absorption feature and larger than several periods of the modulation signal frequency. Although it was not set up within the presented experiment, higher modulation frequencies can be beneficial in terms of the required scan time as well as for minimizing the measurement noise, if a low noise part of the frequency noise spectrum of the FFPC is picked. The advantage to use a sinusoidal signal for scanning the laser frequency is to avoid coupling higher frequency components of more complex signals to the mechanical modes of the resonator, which can result in locking instability (for example for triangular shapes).
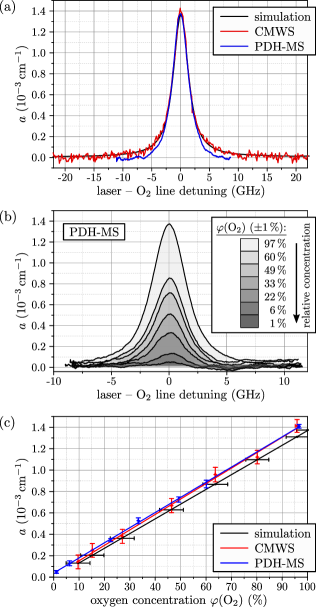
Due to the single frequency readout of the LIA, the frequency noise of the cavity that otherwise affects the mode width measurement in the CMWS is strongly suppressed. The resulting resolvable absorption coefficient is reduced to compared to for CMWS, also visible in the reduced noise of the PDH-MS signal in Fig. 4 (a). It can therefore be used to resolve lower concentrations down to as shown in Fig. 4 (b). More noise suppression for even higher sensitivity is possible for other insertion point schemes of the modulation signal and higher modulation frequencies as the cavity frequency noise in general decays for higher frequencies saavedra2021tunable .
IV Conclusion
In this article, we presented a fiber-based, miniaturized Fabry-Perot cavity that is used as a spectroscopy sensor for high resolution spectroscopy of the oxygen A-band as well as for measuring the concentration of oxygen down to one percent accuracy. The continuous, large tuning range of the cavity enables to record absorption spectra over tens of nanometers with a spectral resolution only limited by the linewidth of the employed light source. It can therefore serve to resolve spectral fingerprints of gases and at the same time be used to measure their concentration. Due to the miniaturized, light-weight and robust FFPC realization, it is suited for operation under demanding conditions like in aerospace or industry applications, where small analyte volumes have to be investigated. We furthermore demonstrated a low-noise technique for cavity enhanced absorption spectroscopy that features continuous fast scanning of the spectrum with improved sensitivity. It is especially suited for miniaturized cavities due to their large free spectral range that prohibits other high sensitivity techniques like NICE-OHMS gianfrani1999cavity .
There are numerous possible extensions and improvements to our proof-of-principle demonstration. FFPCs with adjusted coating parameters for longer wavelength operation can be directly used as miniaturized sensors for atmospheric trace gases. Higher sensitivity can be reached by longer FFPCs ott2016millimeter or modified open cavity geometries with longer resonator length flannery2018fabry . This will also enable the use of other established techniques like NICE-OHMS or different CRDS measurment schemes. Furthermore, alternatives like facilitating ring-downs introduced by a fast scanned cavity bresteau2017saturation or thermal nonlinearities in the cavity may be employed, (see supplementary material parts A and D). These other techniques or modified versions of the demonstrated PDH modulation spectroscopy can further increase the sensitivity of the devices. As FFPCs easily operate in the fast cavity regime, they can also serve as a platform for photoacoustic spectroscopy west1983photoacoustic ; wang2017fiber . Finally, other areas of application are expected to open, if the FFPC are not used for investigating gaseous but liquid media. There are no limitations that exclude their combination with liquids, where they could serve as highly sensitive measurement tools for e.g. biological markers like dyes or as recently demonstrated for tracking nanoparticles kohler2021tracking .
Acknowledgements.
The authors thank Ryan M Briggs from Jet Propulsion Lab for the initial motivation of this project. The authors acknowledge funding by the Bundesministerium für Bildung und Forschung (BMBF) – project: FaResQ, and funding by the Deutsche Forschungsgemeinschaft (DFG, German Research Foundation) under Germany’s Excellence Strategy – Cluster of Excellence Matter and Light for Quantum Computing (ML4Q) EXC 2004/1 – 390534769. During the project course, C.S. was supported by a national scholarship from CONACYT, México. This work was supported by the Open Access Publication Fund of the University of Bonn.Supplementary materials
Supplementary material part A Swept cavity ring-down for fast scanned cavities
To measure the cavity mode width, we scan the cavity length at a fixed laser wavelength. Sidebands at created by an electrooptic modulator are used as frequency markers to calibrate the scan. For consistent measurements of the cavity mode width, the intracavity field has to be in a steady state with the excitation laser. This is achieved, if the cavity is scanned in a quasistatic way, meaning that the time required for scanning over the resonance is much bigger than the rate at which the cavity is coupled to the environment: . Here, we reach this regime, when the scan speed is maintained at a few THz/s. Figure A.5 shows the influence of the scan speed on the measured trace. If faster scans are used, the reflected light and the cavity field interfere and a ringing is observed as light is still leaking out of the cavity, while the laser is already off-resonant. The ringing has an exponential envelope connected to the cavity decay and a slight chirp as the cavity field is frequency shifted by the Doppler effect from the moving mirrors. The raised/ lowered energy of the photons thereby corresponds to the work done/ extracted by the moving mirrors being displaced against the light field’s radiation pressure.
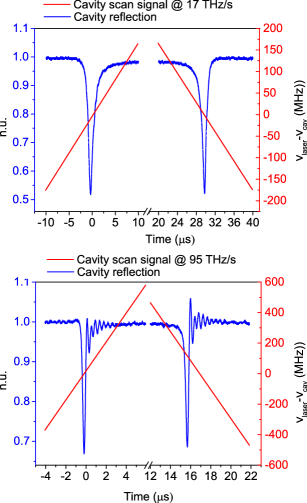
Whilst the ringing effect limits the maximum scan speed for the data acquisition in the cavity modewidth spectroscopy (CMWS), it can itself be a valuable resource as an own characterization method for the cavity mode width. For this, one can either use a model as described in bresteau2017saturation or simulate the cavity reflection for a swept pump. The cavity field can for example be numerically computed using its equation of motion. In a frame rotating at the excitation laser frequency, this can be written as
where is the scan speed of the cavity (in ( THz)/s), is the full cavity energy decay rate and the coupling rate to the excitation field . The time steps for a numerical evaluation have to be chosen to lead to a convergent behavior, still reflecting the fast scan process compared to the the energy decay of the cavity. Exact fitting to this model is however complicated by the detuning dependent mode matching coupling to fiber-cladding modes in case of fiber Fabry-Perot cavities gallego2016high ; bick2016role .
Supplementary material part B Averaging and error for CMWS measurement
The error and low concentration measurement limit of our CMWS measurements is caused by fluctuations in the cavity mode width measurement. To yield the data of the main manuscript 20 mode width measurements per frequency point were taken. The reported absorption coefficient for each frequency point corresponds to the statistic average of these measurements. The fluctuation of the measured mode width causes the uncertainty and lowest detectable amount of absorption. An exemplary set of data (here with only 12 measurements per point) is shown in Fig. B.6 (a).
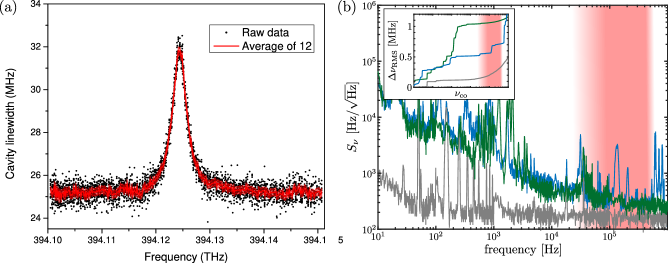
The fluctuations that limit the measurement accuracy are mostly caused by frequency noise of the cavity resonance from thermally excited high frequency mechanical resonances of the system within the red shaded area in Fig. B.6 (b)saavedra2021tunable – the exact contributions of each frequency can be determined by a Fourier transform of the measured signal. Lower frequency noise does not contribute within the scan time and noise at higher frequency is filtered by a low pass filter before the oscilloscope. The performance of FFPCs for CMWS measurements can potentially be strongly improved by FFPC designs that avoid mechanical resonances in the relevant frequency range.
Supplementary material part C The influence of mode width and impedance matching in PDH modulation spectroscopy
Due to the absorption of light within the cavity, both the cavity mode width and impedance matching are changed affecting both Lorentzian width and depth of the reflection signal . This changes the Pound-Drever-Hall (PDH) error signal that depends on the cavity reflection signal via black2001introduction
| (1) |
where the detuning is given by ( being the laser frequency, the cavity resonance frequency and the cavity’s free spectral range). is the modulation frequency of the employed electrooptic modulator (EOM) – being the cavity finesse. The proportionality constant is given by the product of the gain of the photodetector (V/W) times the amplitude of the modulated sidebands and the cavity pump power black2001introduction , where denotes the Bessel function and the modulation constant for the EOM. We find that while locked at the cavity resonance, the inverse of the slope of at is proportional to the absorption coefficient of the absorption species within the cavity. As in gallegoThesis ; gallego2016high , we write the complex reflectivity as
Here, , and denote the mode overlap of fiber and cavity, and fiber and reflected mode respectively. is the complex leakage ratio function of the FFPC. For sufficiently small cavity detuning (), the reflectivity of the modulated sidebands can be approximated as . Using this, the measured error signal near resonance is
| (2) |
and the FFPC complex leakage ratio function can be expressed as
thereby denotes the cavity length, the absorption coefficient of the intracavity medium, and the mirrors’ dielectric transmissivity and reflectivity for the electric field. The overlap integrals and expressed for small cavity detuning are gallego2016high
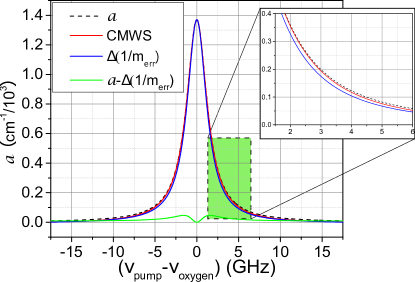
Here, is the fiber mode field radius ( for SM fiber), is the cavity mode waist at mirror interface with radius of curvature (, and the speed of light in vacuum. Both mirrors are assumed identical here. Their reflection coefficient (usually expressed in ppm) is given by the modulus square of the dielectric reflectivity , is the corresponding power transmissivity and the mirror losses. Equation 2 is plotted in the main text in Fig. 3 (b). Considering that the absorption losses due to the oxygen presence are much smaller than the mirror losses per round trip, we can extract the slope of the error function , which is proportional to the absorption coefficient
| (3) |
Here, defines the real and imaginary parts respectively and and . Finally, we obtain for the relative difference with respect to the absence of an absorbing gas species (here )
| (4) |
where is a proportionality constant extracted from Eq. 3. Equation 4 is plotted using the measured cavity geometry and optical parameters, as well as the absorption coefficient from SpectraPlotgoldenstein2017spectraplot ; spectraplot in Fig. C.7 to show the equivalence of this technique and mode with spectroscopy. However, due to the effect of the changing impedance matching of the FFPC a slight deviation from the CMWS technique is expected on the wings of the absorption lines.
Supplementary material part D Thermal nonlinearities in high power cavity scans
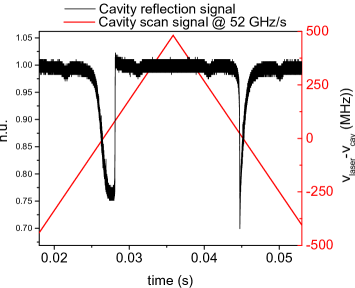
Nonlinear thermal effects brachmann2016photothermal occur when the cavity resonance is scanned using a higher power laser input (e.g. some hundred compared to few tens of under normal operation) and slow – in the time scale of thermal effects – scan speeds. They are caused by an expansion of the fiber mirror material as a consequence of absorbed intracavity photons and manifest in a broadening and narrowing (see Fig. D.8) of the scanned line together with a deformation of the Lorentzian lineshape depending on the scan direction. For very high powers, a bistable regime of the cavity is reached carmon2004dynamical . The deformed lineshape prohibits a correct cavity linewidth analysis and therefore can not be used for CMWS. It can however be avoided by using not too slow scan speeds below the swept cavity rings discussed in part A.
References
- (1) W. H. Wollaston, “XII. A method of examining refractive and dispersive powers, by prismatic reflection,” Philosophical Transactions of the Royal Society of London, no. 92, pp. 365–380, 1802.
- (2) J. Fraunhofer, “Bestimmung des Brechungs-und des Farbenzerstreungs-Vermögens verschiedener Glasarten, in Bezug auf die Vervollkommnung achromatischer Fernröhre,” Annalen der Physik, vol. 56, no. 7, pp. 264–313, 1817.
- (3) G. Kirchhoff, “Über die Fraunhofer’schen Linien,” Annalen der Physik, vol. 185, no. 1, pp. 148–150, 1860.
- (4) P. Zalicki and R. N. Zare, “Cavity ring-down spectroscopy for quantitative absorption measurements,” The Journal of chemical physics, vol. 102, no. 7, pp. 2708–2717, 1995.
- (5) G. Berden, R. Peeters, and G. Meijer, “Cavity ring-down spectroscopy: Experimental schemes and applications,” International reviews in physical chemistry, vol. 19, no. 4, pp. 565–607, 2000.
- (6) A. Cygan, D. Lisak, P. Morzyński, M. Bober, M. Zawada, E. Pazderski, and R. Ciuryło, “Cavity mode-width spectroscopy with widely tunable ultra narrow laser,” Optics Express, vol. 21, no. 24, pp. 29 744–29 754, 2013.
- (7) A. Foltynowicz, F. M. Schmidt, W. Ma, and O. Axner, “Noise-immune cavity-enhanced optical heterodyne molecular spectroscopy: Current status and future potential,” Applied Physics B, vol. 92, no. 3, pp. 313–326, 2008.
- (8) S. S. Brown, “Absorption spectroscopy in high-finesse cavities for atmospheric studies,” Chemical reviews, vol. 103, no. 12, pp. 5219–5238, 2003.
- (9) A. Nitkowski, L. Chen, and M. Lipson, “Cavity-enhanced on-chip absorption spectroscopy using microring resonators,” Optics Express, vol. 16, no. 16, pp. 11 930–11 936, 2008.
- (10) Y. Chen, C. Yang, W. Zhao, B. Fang, X. Xu, Y. Gai, X. Lin, W. Chen, and W. Zhang, “Ultra-sensitive measurement of peroxy radicals by chemical amplification broadband cavity-enhanced spectroscopy,” Analyst, vol. 141, no. 20, pp. 5870–5878, 2016.
- (11) R. Singh, D. Ma, L. Kimerling, A. M. Agarwal, and B. W. Anthony, “Chemical characterization of aerosol particles using on-chip photonic cavity enhanced spectroscopy,” ACS sensors, vol. 4, no. 3, pp. 571–577, 2019.
- (12) J. Wojtas, “Application of cavity enhanced absorption spectroscopy to the detection of nitric oxide, carbonyl sulphide, and ethane—breath biomarkers of serious diseases,” Sensors, vol. 15, no. 6, pp. 14 356–14 369, 2015.
- (13) D. Hunger, T. Steinmetz, Y. Colombe, C. Deutsch, T. W. Hänsch, and J. Reichel, “A fiber Fabry–Perot cavity with high finesse,” New Journal of Physics, vol. 12, no. 6, p. 065038, 2010.
- (14) H. Pfeifer, L. Ratschbacher, J. Gallego, C. Saavedra, A. Faßbender, A. von Haaren, W. Alt, S. Hofferberth, M. Köhl, S. Linden et al., “Achievements and perspectives of optical fiber Fabry–Perot cavities,” Applied Physics B, vol. 128, no. 2, pp. 1–15, 2022.
- (15) M. Steiner, H. M. Meyer, C. Deutsch, J. Reichel, and M. Köhl, “Single ion coupled to an optical fiber cavity,” Physical Review Letters, vol. 110, no. 4, p. 043003, 2013.
- (16) J. Gallego, W. Alt, T. Macha, M. Martinez-Dorantes, D. Pandey, and D. Meschede, “Strong Purcell effect on a neutral atom trapped in an open fiber cavity,” Physical Review Letters, vol. 121, no. 17, p. 173603, 2018.
- (17) R. Albrecht, A. Bommer, C. Pauly, F. Mücklich, A. W. Schell, P. Engel, T. Schröder, O. Benson, J. Reichel, and C. Becher, “Narrow-band single photon emission at room temperature based on a single nitrogen-vacancy center coupled to an all-fiber-cavity,” Applied Physics Letters, vol. 105, no. 7, p. 073113, 2014.
- (18) C. Toninelli, Y. Delley, T. Stöferle, A. Renn, S. Götzinger, and V. Sandoghdar, “A scanning microcavity for in situ control of single-molecule emission,” Applied Physics Letters, vol. 97, no. 2, p. 021107, 2010.
- (19) B. Besga, C. Vaneph, J. Reichel, J. Estève, A. Reinhard, J. Miguel-Sánchez, A. Imamoğlu, and T. Volz, “Polariton boxes in a tunable fiber cavity,” Physical Review Applied, vol. 3, no. 1, p. 014008, 2015.
- (20) N. Flowers-Jacobs, S. Hoch, J. Sankey, A. Kashkanova, A. Jayich, C. Deutsch, J. Reichel, and J. Harris, “Fiber-cavity-based optomechanical device,” Applied Physics Letters, vol. 101, no. 22, p. 221109, 2012.
- (21) M. Mader, J. Reichel, T. W. Hänsch, and D. Hunger, “A scanning cavity microscope,” Nature communications, vol. 6, no. 1, pp. 1–7, 2015.
- (22) B. Petrak, N. Djeu, and A. Muller, “Purcell-enhanced Raman scattering from atmospheric gases in a high-finesse microcavity,” Physical Review A, vol. 89, no. 2, p. 023811, 2014.
- (23) R. Wagner, F. Guzman, A. Chijioke, G. K. Gulati, M. Keller, and G. Shaw, “Direct measurement of radiation pressure and circulating power inside a passive optical cavity,” Optics Express, vol. 26, no. 18, pp. 23 492–23 506, 2018.
- (24) M. Mader, J. Benedikter, L. Husel, T. W. Hänsch, and D. Hunger, “Quantitative Determination of the Complex Polarizability of Individual Nanoparticles by Scanning Cavity Microscopy,” ACS Photonics, 2022.
- (25) Ott, Konstantin and Garcia, Sebastien and Kohlhaas, Ralf and Schüppert, Klemens and Rosenbusch, Peter and Long, Romain and Reichel, Jakob, “Millimeter-long fiber fabry-perot cavities,” Optics Express, vol. 24, no. 9, pp. 9839–9853, 2016.
- (26) F. Rochau, I. S. Arribas, A. Brieussel, S. Stapfner, D. Hunger, and E. M. Weig, “Dynamical backaction in an ultrahigh-finesse fiber-based microcavity,” Physical Review Applied, vol. 16, no. 1, p. 014013, 2021.
- (27) M. Mlynczak, F. Morgan, J.-H. Yee, P. Espy, D. Murtagh, B. Marshall, and F. Schmidlin, “Simultaneous measurements of the \ceO2 () and \ceO2 () Airglows and ozone in the daytime mesosphere,” Geophysical research letters, vol. 28, no. 6, pp. 999–1002, 2001.
- (28) M. G. Mlynczak, B. T. Marshall, F. J. Martin-Torres, J. M. Russell III, R. E. Thompson, E. E. Remsberg, and L. L. Gordley, “Sounding of the Atmosphere using Broadband Emission Radiometry observations of daytime mesospheric \ceO2 (1) 1.27 m emission and derivation of ozone, atomic oxygen, and solar and chemical energy deposition rates,” Journal of Geophysical Research: Atmospheres, vol. 112, no. D15, 2007.
- (29) S. Guslyakova, A. Fedorova, F. Lefèvre, O. Korablev, F. Montmessin, and J.-L. Bertaux, “\ceO2 (a1g) dayglow limb observations on Mars by SPICAM IR on Mars-Express and connection to water vapor distribution,” Icarus, vol. 239, pp. 131–140, 2014.
-
(30)
A. Franzen, “Component Library,” licensed under CC BY-NC 3.0,
http://www.gwoptics.org/ComponentLibrary/. - (31) C. Saavedra, D. Pandey, W. Alt, H. Pfeifer, and D. Meschede, “Tunable fiber Fabry-Perot cavities with high passive stability,” Optics Express, vol. 29, no. 2, pp. 974–982, 2021.
- (32) J. Gallego, S. Ghosh, S. K. Alavi, W. Alt, M. Martinez-Dorantes, D. Meschede, and L. Ratschbacher, “High-finesse fiber Fabry–Perot cavities: stabilization and mode matching analysis,” Applied Physics B, vol. 122, no. 3, pp. 1–14, 2016.
- (33) R. Drever, J. L. Hall, F. Kowalski, J. Hough, G. Ford, A. Munley, and H. Ward, “Laser phase and frequency stabilization using an optical resonator,” Applied Physics B, vol. 31, no. 2, pp. 97–105, 1983.
- (34) G. D. Greenblatt, J. J. Orlando, J. B. Burkholder, and A. Ravishankara, “Absorption measurements of oxygen between 330 and 1140 nm,” Journal of Geophysical Research: Atmospheres, vol. 95, no. D11, pp. 18 577–18 582, 1990.
- (35) B. J. Drouin, D. C. Benner, L. R. Brown, M. J. Cich, T. J. Crawford, V. M. Devi, A. Guillaume, J. T. Hodges, E. J. Mlawer, D. J. Robichaud et al., “Multispectrum analysis of the oxygen A-band,” Journal of Quantitative Spectroscopy and Radiative Transfer, vol. 186, pp. 118–138, 2017.
- (36) N. J. Van Leeuwen, H. G. Kjaergaard, D. L. Howard, and A. C. Wilson, “Measurement of ultraweak transitions in the visible region of molecular oxygen,” Journal of Molecular Spectroscopy, vol. 228, no. 1, pp. 83–91, 2004.
- (37) B. J. Drouin, S. Yu, B. M. Elliott, T. J. Crawford, and C. E. Miller, “High resolution spectral analysis of oxygen. III. Laboratory investigation of the airglow bands,” The Journal of Chemical Physics, vol. 139, no. 14, p. 144301, 2013.
- (38) C. S. Goldenstein, V. A. Miller, R. M. Spearrin, and C. L. Strand, “SpectraPlot. com: Integrated spectroscopic modeling of atomic and molecular gases,” Journal of Quantitative Spectroscopy and Radiative Transfer, vol. 200, pp. 249–257, 2017.
- (39) L. S. Rothman, I. E. Gordon, Y. Babikov, A. Barbe, D. C. Benner, P. F. Bernath, M. Birk, L. Bizzocchi, V. Boudon, L. R. Brown et al., “The HITRAN2012 molecular spectroscopic database,” Journal of Quantitative Spectroscopy and Radiative Transfer, vol. 130, pp. 4–50, 2013.
- (40) D. A. Newnham and J. Ballard, “Visible absorption cross sections and integrated absorption intensities of molecular oxygen (O2 and O4),” Journal of Geophysical Research: Atmospheres, vol. 103, no. D22, pp. 28 801–28 815, 1998.
- (41) “SpectraPlot - the wavelength search engine.” [Online]. Available: https://www.spectraplot.com/
- (42) A. Bick, C. Staarmann, P. Christoph, O. Hellmig, J. Heinze, K. Sengstock, and C. Becker, “The role of mode match in fiber cavities,” Review of Scientific Instruments, vol. 87, no. 1, p. 013102, 2016.
- (43) R. Engeln, G. von Helden, G. Berden, and G. Meijer, “Phase shift cavity ring down absorption spectroscopy,” Chemical Physics Letters, vol. 262, no. 1-2, pp. 105–109, 1996.
- (44) M. I. Cheema, S. Mehrabani, A. A. Hayat, Y.-A. Peter, A. M. Armani, and A. G. Kirk, “Simultaneous measurement of quality factor and wavelength shift by phase shift microcavity ring down spectroscopy,” Optics Express, vol. 20, no. 8, pp. 9090–9098, 2012.
- (45) J. Ye, L.-S. Ma, and J. L. Hall, “Ultrasensitive detections in atomic and molecular physics: demonstration in molecular overtone spectroscopy,” JOSA B, vol. 15, no. 1, pp. 6–15, 1998.
- (46) L.-S. Ma, J. Ye, P. Dubé, and J. L. Hall, “Ultrasensitive frequency-modulation spectroscopy enhanced by a high-finesse optical cavity: theory and application to overtone transitions of \ceC2H2 and \ceC2HD,” JOSA B, vol. 16, no. 12, pp. 2255–2268, 1999.
- (47) L. Gianfrani, R. W. Fox, and L. Hollberg, “Cavity-enhanced absorption spectroscopy of molecular oxygen,” JOSA B, vol. 16, no. 12, pp. 2247–2254, 1999.
- (48) J. Flannery, R. Al Maruf, T. Yoon, and M. Bajcsy, “Fabry-pérot cavity formed with dielectric metasurfaces in a hollow-core fiber,” ACS Photonics, vol. 5, no. 2, pp. 337–341, 2018.
- (49) E. D. Black, “An introduction to Pound–Drever–Hall laser frequency stabilization,” American journal of physics, vol. 69, no. 1, pp. 79–87, 2001.
- (50) D. Bresteau, C. Blondel, and C. Drag, “Saturation of the photoneutralization of a H- beam in continuous operation,” Review of Scientific Instruments, vol. 88, no. 11, p. 113103, 2017.
- (51) G. A. West, J. J. Barrett, D. R. Siebert, and K. V. Reddy, “Photoacoustic spectroscopy,” Review of Scientific Instruments, vol. 54, no. 7, pp. 797–817, 1983.
- (52) Q. Wang, Z. Wang, J. Chang, and W. Ren, “Fiber-ring laser-based intracavity photoacoustic spectroscopy for trace gas sensing,” Optics Letters, vol. 42, no. 11, pp. 2114–2117, 2017.
- (53) L. Kohler, M. Mader, C. Kern, M. Wegener, and D. Hunger, “Tracking Brownian motion in three dimensions and characterization of individual nanoparticles using a fiber-based high-finesse microcavity,” Nature Communications, vol. 12, no. 1, pp. 1–7, 2021.
- (54) J. C. Gallego Fernández, “Strong coupling between small atomic ensembles and an open fiber cavity,” 2018.
- (55) J. F. Brachmann, H. Kaupp, T. W. Hänsch, and D. Hunger, “Photothermal effects in ultra-precisely stabilized tunable microcavities,” Optics Express, vol. 24, no. 18, pp. 21 205–21 215, 2016.
- (56) T. Carmon, L. Yang, and K. J. Vahala, “Dynamical thermal behavior and thermal self-stability of microcavities,” Optics Express, vol. 12, no. 20, pp. 4742–4750, 2004.