2 Max-Planck-Institut für extraterrestrische Physik, D-85748 Garching, Germany
3 University College, Gower St, London WC1E 6BT, United Kingdom
4Instituto de Astrofisica de Canarias, C/Via Lactea s/n, E-38205 La Laguna, Tenerife,Spain
5 Universidad de La Laguna, Departamento di Astrofisica, E-38206 La Laguna, Tenerife, Spain
6 Cavendish Laboratory, University of Cambridge, 19JJ Thomson Avenue, Cambridge CB3 0HA, United Kingdom
XMM-Newton study of six massive, X-ray luminous galaxy clusters systems in the redshift range z = 0.25 to 0.5
Massive galaxy clusters are interesting astrophysical and cosmological study objects, but are relatively rare. In the redshift range to which is, for example, a favourable region for gravitational lensing studies, about 100 such systems are known. Most of them have been studied in X-rays. In this paper we study the six remaining massive clusters in this redshift interval in the highly complete CLASSIX survey which have so far not been observed with sufficiently deep exposures in X-rays. With data from our new XMM-Newton observations we characterise their structures, derive X-ray properties such as the X-ray luminosity and intra-cluster medium temperature and estimate their gas and total masses. We find that one cluster, RXCJ1230.7+3439, is dynamically young with three distinct substructures in the cluster outskirts and RXCJ1310.9+2157/RXCJ1310.4+2151 is a double cluster system. Mass determination is difficult in the systems with substructure. We therefore discuss several methods of mass estimation including scaling relations. In summary we find that five of the six study targets are indeed massive clusters as expected, while the last cluster RXCJ2116.2-0309 is a close projection of a distant and a nearby cluster which has led to a previous overestimation of its mass. In the XMM-Newton observation fields we also find three low redshift clusters close to the targets which are also analysed and described here. In the field of RXCJ2116.2-0309 we discover serendipitously a highly variable X-ray source which has decreased its flux within a year by more than a factor of eight. This source is most probably an AGN.
Key Words.:
galaxies: clusters, cosmology: large-scale structure of the Universe, X-rays: galaxies: clusters1 Introduction
Massive galaxy clusters are the largest well defined and quasi-stable objects in our Universe and they constitute interesting study objects and astrophysical laboratories. They cause the largest deflections of light rays by general relativistic effects. This is successfully exploited in using them as gravitational lens telescopes for the detailed study of distant objects which would otherwise be too faint for such investigations, e.g. Ellis (2014); Bouwens et al. (2014); McLeod et al. (2016); Fujimoto et al. (2016). They impose the strongest modifications of the cosmic microwave background through the Sunyaev-Zeldovich effect, e.g. Sunyaev & Zeldovich (1972). Cluster mergers are the most energetic events in the Universe after the big-bang, e.g. Sarazin (2002), and the shock waves in these mergers releasing an energy of the order of erg are interesting large-scale sites for cosmic ray acceleration which gives raise to the observed Mpc size radio halos and relics, e.g. Feretti et al. (2012). The most massive clusters also provide the most sensitive probes for the fluctuation amplitude of the cosmic matter density distribution and are thus important test objects for cosmological models, e.g. Vikhlinin et al. (2009); Böhringer et al. (2014); Mantz et al. (2014).
Therefore, there is a considerable interest in these clusters. But these high mass systems are very rare. Our CLASSIX galaxy cluster survey of X-ray luminous clusters in the nearby Universe out to redshifts of (Böhringer et al. (2016)) provide a good resource for looking for such objects, since the survey is highly flux complete. It provides the advantage that the X-ray luminosity is tightly related to the cluster mass, e.g. Vikhlinin et al. (2006); Pratt et al. (2009), and massive clusters are therefore easily found among the most X-ray luminous systems.
Selecting the most X-ray luminous clusters with erg s-1 (0.1 to 2.4 keV), we find more than a hundred clusters in the redshift range in a survey volume of 15.7 Gpc3, of which only five objects had no pointed X-ray observations so far and one object has only a short XMM-Newton exposure. Due to the extremely large interest in these systems, most of these clusters have been observed with XMM-Newton and/or Chandra. Here we report observations of the six remaining clusters with XMM-Newton, which allow for a detailed study of their properties.
In the following, we describe the observations and the data reduction in section 2. Section 3 shows the observational results and outlines the properties of the galaxy clusters. A discussion of the results and implications on the structure and mass of the clusters is given in section 4, followed by the conclusion in section 5. In Appendix A we show the observed properties of the three low redshift clusters which appear in the target fields and in Appendix B we describe a serendipitously detected highly variable X-ray source. For physical properties which depend on distance we use the following cosmological parameters: km s-1 Mpc-1, and a spatially flat metric.
2 Observations and data reduction
| name | z |
|---|---|
| RXCJ1230.7+3439 | 0.3324 |
| RXCJ1310.9+2157 | 0.2781 |
| RXCJ1317.1-3821 | 0.2539 |
| RXCJ1414.6+2703 | 0.4770 |
| RXCJ1717.1+2931 | 0.2772 |
| RXCJ2116.2-0309 | 0.4390 |
Notes: RXCJ1310.9+2157 is a double cluster system including RXCJ1310.4+2151.
Table 1 provides an overview of the observational targets. The six clusters were observed with XMM-Newton in eight observations with the observing IDs and exposure times given in Table 2. The observations were conducted in our programme, except for the observation RXCJ1310.9+2157b, which was taken from the archive. For two of the targets, RXCJ1310.9+2157 and RXCJ1717.1+2931 we also obtained images with HST to use these cluster systems as gravitational lens telescopes. The analysis of these observations is still ongoing.
| name | XMM | obs. | clean |
|---|---|---|---|
| ID | time | time | |
| R..1230.7+3439 | 0841900101 | 27.7 27.8 22.2 | 27.6 27.7 20.7 |
| R..1310.9+2157a | 0841900201 | 11.4 11.4 8.4 | 11.2 11.2 8.1 |
| R..1310.9+2157b | 0402250301 | 15.8 15.8 10.2 | 15.6 15.5 10.1 |
| R..1317.1-3821 | 0841900301 | 6.1 6.6 12.0 | 0.3 0.6 3.2 |
| R..1414.6+2703 | 0841900401 | 22.3 22.3 17.8 | 21.5 21.4 17.1 |
| R..1717.1+2931 | 0841900501 | 27.9 28.2 21.3 | 19.3 16.7 0.7 |
| R..2116.2-0309a | 0803410701 | 21.8 31.9 26.4 | 16.4 27.9 4.0 |
| R..2116.2-0309b | 0841900601 | 31.6 31.6 25.5 | 21.8 21.9 14.4 |
The data have been filtered in a two stage process by means of a 3-clipping technique, first in the hard band (10 - 12 keV for MOS and 10 - 14 keV for PN) and then in a broad band (0.4 - 10 keV) to clean the data from times of enhanced background due to solar flares. The original exposure times and the remaining clean times are listed for each observation and detector in Table 2.
For the further image and spectroscopic analyses, point sources were detected by means of the XMM-Newton SAS source detection software with a combination of eboxdetect, esplinemap, and emldetect. The detections were manually checked, spurious sources and substructure of the clusters were removed from the source list. Then these sources have been removed from the data for the spectroscopic and structural analysis.
For the image analysis, we corrected for the telescope vignetting by applying vignetting corrected exposure maps. To characterise the shape of the clusters and cluster components in an approximate azimuthally symmetric way, we determined their surface brightness profiles and fitted them with -models (Cavaliere & Fusco-Femiano, 1976). For multi-component systems, the neighbouring components were cutout from the data in the analysis of each component.
For the spectroscopic analysis we follow in the first approach the method of Chon & Böhringer (2017). The spectral fitting was performed with the XSPEC software 111XPSEC is obtained from https://heasarc.gsfc.nasa.gov/xanadu/xspec/. Two types of backgrounds were used in the analysis. For the particle background we used spectra from filter wheel closed data adjusted to the background level of the observation, by normalising with the ratio of the background rate in the un-illuminated corners of the detectors in the target and filter wheel closed data. The second background, the sky background, was obtained by using three major sky background components (local bubble, hot halo and extragalactic X-ray background) fitted to the spectrum from a background region outside the cluster. For this we used a region outside a radius of at least 6 - 8 arcmin away from the cluster center, after all point sources and non-relevant substructure were excised. In addition to the three sky background components we also considered soft protons, when necessary. The fit results in the background were then used to fit the cluster and background model spectra to the spectra in the source region, with fixed parameters for the sky background.
To get an approximate measure of the cluster masses, we assume spherical symmetry of the clusters or cluster components and hydrostatic equilibrium. Simulations show, e.g. Borgani et al. (2004); Nagai et al. (2007); Rasia et al. (2012), that this may underestimate the cluster masses by about 10 - 30%, which should be kept in mind. We do not correct for this in the values quoted for the hydrostatic mass determination.
We use the gas density profile of the intracluster medium as described by the beta model obtained from the fit, to determine the cluster’s gas mass and for the parameters to determine the cluster mass by means of the hydrostatic equation. The other information needed for the mass determination is the plasma temperature profile. We do not have enough data to determine this profile very accurately. Thus we use two bracketing solutions, which capture what is in general observed for clusters in deep X-ray studies. As one extreme we use an isothermal profile and as the other extreme we use a polytropic temperature profiles (where ) with a polytropic index up to . The observations show in general decreasing temperature profiles with a less than 1.2, e.g. Vikhlinin et al. (2006); Pratt et al. (2007); Zhang et al. (2008); De Grandi & Moldendi (2004). Instead of deriving a temperature profile in several radial rings, which is hardly possible with the given photon statistics, we determined the temperature when possible in several apertures and often one outer ring, and check if the expected mean emission measure weighted temperature for a given polytropic index is consistent with the data.
The X-ray data are mostly reliable out to about 222 is the radius where the average mass density inside reaches a value of 500 times the critical density of the Universe at the epoch of observation.. Therefore we derive cluster mass estimates and intracluster gas masses for this outer radius, quoted as and .
3 Results
3.1 RXCJ1230.7+3439
The cluster was found in the RASS by Appenzeller et al. (1998) under the designation ATZ98-D219 and by Böhringer et al. (2000) as part of the NORAS survey, where its redshift was determined as . The cluster was also detected via the Sunyaev-Zeldovich effect (SZE) in the Planck Survey and is part of the second Planck cluster catalogue (PLANCK Collaboration, 2016). It was found in the Sloan Digital Sky Survey (SDSS) by Hao et al. (2010) and Wen et al. (2009). It also appears in the Northern Sky Cluster Survey (Gal et al., 2003). Table 3 lists the position of the cluster and its substructures determined from the X-ray maxima and several cluster related redshifts.
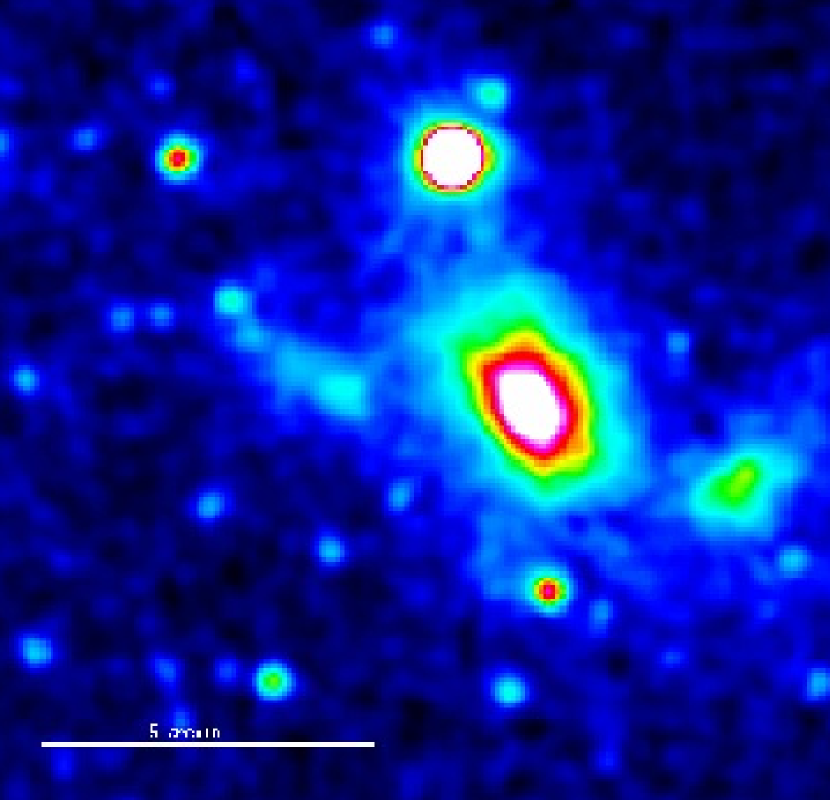
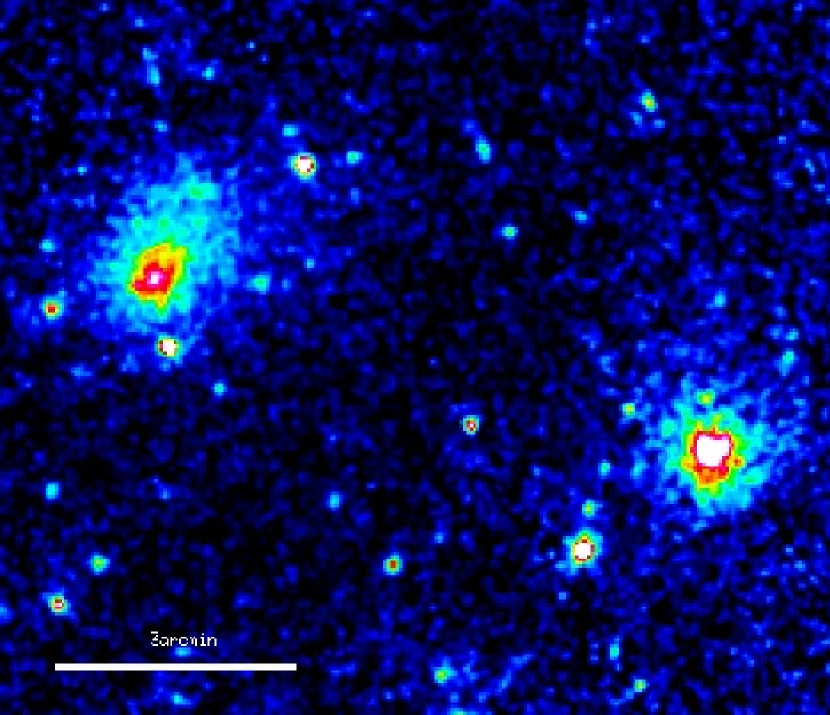
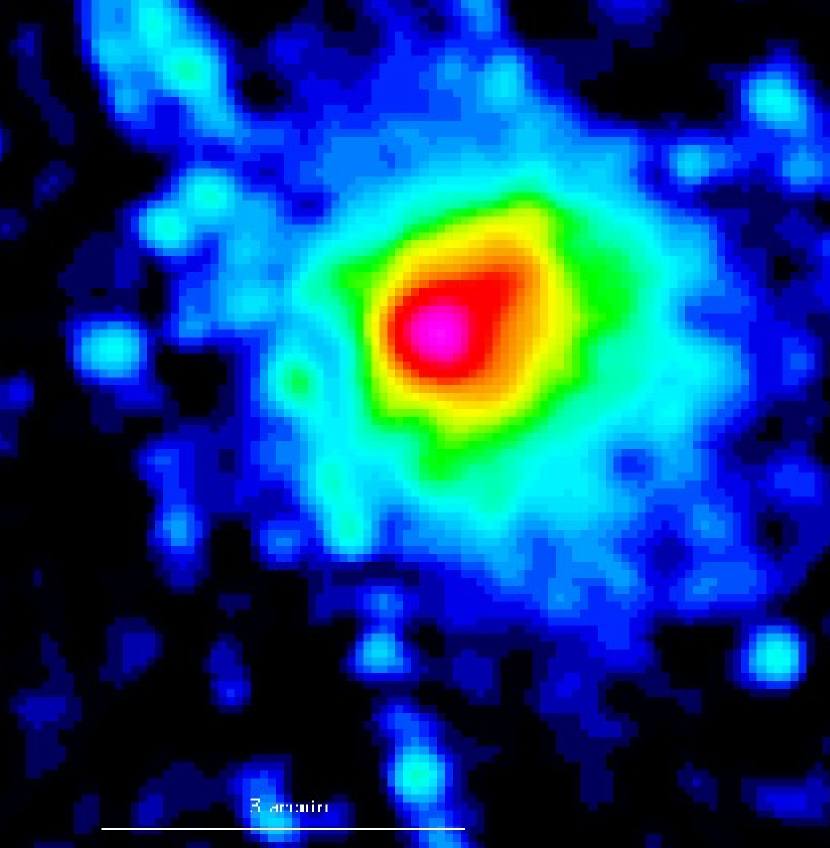
Fig. 1 shows an XMM-Newton image of the cluster in the 0.5 to 2 keV energy band. We clearly see three diffuse X-ray components of the cluster: The main cluster in the center, a subcomponent in the southwest and diffuse emission in the east in the form of a spur. There is also a faint indication of a small extension of the cluster in the South. In addition we see a few point sources in the field. The bright point source in the North of the cluster is associated to an NVSS radio galaxy, NVSS123050+344257, at the redshift of the cluster (z = 0.3335). A point source is also located in the middle of the southern subcomponent, for which we have no identification.
We also performed an optical spectroscopic study of the system, which is described by Barrena et al. (2022). In this study 93 redshifts where determined in the field of the cluster, of which 77 are cluster members. The mean redshift of the cluster members is with a velocity dispersion of km s-1. A substructure analysis for the galaxy distribution shows the same four substructure components mentioned above. The mean redshifts of the three major substructures are given in Table 3. The redshift of the southern component is . The structural analysis of the phase space distribution of the galaxies indicates that the substructure is mainly oriented parallel to the plane of the sky. From the X-ray observations we can constrain the redshift of the intracluster plasma for the main component to be and the eastern component to be . Thus the different components form one dynamically young system.
| Center | Southwest | East | |
| RA | 12 30 45 | 12 30 29.7 | 12 30 59.5 |
| DEC | +34 39 07 | +34 37 50 | +34 39 21 |
| spec. z | 0.3324 | 0.3295 | 0.3306 |
| BCG za) | 0.3337 | 0.3269 | 0.3383 |
| X-ray z | - | ||
| 999 | 792 | ||
| FX | |||
| LX | |||
| TX | |||
| Mgas | 0.44 | 0.20 | 0.1 |
| rc | 0.45 | 0.30 | 0.26 |
| 0.48 | 0.36 | 0.28 |
Notes: The columns give the following parameters: RA and DEC are
for the epoch J2000,
spec. z is the mean of the spectroscopic redshifts of cluster galaxies
(Barrena et al., 2022), BCG z is the spectroscopic redshift of
the brightest cluster galaxy (BCG) at the center, X-ray z is the redshift obtained from
X-ray spectroscopy of the intracluster plasma, is the velocity
dispersion from Barrena et al. (2022). is the unabsorbed X-ray
flux in the 0.5 to 2 keV energy band in units of erg s-1 cm-2,
is the k-corrected X-ray luminosity in the 0.5 to 2 keV energy band
in units of erg s-1, is the mean temperature of the component
determined from X-ray spectroscopy in units of keV, is the gas mass inside in units of M⊙,
is the core radius of the
intracluster medium in arcmin, and the parameter of the gas density profile slope.
a) The first two BCG redshifts
are from Barrena et al. (2022) and they are
identical to those from the Sloan Digital Sky Survey (SDSS) Data release 13 (2016).
The last BCG redshift is from SDSS.
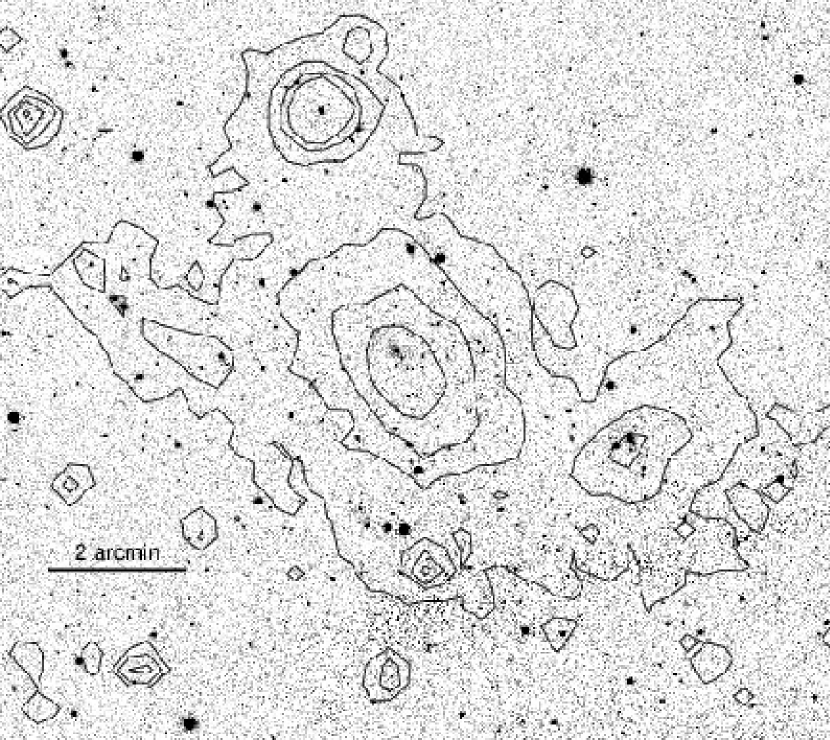
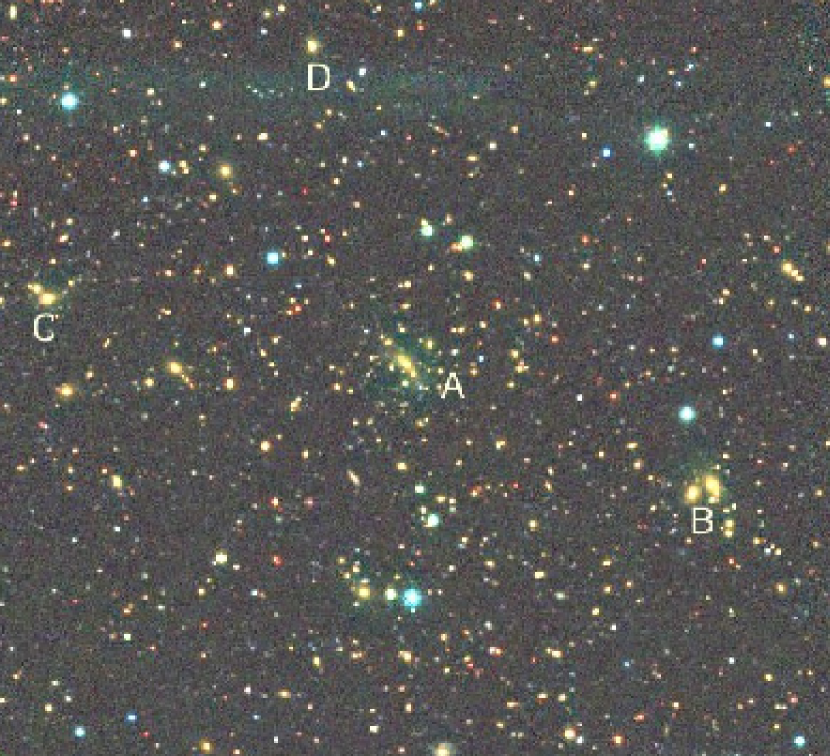
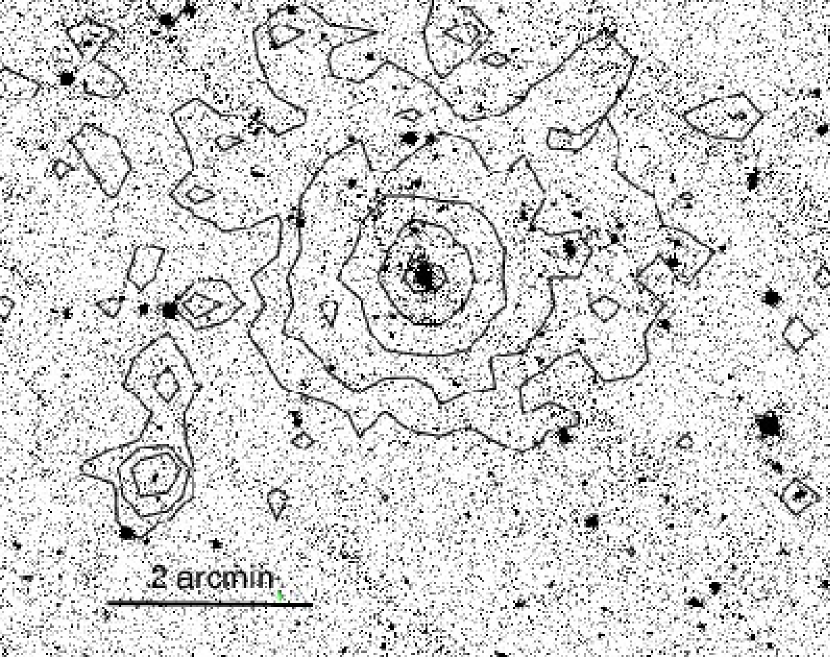
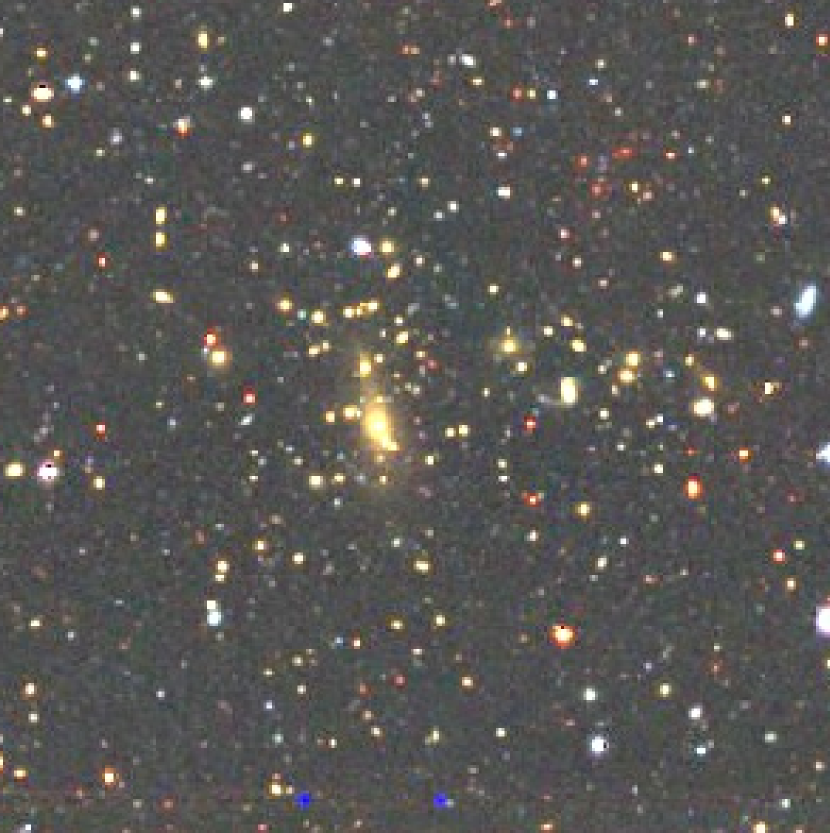
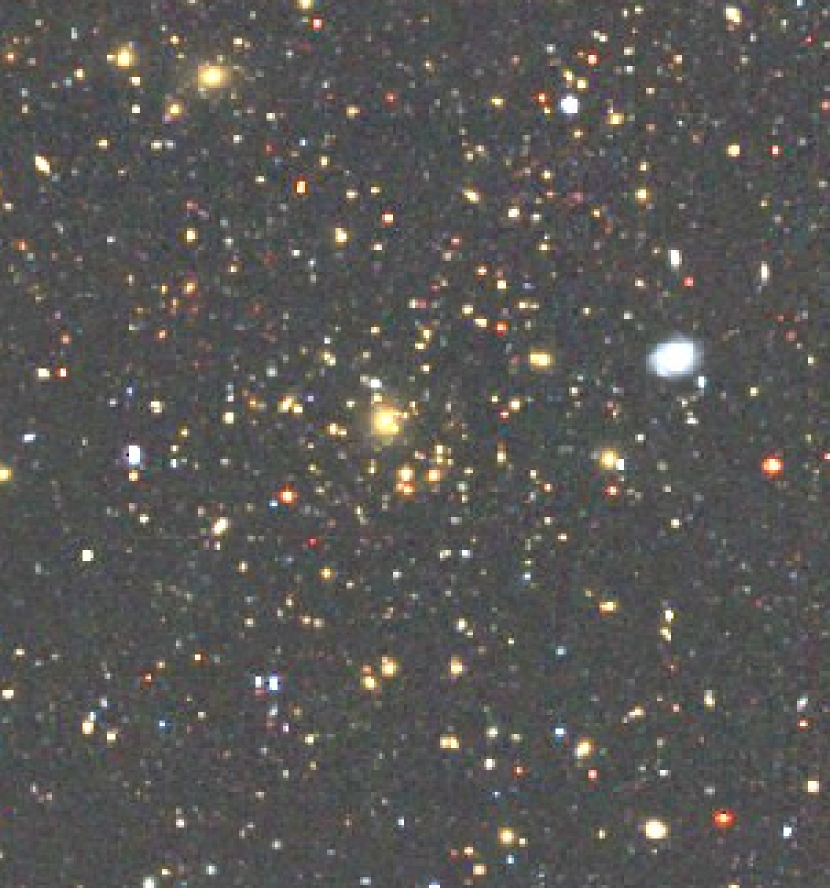
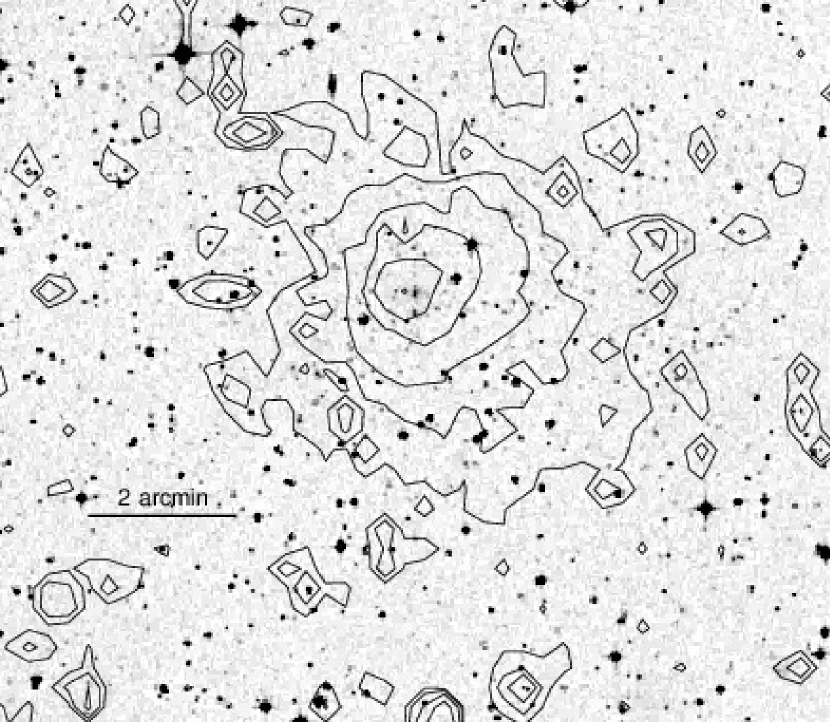
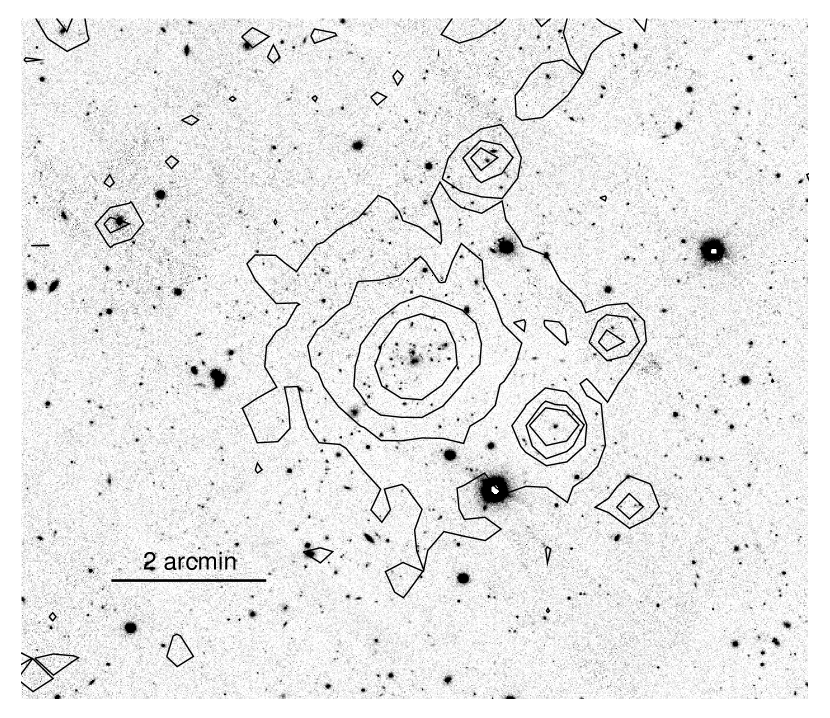
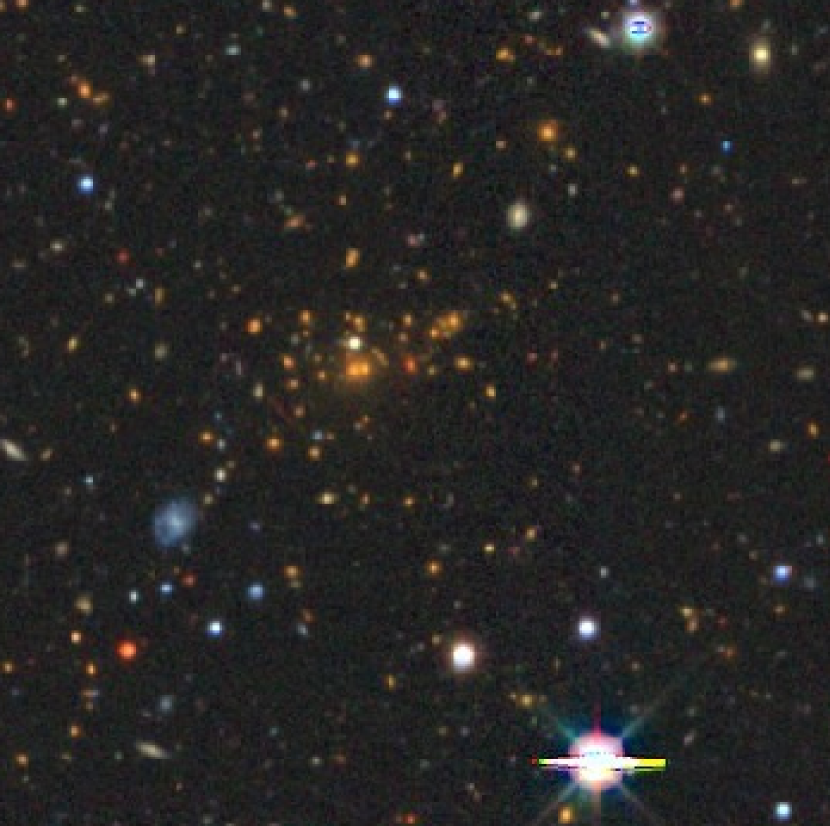
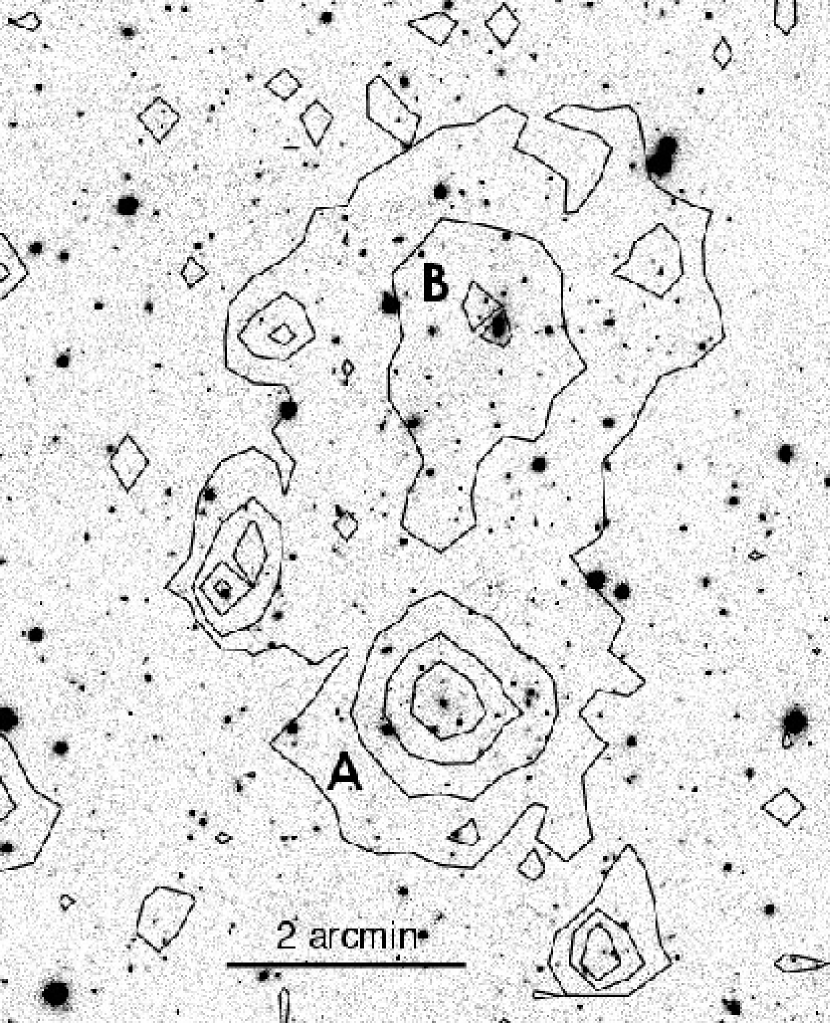
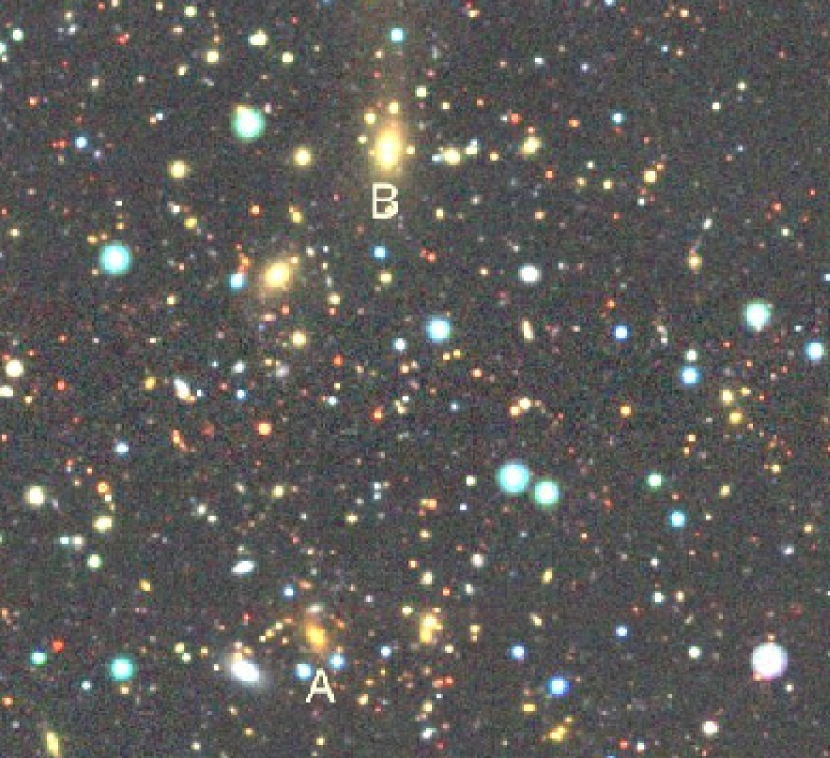
Fig. 2 shows an overlay of the contours of the X-ray surface brightness on a PanSTARSS i-band image 333PanSTARRS images can be retrieved from and a colour composite image in the g, r, z band from the DESI Legacy Imaging Surveys 444Legacy Imaging Surveys data can be found at https://www.legacysurveys.org. We clearly see BCG type galaxies near the X-ray maxima in the three major substructure components. In the south-western clump there are actually two bright galaxies near the X-ray peak. The redshifts of these central galaxies are consistent with the mean redshifts of the structures and the indicated X-ray redshifts of the intracluster medium (ICM).
Table 3 also provides information on the physical properties of the three main substructures of RXCJ1230.7+3439 determined from the X-ray data. The XMM-Newton observations provide good data for this cluster for all three detectors, with 27.6, 27.7 and 20.7 ks of clean exposure time for MOS1, MOS2 and PN, respectively (see Table 2). The X-ray image in the 0.5 to 2 keV energy band shown in Fig. 1 was produced from the data of all three detectors with the appropriate scaling of the MOS exposure to that of PN. The image is vignetting corrected and background subtracted. In the imaging data we analysed the three major components of the cluster separately. We determined surface brightness profiles and -model fits for each component. The results for the fits are given in Table 3. To assume an azimuthal symmetry for the eastern filament-like structure is a very crude approximation which should only give a first impression. This should be kept in mind in interpreting the properties given for this cluster part. From the -model fits to the surface brightness profiles we can derive gas density profiles and total gas masses for the cluster components. Results for all three components are given in Table 3.
From the X-ray data we determined average temperatures in six regions of the cluster. For the central, main component we obtained temperatures in four regions, , , , arcmin (corresponding to and kpc), of, , , and keV, respectively. We explored which temperature profiles given by polytropic models (of the form , where is the polytropic index) are consistent with these measurements. For this aim we averaged the model temperatures along the line of sight as a function of projected radius applying the spectroscopic-like temperature method of Mazzotta et al. (2004) and compared the results with the observations and their uncertainties. We find that constant temperature and polytropic temperature profiles steeper than can be ruled out with a significance of more than 1. This justifies our approach of bracketing the temperature profile by these boundaries for the mass determination. For the south-west component inside arcmin ( kpc) we find keV and for the eastern component, keV at arcmin ( kpc). From the derived central cooling times for the three substructures of, 14, 23, and 25 Gyr, respectively, we conclude that none of the structures have a cooling core (where we assume a cooling time of Gyr for a cooling core).
With the results for the intracluster plasma density and temperature distribution, we can determine first cluster mass estimates based on hydrostatic equilibrium, which are given below in Table 9. The error bars are the minimum and maximum of the mass values at derived from the different solutions for the temperature range given by the uncertainties and a constant temperature profile as well as polytropic model. We discuss these results further in the next section.
3.2 RXCJ1310.9+2157 and RXCJ1310.4+2151
This system was found as double cluster in the NORAS II survey (Böhringer et al., 2017). In one of the observations we see a third extended galaxy cluster X-ray source in the East of the two target clusters. This cluster is located at lower redshift outside the redshift range for this cluster sample. We provide more information of the properties of this cluster, RXCJ1311.7+2201, in the Appendix. RXCJ1310.9+2157 and RXCJ1310.4+2151 have also been detected in the SDSS (Hao et al., 2010; Wen et al., 2012), RXCJ1310.4+2151 also appears in Koester et al. (2007). The sky position and redshifts of the two system components are given in Table 4. They have a similar distance and form a double cluster system.
The components are covered by two XMM-Newton pointings which have the component RXCJ1310.9+2157 in common. X-ray images of the two pointings are shown in Figs 3 and 4. The cluster RXCJ1310.9+2157 in the East is very round and compact, while RXCJ1310.4+2151 in the West is slightly elongated and structured.
| name | R..1310.9+2157 | R..1310.4+2151 |
|---|---|---|
| RA | 13 10 56.3 | 13 10 21.6 |
| DEC | 21 57 57.0 | +21 50 04 |
| spec. za | 0.2781 (3) | 0.2734 (6) |
| BCG zb | 0.2822 | 0.2725 |
| X-ray z | ||
| FX | ||
| LX | ||
| TX | ||
| Mgas | 3.0 | 4.3 |
| rc | 0.19 | 1.15 |
| 0.48 | 0.75 |
Notes The meaning of the parameters is the same as in Table 3.
a) The integers in brackets give the number of galaxies available
for the cluster redshift determination.
b) The redshift of the BCGs of RXCJ1310.9+2157
is from the 2MASS galaxy survey (Bilicki et al., 2014).
The one for RXCJ1310.4+2151 is from the SDSS Data release 13 (2016).
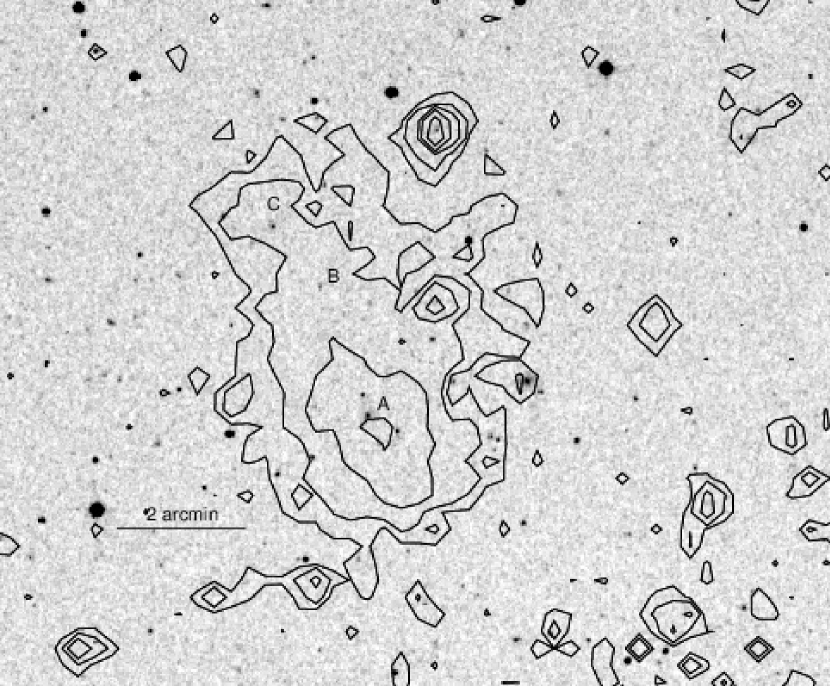
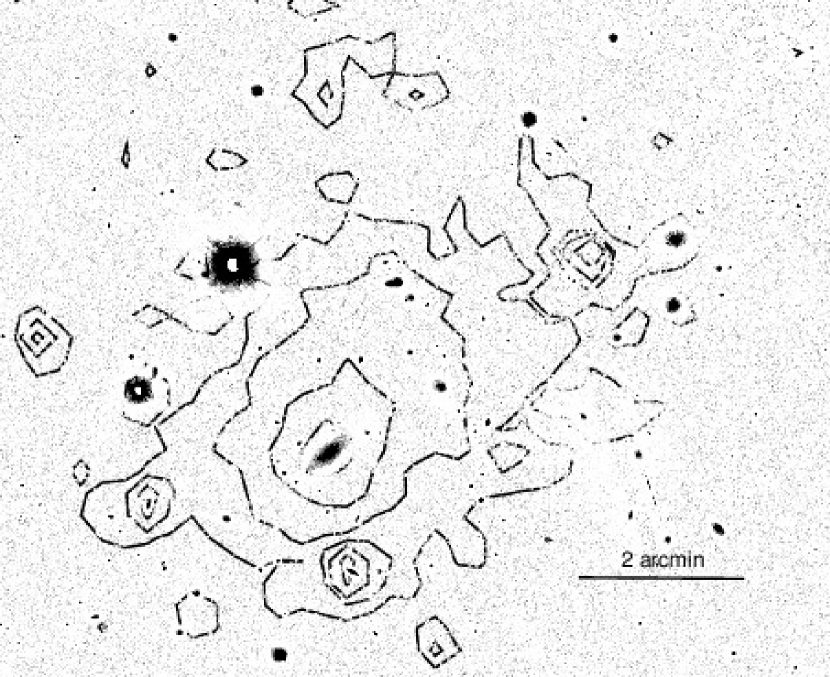
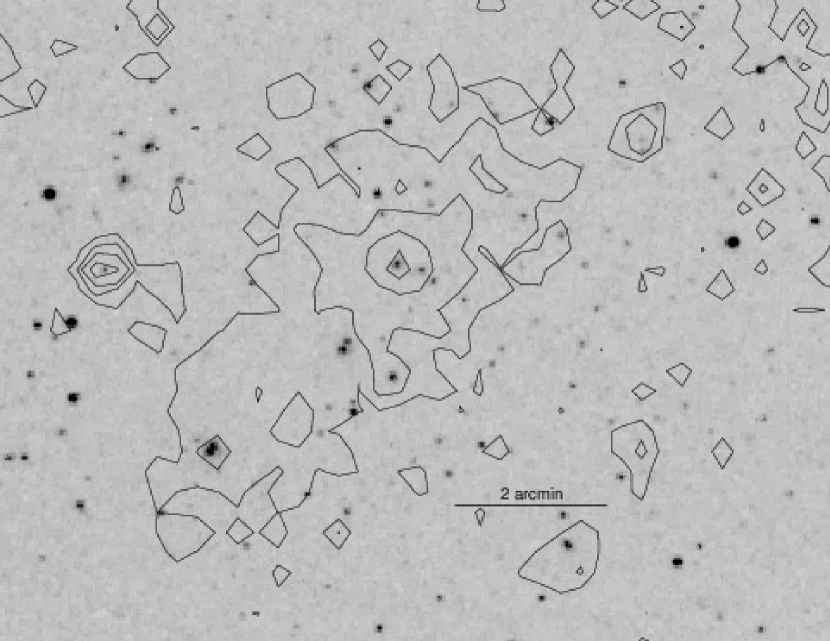
Figs. 5 and 6 show overlays of contours of the X-ray surface brightness in the 0.5 to 2 keV band on optical images from PanSTARRS in the i-band for RXCJ1310.9+2157 and from DSS for RXCJ1310.4+2151. We also show color composite images from the Legacy Imaging Surveys. Both systems have clear BCG galaxies at their X-ray maxima. In RXCJ1310.4+2151 we note two further bright galaxies (B and C) which mark the extension to the north.
From the analysis of the X-ray spectra of RXCJ1310.9+2157 in different circles and rings at radii, , , and arcmin ( kpc), , we find temperatures of , , and keV, respectively. For RXCJ1310.4+2151 we find for , and arcmin ( kpc) , temperatures of , and keV, respectively. In both cases a temperature profile with a polytropic index of 1.2 or larger can be ruled out by the data. Cluster properties inferred from the observational data are given in Table 4. The central cooling times derived from the data of 6 and 28 Gyr for RXCJ1310.9+2157 and RXCJ1310.4+2151, respectively, do not indicate a cooling core for the two systems.
3.3 RXCJ1317.1-3821
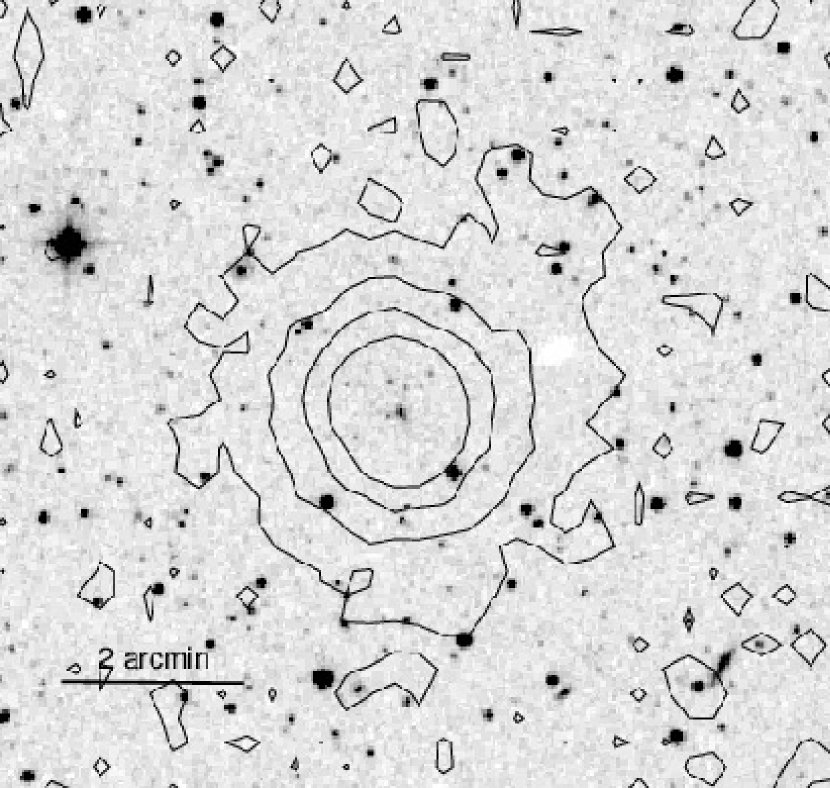
RXCJ1317.1-3821 was identified in the course of the REFLEX survey (Böhringer et al., 2004) and the redshift was determined from two cluster members as . The XMM-Newton observation is heavily affected by particles from a solar flare and only about 3 ks of usable pn data and hardly any MOS data could be recovered, not enough for a detailed analysis. Fig 7 shows an X-ray image of the center of the cluster from these data. The image is clearly affected by the gaps in the pn detector and the background noise. An overlay of the X-ray contours on a DSS image 555DSS (Digital Sky Survey) images can be retrieved from: of the cluster are shown in Fig. 8. The cluster is very round and lobesided towards the south-west. We clearly see the extended emission of the intracluster medium of a galaxy cluster. A bright galaxy is found at the X-ray maximum. The derivable properties of the cluster are given in Table 5.
Due to the short exposure we do not see much of the outer regions of the cluster. With the small number of photons no spectroscopic analysis has been attempted. This study will be performed with the new XMM-Newton and Chandra observations awarded to us.
3.4 RXCJ1414.6+2703
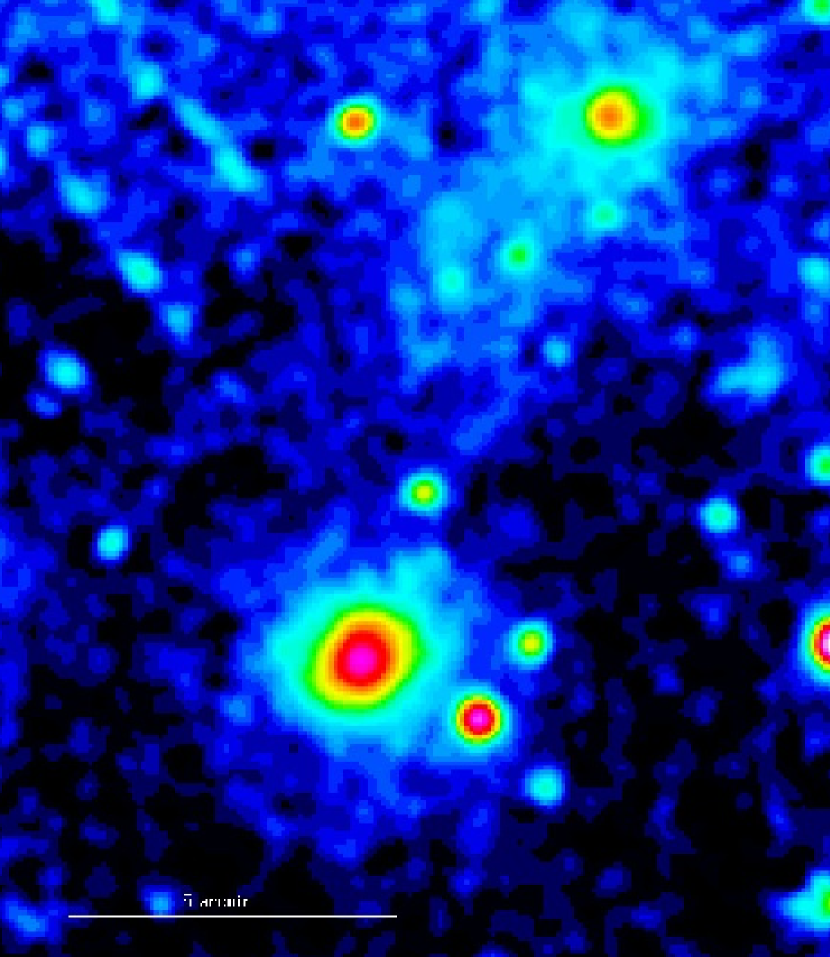
In the field of the cluster RXCJ1414.6+2703 we find two regions of extended X-ray emission. The X-ray source in the center of the field belongs to the cluster RXCJ1414.6+2703 (at ), which was identified in the NORAS II survey (Böhringer et al., 2017). The second source in the north shows another clusters with the lable RXCJ1414.3+2711 at a different redshift of . We describe this cluster in more detail in the Appendix. RXCJ1414.6+2703 was also detected in the SDSS (Hao et al., 2010; Wen et al., 2010) and in the Planck Survey (PLANCK Collaboration, 2016).
From the analysis of the X-ray spectra of RXCJ1414.6+2703 in different circles and rings at radii, , , and arcmin ( kpc), we find temperatures of , , and , respectively. The system shows a central cooling time of 7 Gyr, which does not indicate a cooling core.
| RXCJ1414.6+2703 | |
| RA | 14 14 39.0 |
| DEC | +27 03 13 |
| spec. redshift | 0.4770 (2) |
| BCG redshifta) | 0.4772 |
| X-ray redshift | 0.478 |
| FX | |
| LX | |
| TX | |
| Mgas | 6.8 |
| rc | 0.25 |
| 0.54 |
Notes The meaning of the parameters is the same as in Table 3
a) The redshift of the BCG is from the SDSS data release 13 (2017).
Fig. 10 presents an overlay of X-ray contours on an i-band image obtained from PanSTARRS for RXCJ1414.6+2703 and a color image from the Legacy Imaging Surveys. We note a round and compact cluster structure with a clear BCG at the X-ray peak.
3.5 RXCJ1717.1+2931
The cluster was discovered in the REFLEX II survey (Böhringer et al., 2013). Wen & Han (2015) found a cluster at this position in the SDSS at . Fischer et al. (1998) had previously identified the X-ray source as an AGN. The XMM-Newton observation was affected by solar flare particles and the pn data were effectively completely lost, with usable data of 19.3 ks and 16.7 ks exposure remaining for MOS 1 and 2, respectively. We therefore concentrate here on a first X-ray analysis of the central region of the cluster. A more detailed study will be performed with the new XMM-Newton and Chandra observations awarded to us.
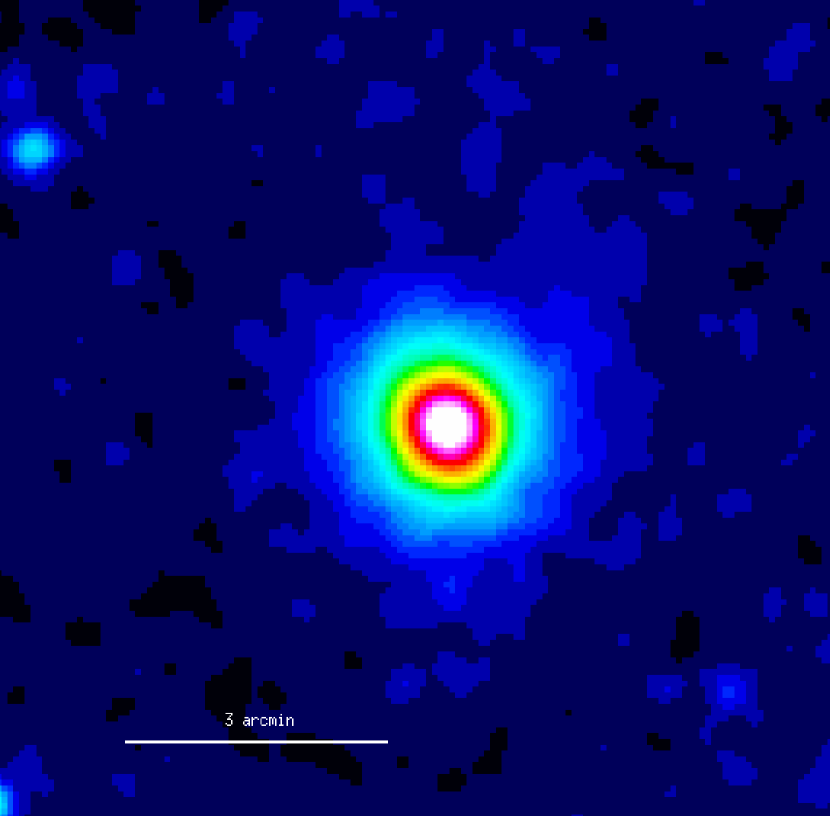
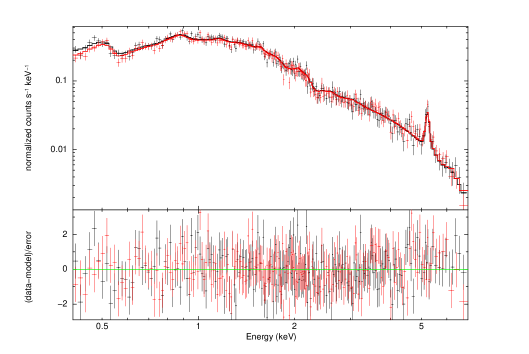
Fig. 11 shows an X-ray image in the 0.5 to 2 keV band produced from the MOS data. RXCJ1717.1+2931 is a remarkably symmetric system and the X-ray emission is highly peaked. The data remaining after flare cleaning are not sufficient to unveil the temperature structure of the cluster spectroscopically. From the MOS data we can obtain a spectrum of the central region, which is shown in Fig. 12. The analysis of the spectrum yields a temperature of keV and a redshift of . The spectrum can be well fit by a thermal spectrum at the cluster redshift. The clearly visible iron K-line agrees perfectly with the line of highly ionised iron at the temperature and redshift of the cluster. It is not consistent with a fluorescent iron line observed in some AGN.
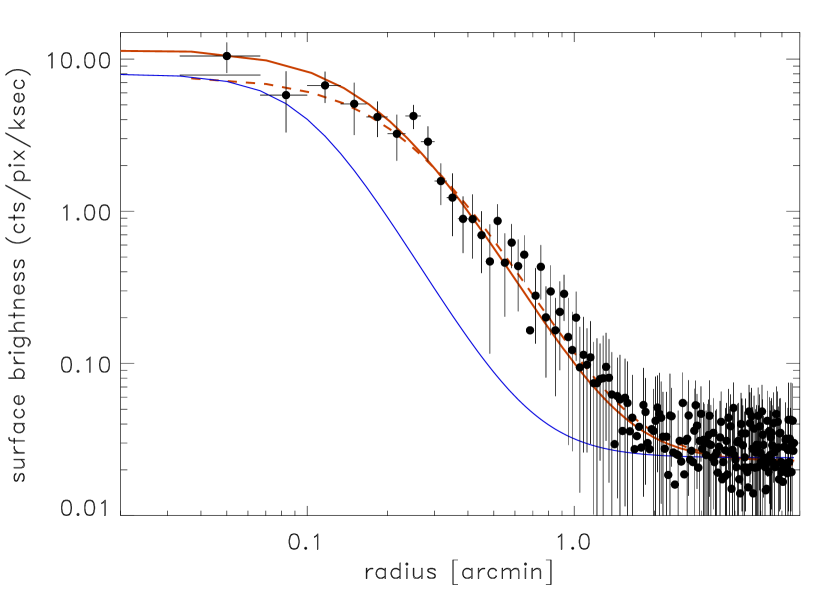
A surface brightness profile of the X-ray emission of the cluster is shown in Fig. 13. The profile was fit by a -model, convolved with the MOS detector point spread function. We show in the Figure the convolved (dashed red line) and inferred unconvolved profile (solid red line) and for comparison the profile of a point source (solid blue line). The emission is clearly extended. Therefore, from the appearance of the X-ray spectrum as well as from the source extent, we can safely conclude that the X-ray emission of the cluster is not dominated by X-rays from an AGN.
| position | 17 17 06.9 | +29 31 21 |
|---|---|---|
| spec. redshift | 0.2772 | 4 galaxies |
| BCG redshifta) | 0.2780 | |
| X-ray redshift | 0.275 | |
| FX | ||
| LX | ||
| rc | 0.20 | |
| 0.68 |
Notes The meaning of the parameters is the same as in Table 3.
a) The redshifts of the BCG is from the SDSS data release 2 (2004)
The cluster has a high X-ray luminosity and one would expect a higher X-ray temperature from the scaling relation than what is measured. We are most probably measure the lower central temperature of a cool core. The analysis of the surface brightness profile indicates a cool core with a central cooling time of about 1.2 Gyr and a cooling radius of about 100 kpc ( arcmin). The X-ray luminosity in the cooling region is about erg s-1. A more detailed analysis will be possible with the future Chandra and XMM-Newton data.
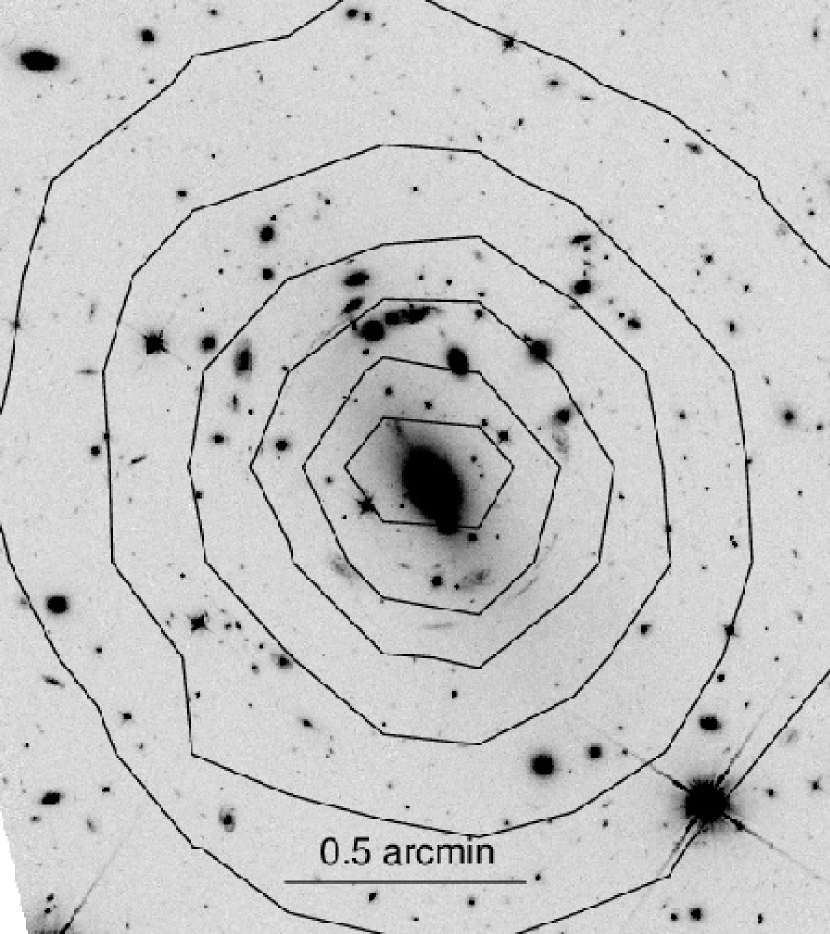
Fig. 14 shows X-ray surface brightness contours overlayed on an optical image from DSS. The X-ray peak coincides with a bright BCG. A focus on the central region of the cluster is shown in Fig. 15, where X-ray contours are superposed on an HST image taken with the F110 filter. The X-ray emission is precisely focused on the central galaxy and we even note that the X-ray contours have a slight elliptical shape with a similar position angle as the BCG. Thus the X-ray trace the gravitational potential of the galaxy, which is common for strong cool core clusters.
3.6 RXCJ2116.2-0309
The galaxy cluster RXCJ2116.2-0309 was identified in this field in the REFLEX II survey at a redshift of . In the ROSAT All-Sky Survey the cluster emission is merged in a larger emission region with a foreground cluster, RXCJ2116.1-0306, at redshift and located to the north of the distant target cluster. We describe the properties of the northern cluster in the Appendix.
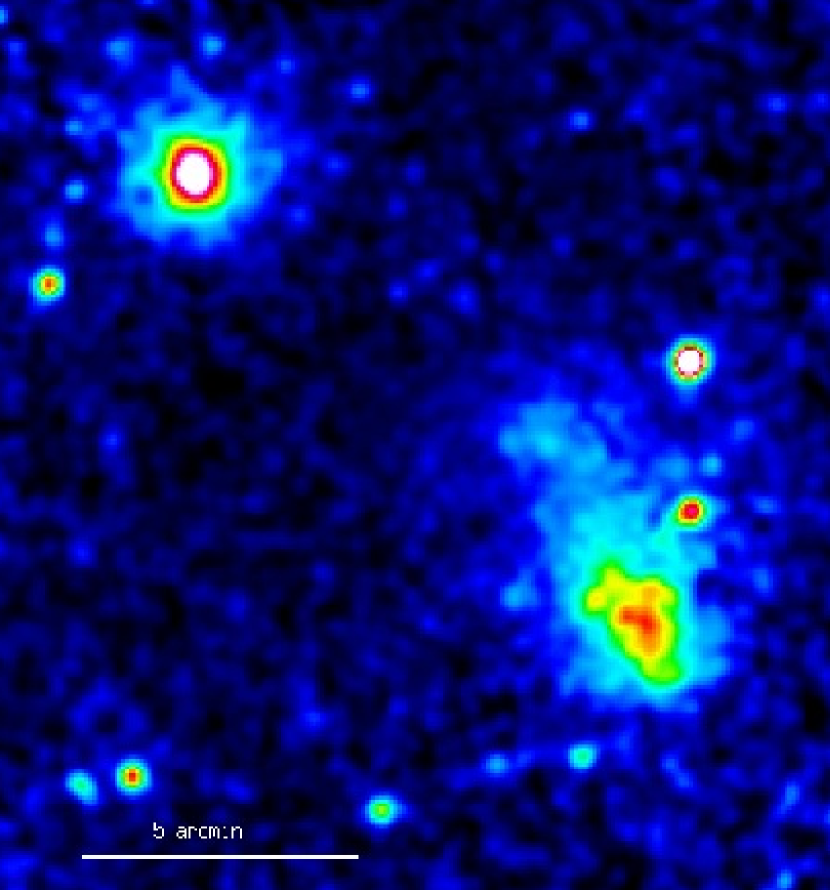
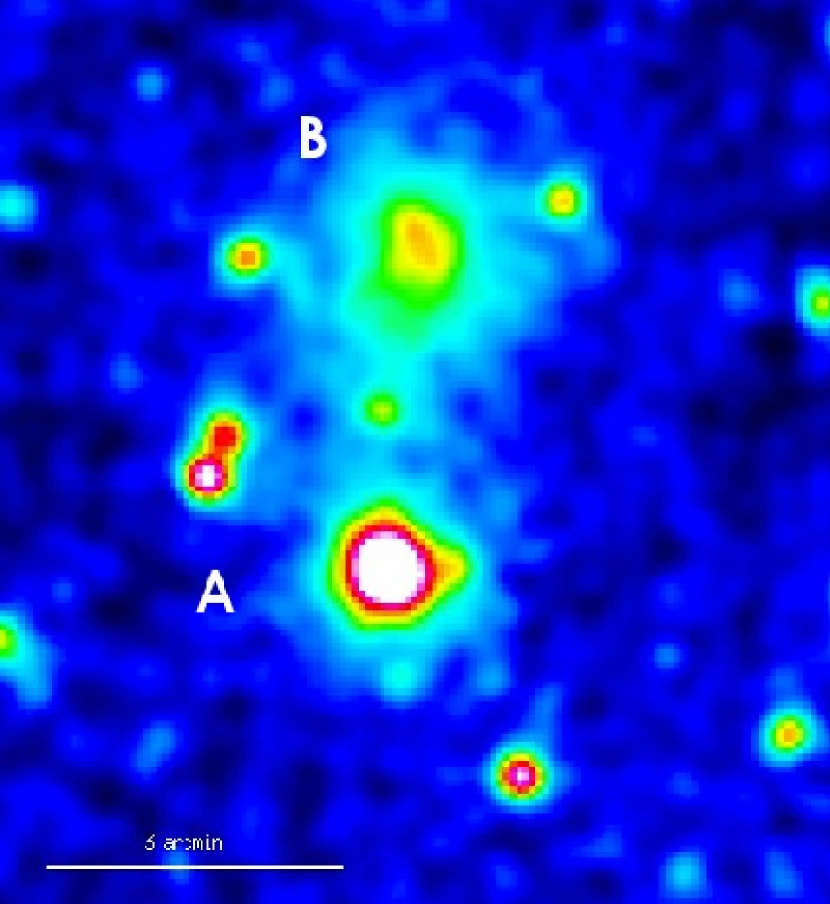
RXCJ2116.2-0309 was also found in the SDSS at similar redshifts by Wen et al. (2012) and Rozo et al. (2015). Fig. 16 shows an XMM-Newton image of the two clusters. RXCJ2116.2-0309 is very bright and compact and does not show much substructure. Table 8 provides information on the redshift and X-ray properties of the system.
Fig. 17 shows an image of the X-ray surface brightness contours overlayed on an optical i-band image from the PanSTARRS survey and Fig. 18 a colour image from the Legacy Imaging Surveys. RXCJ2116.2-0309 features a clear BCG at the X-ray maximum.
| RXCJ2116.2-0309 | |
|---|---|
| RA | 21 16 12 |
| DEC | -03 09 26.5 |
| spec. redshift | 0.4390 (1) |
| BCG redshifta) | 0.4390 |
| X-ray redshift | 0.45 |
| FX | |
| LX | |
| TX | |
| Mgas | 1.8 |
| rc | 0.12 |
| 0.51 |
Notes The meaning of the parameters is the same as in Table 3 a) The redshift of the BCG of RXCJ2116.2-0309 is from the SDSS data release 13 (2016).
| mass | 1230C | 1230SW | 1230E | 1310C | 1310S | 1414S | 2116S |
|---|---|---|---|---|---|---|---|
| 1.9 | 1.14 | - | 2.0 | 3.3 | 3.9 | 1.02 | |
| 3.1 | 2.9 | - | 3.1 | 2.7 | 5.2 | 1.5 | |
| 4.7 | 2.3 | 1.5 | 2.8 | 3.6 | 5.4 | 3.2 | |
| 3.1 | 2.9 | - | 3.3 | 3.05 | 5.2 | 1.48 | |
| 4.2 | 2.3 | 1.2 | 3.05 | 4.1 | 6.0 | 2.0 | |
| 3.7 | 2.3 | - | 3.05 | 3.6 | 5.7 | 1.7 | |
| 5.6 | 2.7 | ||||||
| 3.7 | 2.5 | 1.35 | 3.1 | 3.4 | 5.5 | 1.9 | |
| 3.45 | 2.98 | 2.39 | 3.69 | 3.94 | 2.97 | 2.27 |
Notes: All masses are given in units of M⊙. and are hydrostatic mass estimates based on -models for the surface brightness distribution of the intracluster medium, where the first value is based on the fitted value for and the second for a model with . and are based on the X-ray luminosity - mass relation and temperature - mass relation, respectively. is determined from the total gas mass in the cluster and the relation of the baryon fraction with cluster mass, is derived from the scaling relation of the product of gas mass and temperature with cluster mass, and is derived from the mean of the scaling relation results.
Intracluster plasma temperatures were determined from an X-ray spectroscopic analysis. For RXCJ2116.2-0309, we determined temperatures in four regions, with , , , and arcmin ( kpc), yielding the following results: , , , and keV, respectively. The system shows a central cooling time of the ICM of about 3 Gyr, which can be taken as a sign of a moderate cooling core.
In the field of the cluster we also observe an X-ray point source which decreased its flux dramatically between the first and second pointed observation. It is located at RA = 21 16 06.6, DEC = -03 11 32 and we thus lable it as XMMUJ2116.2-0311. The source can be seen in Figs. 16 and 17 about 2.5 arcmin south-west of RXCJ2116.2-0309. The observation shown is 0841900601 where the source is less bright. We have not found a previous identification of this source. It is most probably an AGN. We describe further details of the X-ray properties of this source in the Appendix.
4 Discussion
Some of the clusters in this sample for which we have good X-ray data show a dynamically unrelaxed configuration. For such clusters the mass determination is more difficult and uncertain than for relaxed clusters. Therefore we went through a critical inspection of various ways of mass estimation to determine the best overall consistent picture. This is described in this section.
In addition to the hydrostatic mass determination we used several well calibrated scaling relations to obtain mass estimates from different direct and indirect observables. Based on the studies by Pratt et al. (2009) and Vikhlinin et al. (2006) we adopted the following X-ray luminosity - mass relation:
| (1) |
where is the mass inside in units of M⊙, is the X-ray luminosity in the 0.5 - 2 keV band inside , and is the Hubble constant in units of 100 km s-1 Mpc-1. For the uncertainty we adopted the scatter in the relation of about 40%. For the mass temperature relation we use (Arnaud et al., 2005):
| (2) |
where is the spectroscopic temperature inside and . The main contribution to the uncertainty is in our case the error in the temperature measurement.
Further good proxies for the total cluster mass are the total gas mass inside , , and the parameter , which is the product of the gas mass and the temperature. The latter is thought to be proportional to the observable decrement in the microwave background through the Sunyaev-Zeldovich effect (Kravtsov et al., 2006; Nagai, 2006). To scale the gas mass fraction, , with cluster mass we apply the observationally determined relation from Pratt et al. (2009).
| (3) |
The uncertainty of is determined by adding the uncertainty in the -model fit taken from the difference between different detectors and a 13% uncertainty from the scatter of the gas mass fraction - mass relation (Pratt et al., 2009). For the scaling relation of with cluster mass we use (Pratt et al., 2009):
| (4) |
where is in units of M keV. To determine the relative uncertainty of this parameter we apply a Gaussian addition of the error contributions from and . This may be an overestimate since and are thought to be anti-correlated (e.g. Kravtsov et al. (2006)). The saller influence of is, except for two cases in the Appendix, always less then 20% and therefore the possible overestimate is also small. The results of the mass estimates are given in Table 9.
4.1 RXCJ1230.7+3439
We note in Table 9 that the mass estimates obtained for the main component of RXCJ1230.7+3439 from the different observables span a range from to M⊙. The mass determined from the plasma density distribution and the isothermal or polytropic temperature model is with a value of M⊙ significantly smaller than these values.
An explanation for this discrepancy is certainly the disturbed state of the clusters. A major reason for the low resulting cluster mass using the -model for the plasma density distribution is the low value of derived from the observed surface brightness profile. Massive relaxed clusters show typical -values of or even higher (e.g. Croston et al. (2008)). Thus a low value of is most probably another manifestation that the hot plasma in the cluster has not settled. Two factors can play a role here, on one side substructure in the line of sight outside projected onto the cluster, and inhomogeneities and deviations from an azimuthally symmetric plasma distribution which boost the emission measure. To get a feeling for the effect of low -values, we also calculated the cluster mass by fixing the slope parameter to , while keeping all the other model parameters the same. The result is shown in Table 9 under the lable . With a mass value of M⊙, we now get a value in the range of the results obtained from scaling relations, which seems to support our reasoning. Since the -values for most of the other unrelaxed clusters studied here in detail are also low, we performed the same exercise with a fixed value of also for the other systems.
Among the mass estimates is on the low side for the main component of RXCJ1230.7+3439. This is not unusual for unrelaxed clusters. For example, the study by Chon & Böhringer (2017) showed that unrelaxed clusters have temperatures below the general scaling relation.
As a final value for the mass, we adopted an average result of the four scaling relations with , , , and of . Among the mass proxies from scaling relations, the high value of is probably the most uncertain. This is due to the large scatter in the relation and in this unrelaxed cluster we may expect some projected substructure outside projected onto the main cluster component. On the other hand the parameters and are quite reliable proxies. We account for this by using different weights for the parameters in the averaging process. For the weight is 0.75, while for all other parameters the weight used is 1. Thus the weight for and is effectively 1.5 as depends on both and . For the uncertainty of the combined mass result we use the relative error of . The same procedure is also used for the other clusters.
For the second, south-west component of RXCJ1230.7+3439 we note in Table 9 quite consistent values for the mass from the observables and the model with the fixed -value in the range of 2.3 - 2.9 keV. Here one can question if this component has been affected by extra heat from the interaction with the main component, which would result in a temperature that is higher than what corresponds to the mass of the object. But since the mass obtained from the temperature as observable is not much larger than the values from the other proxies and since this component is separated from the main body, this effect cannot be very large.
For the eastern component the effect of interaction heating is probably more serious. This would certainly effect the temperature of 3.3 keV as a mass proxy. Using the observed X-ray luminosity and the relation, we would predict a temperature of only 2.45 keV, supporting the idea that the cluster component is heated by the interaction. Since the X-ray surface brightness distribution of this component is quite irregular and cannot easily be modeled, a hydrodynamical mass model seems not appropriate. Therefore we only use the X-ray luminosity and the gas mass as a tentative proxy for the mass of this cluster part.
Finally we can compare the X-ray determined mass of this system to the dynamical mass determined from the galaxy velocities by Barrena et al. (2022). For the main component the dynamical mass with a value of M⊙ is higher by about 40% than the values obtained from the X-ray observation. This can again be attributed to the unrelaxed state of the cluster. In the study by Saro et al. (2013) based on numerical cosmological simulations they find a scatter in the correlation of and of about 30-40%, where has been determined in a way mimicking real observations. Since we expect to find very unrelaxed clusters in the high part of the scatter, this discrepancy is not too surprising. A more important reason for the different results may, however, come from the fact, that the galaxies with redshifts cover a larger region on the sky than the aperture with a radius of used in the X-ray study. We therefore determined the velocity dispersion also for the 47 galaxies with redshifts inside and find a lower velocity dispersion of km s-1, which points to a mass of about M⊙, in better agreement with the mass estimate from the X-ray data.
For the south-western component and the mass from X-ray observations are similar. Also for the eastern component the results for the X-ray and dynamical mass are close.
In summary, we confirm that RXCJ1230.7+3439 is a massive, dynamically young cluster system, with a core region with a mass around M⊙. The sum of the components leads to a total mass of the system of M⊙ from the X-ray data and M⊙ from the optical data.
4.2 RXCJ1310.9+2157 and RXCJ1310.4+2151
For the cluster RXCJ1310.9+2157 we find masses of M⊙ for the different mass estimates shown in Table 9, excluding the result for the low value. Thus we have results which are all consistent with the finally adopted value of the mass of M⊙. The structure of the cluster is less complex as in the case of RXCJ1230.7+3439 and therefore the result is more clear.
RXCJ1310.4+2151 is elongated and has more substructure. Here we find a larger range of resulting masses, M⊙. The mass estimates involving the intracluster medium temperature are lower than those derived from X-ray luminosity and gas mass. This indicates that the virialised part of the cluster is smaller than the system contributing to the total X-ray luminosity and gas mass. In other words the cluster is not fully virialsed, as can be expected from the asymmetric X-ray appearance. The finally adopted total mass of M⊙ may rather be slightly underestimated.
4.3 RXCJ1414.6+2703
RXCJ1414.6+2703 appears very compact and symmetric. Again we observe that the different mass estimates deliver consistent results. We note a mass range of the estimates of M⊙, which amounts to only . The values are well consistent with the finally adopted result of M⊙.
4.4 RXCJ2116.2-0309
In this case we have a partial overlap of two clusters in the line-of-sight. This complicates the analysis. For the southern, distant target cluster we obtain mass estimates in the range of M⊙. The highest mass estimate comes from the X-ray luminosity as proxy. This may be affected by projection effects as well as the second largest value from the gas mass proxy. The temperature on the other hand yields a low value. As a finally adopted value we get M⊙, where we have increased the error from a value we obtained with our general scheme of to M⊙, accounting for the projection effects. The final value is thus consistent with all estimates except for the X-ray luminosity proxy.
5 Summary and Conclusions
A major goal of the paper is to provide reliable mass estimates of the target clusters of the XMM-Newton observations, as a reference for further studies, in particular for using them as gravitational lense telescopes. They were selected with the expectation to have masses larger than M⊙. Sufficient data for a structural study and mass determination were only available for four of the targets, while for two targets we have to wait for the new XMM-Newton and Chandra observations awarded to us.
Some of the four well observed cluster systems show either pronounced substructure or are double cluster systems. Because of this complication of dynamically young systems, we performed a critical inspection of several different methods of mass determination to obtain a consistent and reliable picture of the mass estimate. In particular we identify the low value of the slope of the X-ray surface brightness profile as one of the signs of substructure in the outskirts of the cluster, which has to be taken with care, if the data are not sufficient to perform a detailed substructure analysis to remove all substructural features. Therefore we also modeled the clusters with -parameters fixed to a standard value of 2/3. With this approach we obtained consistent results together with mass estimates from several well tested X-ray observables which can be used as mass proxies.
From these results we conclude that all, but one of the four systems satisfy the condition that the overall mass is larger than M⊙. For RXCJ1230.7+3439 this is true if all substructure components are added. This is also confirmed by the determination of the dynamical mass of the cluster from the velocity dispersion of the galaxies. For RXCJ1310.9+2157 and RXCJ1310.4+2151 the mass is larger than the limit considered when both components of the double system are added. For RXCJ1414.6+2703 we get a mass estimate of M⊙ for the compact and round cluster system. For RXCJ1317.1-3821 and RXCJ1717.1+2931the high observed X-ray luminosity indicates massive clusters. But a firm conclusion has to await the analysis of the upcoming observations. Only for RXCJ2116.2+0309 the cluster system is not as massive as expected. In the ROSAT All Sky Survey the X-ray emission of both cluster components is merged into one emission region and the cluster mass was overestimated by attributing the total luminosity to the distant cluster.
The two clusters, for which we still await better X-ray data are both more regular. RXCJ1717.1+2931 is round and compact with a pronounced central surface brightness peak. It definitely has a strong cooling core. The upcoming Chandra observation will be especially useful to unveil the cool core structure. RXCJ1317.1-3821 is not perfectly symmetric and has some interesting structural features in the centre which also will be uncovered in more detail with the future Chandra observation.
Acknowledgements.
We thank the anonymous referee for helpful comments. G.C. acknowledges support by the Deutsches Luft- und Raumfahrtzentrum under grant no. 50 OR 1905. H.B. acknowledges support from the Deutsche Forschungsgemeinschaft through the Excellence cluster “Origins”. R.B. acknowledges support by the Severo Ochoa 2020 research programme of the Instituto de Astrofísica de Canarias. We acknowledge the use of images from the DSS imaging survey provided by NASA/IPAC, the PanSTARRS Digital Sky Survey provided by the University of Hawaii and the Space Telescope Science Institute and the DESI Legacy Imaging Surveys. The DESI Legacy Surveys consist of three individual and complementary projects: the Dark Energy Camera Legacy Survey (DECaLS; Proposal ID 2014B-0404; PIs: David Schlegel and Arjun Dey), the Beijing-Arizona Sky Survey (BASS; NOAO Prop. ID 2015A-0801; PIs: Zhou Xu and Xiaohui Fan), and the Mayall z-band Legacy Survey (MzLS; Prop. ID 2016A-0453; PI: Arjun Dey). DECaLS, BASS and MzLS together include data obtained, respectively, at the Blanco telescope, Cerro Tololo Inter-American Observatory, NSF’s NOIRLab; the Bok telescope, Steward Observatory, University of Arizona; and the Mayall telescope, Kitt Peak National Observatory, NOIRLab. The Legacy Surveys project is honored to be permitted to conduct astronomical research on Iolkam Du’ag (Kitt Peak), a mountain with particular significance to the Tohono O’odham Nation.References
- Appenzeller et al. (1998) Appenzeller, I., Thiering, I., Zickgraf, F. -J. et al., 1998, ApJS,117,319
- Arnaud et al. (2005) Arnaud, M., Pointecouteau, E., Pratt, G.W., 2005, A&A, 441, 893
- Barrena et al. (2022) Barrena, R., Böhringer, H. & Chon G., 2022, (A&A in press), arXiv2205.05597
- Bilicki et al. (2014) Bilicki, M., Jarrett, T.H., Peacock, J.A., et al., 2014, ApLS, 199, 34
- Böhringer et al. (2000) Böhringer, H., Voges, W., Huchra, J.P., et al., 2000, ApJS, 129, 435
- Böhringer et al. (2004) Böhringer, H., Schuecker, P., Guzzo, L., et al., 2004, A&A, 425, 367
- Böhringer et al. (2013) Böhringer, H., Chon, G., Collins, C.A., et al., 2014, A&A, 555, A30
- Böhringer et al. (2014) Böhringer, H., Chon, G., Collins, C.A., et al., 2014, A&A, 570, A31
- Böhringer et al. (2016) Böhringer, H., Chon, G., Kronberg, P.P., 2016, A&A, 596, 22
- Böhringer et al. (2017) Böhringer, H., Chon, G., Retzlaff, J., et al., 2017, AJ, 153, 220
- Borgani et al. (2004) Borgani, S., Murante, G., Springel, V., et al. 2004, MNRAS, 348, 1078
- Bouwens et al. (2014) Bouwens, R.J., Bradley, L., Zitrin, A. et al., 2014, ApJ, 795, 126
- Cavaliere & Fusco-Femiano (1976) Cavaliere, A. & Fusco-Femiano, R., 1976, A&A, 49, 137
- Chon & Böhringer (2017) Chon, G., & Böhringer, H., 2017, A&A, 606, L4
- Croston et al. (2008) Croston, J.H., Pratt, G.W., Böhringer, H., et al., 2008, A&A, 48, 431
- De Grandi & Moldendi (2004) De Grandi, S. & Moldendi, S., 2004, arXiv:astro-ph/0407392
- Dickey (1990) Dickey, J.M. & Lockman, F.J., 1990, ARA&A, 28, 215
- Ellis (2014) Ellis, R.S., 2014, arXiv1411.3330
- Feretti et al. (2012) Feretti, L., Giovannini, G., Govoni, F., et al., 2012, A&ARv, 20, 54
- Fischer et al. (1998) Fischer, J.-U., Hasinger, G., Schwope, A. D., et al., 1998, AN, 319, 347
- Fujimoto et al. (2016) Fujimoto, S., Ouchi, M., Ono, Y., et al., 2016, ApJS, 222, 1
- Gal et al. (2003) Gal, R.R., de Carvalho, R.R., Lopes, P.A.A., 2003, AJ, 125, 2064
- Guzzo (2009) Guzzo, L., Schuecker, P., Böhringer, H., et al., 2009, A&A, 499, 357
- Hao et al. (2010) Hao, J., McKey, T.A., Koester, B.P., et al., 2010, ApJS, 191, 54
- Koester et al. (2007) Koester, B.P., McKey, T.A., Annis, J., et al., 2007, ApJ, 660, 239
- Komossa & Greiner (1999) Komossa, S. & Greiner, J., 1999, A&A, 349, L45
- Kravtsov et al. (2006) Kravtsov, A.V., Vikhlinin, A., Nagai, D., 2006, ApJ, 650, 128
- Lopes et al. (2004) Lopes, P.A.A., de Carvalho, R.R., Gal, R.R., et al., 2004, AJ, 128, 1017
- Mantz et al. (2014) Mantz, A.B., Allen, S.W., Morris, R.G., 2014, MNRAS, 440, 2077
- Mazzotta et al. (2004) Mazzotta, P., Rasia, E., Moscardini, L., et al., 2004, MNRAS, 354, 10
- McLeod et al. (2016) McLeod, D.J., McLure, R.J., Dunlop, J.S., 2016, MNRAS, 459, 3812
- Nagai (2006) Nagai, D., 2006, ApJ, 650, 538
- Nagai et al. (2007) Nagai, D., Kravtsov, A., Vikhlinin, A., 2007, ApJ, 668, 1
- PLANCK Collaboration (2016) PLANCK Collaboration 2016, A&A,594, A27
- Pratt et al. (2007) Pratt, G.W., Böhringer, H., Croston, J.H., et al. 2007, A&A, 461, 71
- Pratt et al. (2009) Pratt, G.W., Croston, J.H., Arnaud, M., et al., 2009, A&A, 498, 361
- Rasia et al. (2012) Rasia, E., Meneghetti, M., Martino, R., et al., 2012, NJph, 14, 4269
- Rozo et al. (2015) Rozo, E., Rykoff, E.S., Becker, M., et al., 2015, MNRAS, 453, 38
- Sarazin (2002) Sarazin, C.L., 2002, in Merging Processes in Galaxy Clusters, L. Ferretti, I.M. Gioia, G. Giovannini (eds.) Kluver Acad. Publ., p. 1
- Saro et al. (2013) Saro, A., Mohr, J.J., Bazin, G., et al., 2013, 772, 47
- Saxton et al. (2021) Saxton, R., Komossa, S., Auchetti, K., et al., 2021, Space Sci Rev, 217, 18
- Sazonov et al. (2021) Sazonov, S., Gilfanov, M., Medvedev, P., et al., 2021, MNRAS, 508. 3820
- Sunyaev & Zeldovich (1972) Sunyaev, R.A. & Zeldovich, Ya.B., 1972, CoASP, 4, 173S
- Trümper (1993) Trümper, J., 1993, Science, 260, 1769
- Vikhlinin et al. (2006) Vikhlinin, A.; Kravtsov, A.; Forman, W., et al., 2006, ApJ, 640, 691
- Vikhlinin et al. (2009) Vikhlinin, A., Kravtsov, A.V., Burenin, R.A. et al., 2009, ApJ, 692,1060
- Voges (1999) Voges, W., Aschenbach, B., Boller, T., et al. 1999, A&A, 349, 389
- Wen et al. (2009) Wen, Z.L., Han J.L., & Liu, F.S., 2009, ApJS, 183, 197; 2010, ApJS, 187, 272
- Wen et al. (2010) Wen, Z.L., Han, J.L., Liu, F.S., 2010, ApJS, 187, 272
- Wen et al. (2012) Wen, Z.L., Han, J.L., Liu, F.S., 2012, ApJS, 199, 34
- Wen & Han (2015) Wen, Z.L. & Han, J.L., 2015, ApJ, 807, 178
- Zhang et al. (2008) Zhang, Y.-Y., Finoguenov, A., Böhringer, H., et al. 2008, A&A, 482, 451
Appendix A Properties of the observed low redshift clusters
In this section we describe the properties of the low redshift clusters () which appear in the observation fields of the target clusters.
| name | R..1311+2201 | RXCJ1414+2711 | RXCJ2116-0306 |
|---|---|---|---|
| RA | 13 11 46.4 | 14 14 22.1 | 21 16 10.7 |
| DEC | +22 01 37 | +27 11 26 | -03 06 17 |
| spec. za | 0.1707 (8) | 0.1619 (11) | 0.2252 (3) |
| BCG zb | 0.1715 | 0.1578 | 0.2255 |
| X-ray z | 0.16 | 0.23 | |
| FX | |||
| LX | 0.22 | ||
| TX | |||
| Mgas | 1.6 | 0.70 | 1.6 |
| rc | 0.22 | 0.13 | 0.77 |
| 0.36 | 0.40 | 0.54 |
Notes The meaning of the parameters is the same as in Table 3.
a) The integers in brackets give the number of galaxies available
for the cluster redshift determination.
b) The redshift of the BCG of RXCJ1311.7+2201
is from the 2MASS galaxy survey (Bilicki et al., 2014),
the redshift of the BCG from SDSS data release 6 (2007) for RXCJ1414.3+2711,
and the redshifts of the BCG of RXCJ2116.1-0306 from the 2MASS redshift survey
(Bilicki et al., 2014).
| mass | 1311 | 1414N | 2116N |
|---|---|---|---|
| 0.8 | 0.55 | 1.24 | |
| 2.0 | 1.16 | 1.7 | |
| 1.8 | 1.2 | 1.5 | |
| 2.0 | 1.15 | 1.8 | |
| 1.85 | 0.92 | 1.8 | |
| 1.8 | 0.91 | 1.7 | |
| 1.9 | 1.06 | 1.7 | |
| 4.63 | 4.01 | 3.60 |
Notes: The meaning of the rows are the same as for Table 9
A.1 RXCJ1311.7+2201
Its X-ray flux of erg s-1 cm is below the flux-limit for the CLASSIX survey and thus not contained in its catalog. But as a cluster well detected in the ROSAT All-Sky Survey, it receives the name, RXCJ1311.7+2201. This galaxy cluster, which was identified in the NORAS survey (Böhringer et al., 2000), has a redshift of . It was also detected in the SDSS (Koester et al., 2007; Hao et al., 2010; Wen et al., 2010). Table 10 provides information on redshift and X-ray properties of the clusters. An X-ray image of the cluster is shown in Fig 4 on the left hand side. The cluster displays an extension from the compact center towards the northwest. Fig. 19 presents an overlay of X-ray contours on an optical PanSTARRS image. We note a bright lenticular BCG at the peak of the X-ray emission.
In the analysis of the X-ray spectra in different circles and rings at radii, , , and arcmin ( kpc), we find temperatures of , , and keV, respectively. A temperature profile with a polytropic index of 1.2 or larger would be inconsistent with the data. Cluster properties derived from these data are given in Table 10. The different mass estimates listed in Table 11 give consistent results with a final mass of M⊙. The system shows a central cooling time of 5.6 Gyr and has thus no cooling core.
A.2 RXCJ1414.3+2711
The cluster RXCJ1414.3+2711, which was noted during the NORAS II survey was also found in the Northern Sky Optical Cluster Survey (Lopes et al., 2004). An x-ray image in the 0.5 to 2 keV energy band of the field of the target cluster RXCJ1414.3+2711 is shown in Fig. 9. The cluster has a central component and an extension towards the south-east. Table 10 provides information on redshift and X-ray properties of the clusters.
In the analysis of the X-ray spectra we find for , , and arcmin ( kpc), temperatures of , , and , respectively.
X-ray contours superposed on a DSS image for RXCJ1414.3+2711 are shown in Fig. 20. This cluster also shows a BCG at the X-ray maximum and we observe two bright galaxies marking the extension towards the south-east. The redshifts for the three bright galaxies are from north to south: (SDSS DR 6), (Bilicki et al., 2014), and (Bilicki et al., 2014).
The mass estimates span a small range of M⊙, which are all consistent with the finally adopted value of M⊙ (see Table 11). The extension is, however, not included in this mass estimate.
A.3 RXCJ2116.1-0306
The foreground cluster RXCJ2116.1-0306, with its center about three arcmin north of the distant target cluster RXCJ2116.2-0309 is quite extended on the sky and shows some elongation in the north-south direction. Table 10 provides information on redshift and X-ray properties of the clusters. The cluster can be seen in the X-ray image given in Fig. 16.
Fig. 17 shows an image of the X-ray surface brightness contours overlayed on an optical i-band image from the PanSTARRS survey and a colour image from the Legacy Imaging Surveys. The cluster RXCJ2116.1-0306 has a BCG at its center.
For RXCJ2116.1-0306 we obtained temperatures of , , , and kev in regions of , , and arcmin ( kpc), respectively. The cluster shows a central cooling time of the ICM of about 3 Gyr, which can be taken as a sign of a moderate cooling core.
The mass estimates are confined to a range of M⊙. All estimates are consistent with the finally adopted mass value of M⊙ (see Table 11).
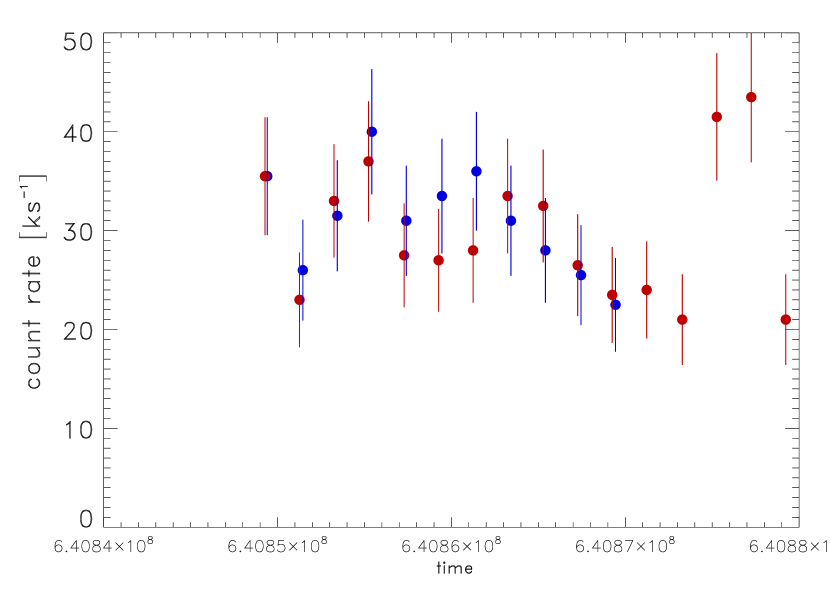
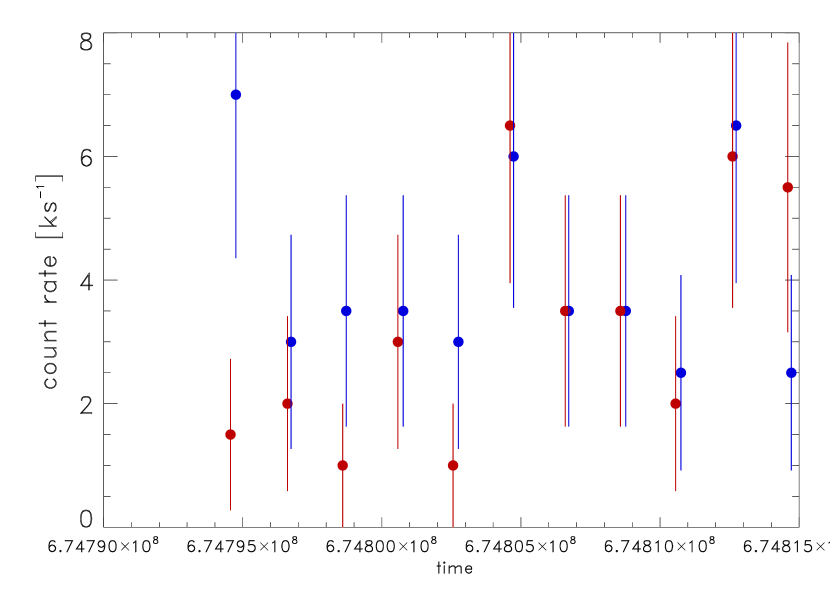
Appendix B The variable X-ray source, XMMUJ2116.2-0311
The X-ray source XMMUJ2116.2-0311 is covered by the two observations 0803410701 (obs. A) and 0841900601 (Obs. B) from 23.4. 2018 and 21.5.2019, respectively. Fig. 21 shows light curves of the source in the two epochs of observation in the 0.5 to 5 keV band in bins of 2 ks as recorded by the MOS 1 and 2 detectors. The PN detector data cover shorter time intervals. The extraction region for the count rate was 30 arcsec. After background subtraction the mean count rate corrected for missing flux for a point source in the extraction aperture in the first observation is 29.8 () ks-1 and in the second observation 3.6 () ks-1, a change by a factor of 8.3. The corresponding 0.5 to 2 keV flux is 1.86 ( erg s-1 cm-2 and 2.1 ( erg s-1 cm-2. The optical image of the counterpart appears as a point-like source in the PanSTARRS image (Fig. 17). The X-ray source is most probably an AGN which changed its accretion rate or went through a special accretion event in 2019. Assuming that the two detections of the source are associated to temporary and now fading X-ray emission the source can also be interpreted as a tidal disruption event of a star accreted by a supermassive black hole, e.g. Komossa & Greiner (1999); Saxton et al. (2021); Sazonov et al. (2021). The observation of the sky position in the ROSAT All-Sky Survey with an exposure time of 445 s does not help to determine if this is a temporary source, since in the presence of the extended cluster emission we can only derive an upper limit for the flux of about erg s-1 cm-2, insufficient to rule out the presence of the source in the ROSAT Survey.