11email: {hrvoje.leventic,marin.bencevic,marija.habijan,irena.galic}@ferit.hr
22institutetext: TELIN-IPI, Faculty of Engineering and Architecture,
Ghent University – imec, Belgium
22email: danilo.babin@ugent.be
A Survey of Left Atrial Appendage Segmentation and Analysis in 3D and 4D Medical Images ††thanks: Supported in part by the Croatian Science Foundation under project UIP-2017-05-4968.
Abstract
Atrial fibrillation (AF) is a cardiovascular disease identified as one of the main risk factors for stroke. The majority of strokes due to AF are caused by clots originating in the left atrial appendage (LAA). LAA occlusion is an effective procedure for reducing stroke risk. Planning the procedure using pre-procedural imaging and analysis has shown benefits. The analysis is commonly done by manually segmenting the appendage on 2D slices. Automatic LAA segmentation methods could save an expert’s time and provide insightful 3D visualizations and accurate automatic measurements to aid in medical procedures. Several semi- and fully-automatic methods for segmenting the appendage have been proposed. This paper provides a review of automatic LAA segmentation methods on 3D and 4D medical images, including CT, MRI and echocardiogram images. We classify methods into heuristic and model-based methods, as well as into semi- and fully-automatic methods. We summarize and compare the proposed methods, evaluate their effectiveness, present current challenges in the field and approaches to overcome them.
Keywords:
Left atrial appendage Left atrial appendage closure Left atrial appendage occlusion Image analysis Image segmentation1 Introduction
Cardiovascular diseases (CVDs) have been identified as the leading cause of death in the developed world, with stroke accounting for about a third of all CVD deaths [28]. Atrial fibrillation (AF) is a CVD identified as one of the main risk factors for stroke [7]. Atrial fibrillation presents as asynchronous chaotic contractions of the atria. The atrium fibrillates, i.e. contract outside the standard regular sinus rhythm of the heart. The blood pools in the atria, enabling the formation of a blood clot, which can cause a stroke if it becomes dislodged and enters the bloodstream. The majority of strokes due to AF are caused by clots originating in the left atrial appendage (LAA) [4]. While the prevention of stroke due to AF is commonly done with anticoagulation therapy (i.e. warfarin), patients often have contraindications to this type of therapy. Left atrial appendage occlusion (LAAO) is an alternative stroke prevention procedure which avoids most of the drawbacks of anticoagulation therapy. During the procedure, a device is percutaneously deployed into the neck of the LAA which prevents the blood flow to the appendage, and stops the blood clot from exiting the appendage and entering the circulatory system.
Multiple occluder devices are available on the market. Device choice is dependent on the patient’s LAA anatomy, as it can vary significantly between patients. Wang et al. [27] classify LAA morphology into four types: chicken-wing (48% of patients), cactus (30%), windsock (19%) and cauliflower (3% – most often associated with embolic events). Choosing the correct device for the patient’s anatomy requires accurate measurements of the heart and the appendage. The measurements can be obtained using medical imaging such as transesophageal echocardiography (TEE), standard fluoroscopy and computed tomography (CT).
While the procedure can be performed using standard fluoroscopy and TEE, using a pre-procedural CT imaging to plan the procedure and to guide the sizing of the device has shown benefits, including better prediction of the appropriate device size [22, 25], and better determination of patient’s suitability for the procedure [25]. Often, physicians perform the measurements directly in 2D slices of different multi-planar reconstruction (MPR) views. Accurate image processing methods for segmentation and analysis of the LAA can aid physicians in reducing the time to plan the occlusion procedure, by calculating the required measurements and visualizing the appendage using an accurate 3D model. Accurate LAA segmentation methods can also be used in a workflow for diagnosing atrial fibrillation [15], or predicting if the patient is at an increased risk of thrombus formation [3]. It can also provide more accurate measurements of other clinically important parameters like LAA emptying velocity [3].
The goal of this paper is to provide a review of the current state-of-the-art methods in LAA segmentation and analysis in 3D and 4D medical images. The paper is organized as follows. Section 2 provides an overview of methods which focus on LAA segmentation from 3D and 4D medical images. Section 3 provides an overview of methods which focus on predicting the risk of atrial fibrillation development or thrombus formation. A discussion about the current state of the research is given in Section 4. Finally, Section 5 gives a conclusion.
2 LAA segmentation methods
This section covers the state-of-the-art methods for the segmentation of the left atrial appendage. Segmentation approaches presented in this section can be divided into two segments: heuristics-based methods (section 2.1) and model-based methods (section 2.2). Presented approaches can also be divided according to the degree of user interaction required: into fully automatic methods and semi-automatic methods. LAA segmentation is still often performed manually as well, using guided region-growing-based segmentation methods [6] and software such as 3D Slicer [10]. However, this paper is focused on approaches designed specifically for LAA segmentation.
2.1 Heuristics-based segmentation methods
This section presents heuristics-based LAA segmentation methods. Most of the methods described in this section are based on a modification of region growing. Likewise, most of the methods are semi-automatic and require user interaction. Some methods require one or more user-selected seed points [24, 16], thresholds [16], or a user provided centerline through the LAA [18].
Morais et al. [18] proposed a centerline based LAA segmentation approach which works in 3D TEE images. The approach initializes a model from a manually created centerline, grows the model using fast contour growing and determines the segmentation from the refined model. The method is evaluated on 20 TEE datasets manually segmented by two observers. Metrics used to evaluate the method were: point-to-surface error (P2S), Dice similarity and 95th percentile Hausdorff distance. Obtained results were close to the inter- and intra-observer variability. Dice similarity score was around 82.5%. The method runtime is under 20 seconds with an Intel i7 CPU at 2.8 GHz.
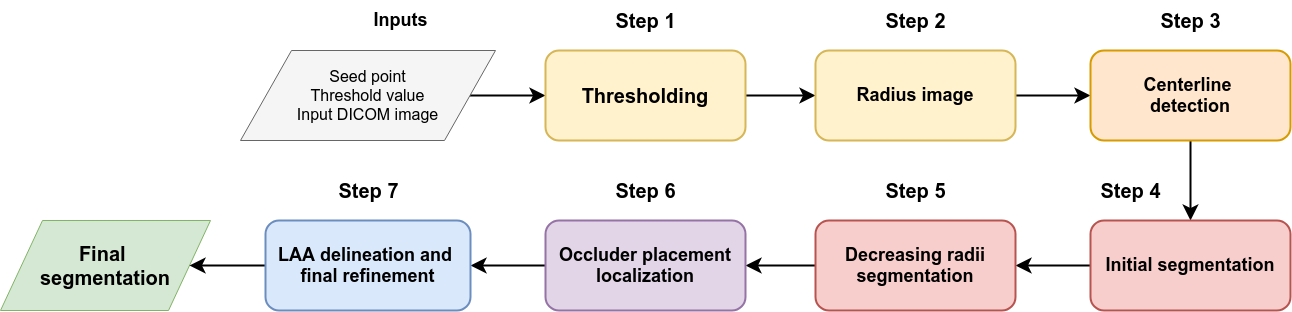
Our own proposed semi-automatic LAA segmentation framework is presented in [16, 24] and illustrated in Figure 1. The framework requires a single seed point (single click) inside the LAA. An input CT image is first thresholded using an adaptive thresholding method to produce a binary mask image. Radius image is calculated from the mask image using Euclidean distance transform (EDT) and used to extract a centerline connecting the seed point to the center of the left atrium. The method reconstructs an approximate LAA volume from the centerline by combining the largest maximum inscribed spheres of every point in the centerline. Then, a novel decreasing radii segmentation algorithm is used to refine the segmentation. Finally, the localization of the LAA orifice is performed by finding a plane delineating the LAA from the left atrium, thus proposing a location for the occluder placement. The method is invariant to the type and dimensions of the input image used for segmentation, as it can work with binary images created from any type of 3D image (CT, MRI, etc.), so long as it contains the LAA and at least a part of the left atrium. The method is validated against 17 CT datasets manually segmented by two medical experts. Dice similarity score is 91.54% and 87.93% (against the two expert segmentations) when using automatic threshold detection, or 92.52% and 91.53% when selecting the threshold value manually.
Moghadam A. et al. [1] propose a semi-automatic method to segment the LAA device landing zone from echocardiogram images for the purpose of LAA occlusion procedures. Optimal 2D axial slices are selected by an expert for each echo dataset. LAA appears as an ellipsoidal dark region, which their algorithm aims to detect. Each slice is first shifted to the same region of interest. The slice is then smoothed using a Gaussian filter, gamma corrected and sharpened. The image is thresholded and binarized, producing an image with several black holes. 8-adjacent black pixels (pixels for which each neighboring pixel has the same value) represent the segmentation. The area, perimeter, dimensions and position of the segmented regions is used to refine the segmentation of the LAA landing zone. The authors report correct segmentation for 18 out of 22 (81.8%) echo datasets, the algorithm failed to obtain a segmentation for the remaining cases. The authors do not perform validation of the accuracy of the successful segmentations.
Jia et al. [11] proposed an automatic LAA segmentation method for the purpose of computational fluid dynamics (CFD) simulation. The method automatically detects a seed point in the LA by detecting the ascending and descending aorta in an axial view and utilizing the fact that the LA is located between them. The segmentation is performed using a Bayesian inference region-growing method and the detected seed point. Several parameters in the method are determined either empirically, or from the knowledge of the heart anatomy. The runtime of the method is between 0.5-1 min and it achieves a Dice similarity score of 86.3%. However, the method is only validated on 5 ground truth images.
2.2 Model-based segmentation methods
This section presents model-based LAA segmentation methods. These include machine and deep learning based approaches, as well as other methods that include learned models like atlas-based segmentation. Until recently, only a few fully automatic segmentation methods were published in the literature. However, the advancement deep neural networks for segmentation resulted in a several new fully automatic segmentation approaches being proposed.
Atlas-based segmentation utilizes atlases, images that are labeled maps of structures that need to be segmented [21]. Atlases are usually obtained via manual segmentation by an expert. Those atlases can then be used to segment new unseen images through a process called registration. Registration transforms and deforms an input image such that the structures on the image map onto the same structures of a target image. Mathematical scoring functions are used to determine how well one image maps onto the other. In atlas-based segmentation, input images are registered to one or more atlas images. Once registered, the segmentation is performed by finding the corresponding atlas label on the registered image for each pixel of the input image. Atlas-based segmentation requires fewer annotated images than machine-learning-based methods [20, 29].
Usually atlas-based segmentation is done by using multiple atlas images. The input image is registered onto each atlas separately, and the segmentation results are then fused using different mathematical criteria. This approach often suffers from a "diminishing distal part" problem: Segmentation is worse at the edges of an object than at the center.
Qiao et al. [20] present a fully automatic method to segment the LA chamber, pulmonary veins and LAA from MRA (magnetic resonance angiography) images from the MICCAI’13 LASC challenge [23]. They use atlas-based segmentation which aims to reduce the diminishing distal part problem. They register all atlases to the image in a single step by formulating the registration as a group objective function optimization process. Their algorithm optimizes the variance between registrations of each atlas, thus jointly registering the input image to all atlases without losing accuracy at the edges of the segmented regions. The method runtime is around 9 minutes per scan. They use 10 MRA scans for training, and another 20 for testing. The reported Dice similarity score for LAA segmentation is 91%.
Another common model-based approach for image segmentation is machine learning. Machine learning for image segmentation is usually done by extracting a selection of features from images. These features often include pixel gray levels, pixel locations, image moments, information about a pixel’s neighborhood, etc. A vector of image features is then fed into a learned classifier which classifies each pixel of the image into a class. The parameters of the classifier are learned automatically by giving the classifier input images for which the ground truth classification results is known. The output of the model can then be compared to the ground truth, and the parameters of the model are adjusted so that the model’s output better matches the ground truth value. This procedure is repeated for a large amount of input images, so that the learned parameters generalize to new, unseen examples. The process of adjusting the model’s parameters is called training.
Deep learning, a subset of machine learning, eliminates the need for pre-programmed feature extraction. Instead, the feature extraction itself is learned by the model during training. Deep-learning based image segmentation is commonly done using convolutional neural networks (CNNs). Convolutional neural networks have a layered structure where series of convolutions are performed on an input image. Kernels of the convolutions are learned during training. The convolution results are then combined using a learned statistical model that outputs a segmented image.
The first two fully automatic methods for LAA segmentation were proposed by Zheng et al. [29, 30] and evaluated in the LASC challenge [23]. The methods are referred to as SIE-PMB and SIE-MRG respectivelly in the challenge. Zheng et al. (SIE-PMB) [29] uses a multi-part based model fitting approach to automatically segment the left atrium, including the LAA and the pulmonary veins. Each of the six parts of the model is fitted individually using marginal space learning (MSL) and later merged into a consolidated mesh. This method was trained on an in-house CT dataset of 457 cardiac CT scans, one of the largest training datasets reported in the literature. Main limitation of the method is the size of the dataset required for training, while the main strength is the computational efficiency: the complete LA segmentation (including the LAA) in 3 seconds on a multi-core CPU. The second approach (SIE-MRG) [30] uses a similar multi-part based approach. The difference is that segmentation refinement using region-growing based with adaptive thresholds is performed after model fitting, followed by graph-cuts-based removal of the leakage. The region-growing-based refinement allows better capturing of the varying morphology of the LAA, as well as the trabeculations inside the LAA.
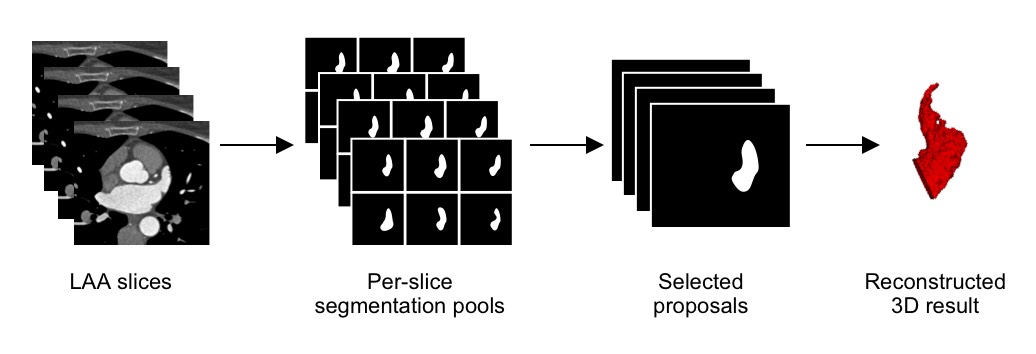
A semi-automatic LAA segmentation method was proposed by Wang et al. [26]. The method segments the LAA from 3D cardiac CTA images using an approach based on ranking 2D segmentation proposals. The flowchart of the proposed method is shown in Figure 2. Initally, the method requires manual determination of the LAA bounding box. Next, the method processes all slices of the determined LAA volume and for each slice creates a pool of segmentation proposals. A trained random forest regressor picks the best segmentation proposal for each slice. Finally, best proposals are merged into a 3D volume using spatial continuity to correct possible segmentation errors. The method was evaluated on 60 CTA datasets and achieved a Dice score of 95.12%. The method takes about 3.5 minutes on a 4 CPU system (4 Intel Core i7 CPUs at 4.0GHz) to perform the segmentation.
Jin et al. [14] proposed a method for LAA neck modelling to aid in occlusion procedure planning. The method segments the LAA using [26], automatically detects the LAA ostium, and calculates the neck dimensions. Ostium is detected as a smooth closed boundary of the highest surface curvature located in the transitional region between the LA and the appendage. Finally, the method models the tension of the LAA surface after the closure procedure. The method is evaluated on 100 CT datasets and 3 pig hearts, with the post-procedural follow-up of 67 patients indicating the 97.01% success rate of occluder device implantation (only two failed implantation cases).
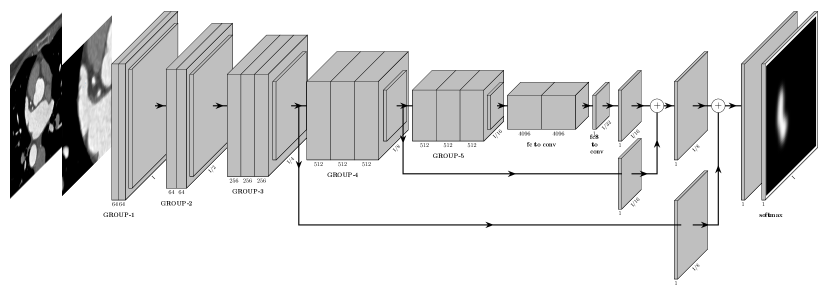
Jin et al. also proposed an LAA segmentation method [12] based on fully convolutional neural networks and conditional random fields. The method is an improvement of [26] and uses a similar approach: LAA is segmented in each 2D slice of the manually provided bounding box. Slices are pre-processed and converted to 3-channel RGB pseudo color images to enhance the resolution of local features. Pseudo color images are input to the CNN (architecture in Figure 3) which outputs 2D probability maps of the regions containing the appendage. The final segmentation step merges the 2D probability maps using 3D conditional random fields into a final 3D volume. Training and evaluation is performed on 150 CCTA datasets using five-fold cross-validation. Achieved Dice overlap with the ground truth is 94.76%. The runtime on a single LAA volume is around 35 seconds on a Tesla K80 GPU.
Grasland-Mongrain et al. [8] propose an adaptation of active shape models (ASM) [5] for LAA segmentation. The heart is localized and segmented with shape-constrained deformable models (ASM-based approach from [5]). The model-based approach segments the heart chambers and determines the position of the appendage. The localized appendage (the part of the mesh denoting LA-LAA interface) is inflated in order to obtain the segmentation, using the minimization of the internal and external energy. The external energy pushes the mesh towards the appendage edges, while the internal energy preserves a regular triangle distribution during the inflation. The method has been evaluated on images from 17 patients. The inflation of the mesh has problems reaching the tip of the appendage, as well as undersegmenting the appendage. The method is also sensitive to the selection of parameters for the segmentation.
Al et al. [2] proposed an automatic LAA segmentation method using actor-critic reinforcement learning. First, actor-critic agents localize LAA and LSVP seed points. Seed expansion following surface trend using EDT provides a starting segmentation and creates a volume-of-interest (VOI). Finally, the method classifies each voxel in VOI into LAA class and LSVP class, depending on which seed is closer. The method is evaluated on 28 annotated volumes and achieves 93.64% Dice similarity score, with the runtime of around 8 seconds per dataset.
3 4D LAA analysis methods and CFD
3.0.1 4D LAA analysis methods
Jin et al. proposed two 4D-based LAA analysis methods [13, 15]. The method in [13] performs the segmentation of 4D CT LAA images to assist AF diagnosis. A 3D model of each time instance of the sequence is built using their graph-cuts based segmentation approach [26]. The method assists in AF diagnosis by: (1) calculating the volume of 3D models in different phases of the cardiac cycle; (2) generating the "volume-phase" curve (showing the change of LAA volume throughout the cycle); and (3) obtaining important dynamic LAA metrics. Finally, multivariate logistic regression analysis of the obtained metrics calculates the risk of thrombus formation, while the SVM-based model predicts the AF diagnosis.
The method in [15] detects the substances inside the LAA from 4D CT images using spatio-temporal motion analysis. The method extracts the optical flow field for all adjacent phases in a cardiac cycle. The cardiac cycle of 20 phases results in 19 optical flow fields. The method generates the motion trajectory of the key voxels throughout the cycle using nearest neighbour interpolation. Hierarchical clustering tree finds the corresponding classification for every trajectory track. Changes in classifications between the tracks correspond to the division of substances in the appendage. Finally, time-frequency analysis of the trajectories enables the detection of different substances inside the appendage, including the thrombi in different states of formation.
3.0.2 LAA analysis using CFD
Computational fluid dynamics (CFD) can be used for LAA analysis by calculating important hemodynamic parameters such as LAA emptying velocity and visualizing the flow of blood through the LAA. Bosi et al. [3] estimated blood residence time in the LAA in four typical LAA morphologies using virtual contrast agent washing out, while imposing both healthy and AF conditions. While TEE can be used to measure blood flow velocity in the LAA, it can only provide average information on the velocity values. CFD approaches can visualize the regions where blood pools in the LAA for longer than a single cardiac cycle. They had to manually segment the LA and the LAA to perform the CFD simulations.
Other works [19, 17] also proposed a computational approach for personalized blood flow analysis from patient’s CT images. However, they also perform manual segmentation of the LAA and heart chambers. Similar work was proposed by Grigoriadis et al. [9]. They used CFD to simulate LAA blood flow for 3 patients, using semi-automatically segmented CT images. Their simulations showed that blood velocity and wall shear stress of the LAA are decreased along the LAA, thus making the tip of the LAA more prone to fluid stagnation.
Jia et al. [11] proposed a simulation framework which, using patient specific CT images, evaluates the clinical impact of the LAA, as well as the efficacy of the LAA closure. The framework implements an automatic LAA segmentation method, described in 2.1. They perform the simulations in both pre- and post-closure images and the framework successfuly predicts patient-specific outcome of LAA closure. However, the CFD analysis is only performed for one patient.
4 Discussion
We have divided the presented methods into two general categories: heuristics-based methods and model-based methods. Presented methods could also be categorized by the amount of user interaction required for successful segmentation. Until recently there were only a few fully automatic methods in the literature. Lately, a number of fully automatic methods has been published. Two main advantages of automatic methods are: reducing the subjectivity of the segmentation and saving the expert’s time. However, the advantage of semi-automatic methods is in providing the expert the control over the segmentation process and the ability to correct the segmentation if errors occur, while still reducing the time required to perform the segmentation.
With the advancements in the computing power, blood flow simulations using computational fluid dynamics show great potential for personalized medicine. Some of the potential uses of CDF simulations are non-invasive prediction of the risk of thrombus formation, AF diagnosis, prediction of the success of the occlusion procedure, etc. However, the availability of fast and accurate segmentation algorithms could greatly advance the proliferation of the CDF simulation use in everyday clinical practice.
Nonetheless, comparing different segmentation approaches is quite challenging. To the best of our knowledge, there are no public LAA segmentation datasets available. Almost all presented approaches use in-house datasets. Datasets often contain low number of images and ground truth segmentations are created by in-house medical experts. However, several papers [16, 18] have shown non-negligible subjectivity between the ground truth segmentations from different medical experts. The approaches that quantify and highlight this subjectivity are mostly heuristics-based, since these approaches do not require definite ground truth segmentations for training. Approaches based on machine- and deep-learning require a single correctly labeled ground truth for every image in the dataset. Thus, such approaches use a consensus of multiple medical experts in creating the ground truth labels [12, 26].
5 Conclusion
This paper presents a review of the state-of-the-art methods for LAA segmentation and analysis. We categorized the methods according to training type and required user interaction, presented the methods and discussed their strengths and limitations. Our analysis demonstrated that the last few years have shown great advancement in the area of LAA segmentation and analysis. However, there is still room for improvement. Solving the problem of accurate and fast LAA segmentation could increase the level of care provided to AF and CVD patients, through advancing other uses such as CFD blood flow simulations.
References
- [1] A, P.M.: A semi-automated algorithm for segmentation of the left atrial appendage landing zone: Application in left atrial appendage occlusion procedures. Journal of Biomedical Physics and Engineering 10(2) (Apr 2020). https://doi.org/10.31661/jbpe.v0i0.1912-1019, https://doi.org/10.31661/jbpe.v0i0.1912-1019
- [2] Al, W.A., Yun, I.D.: Actor-Critic Reinforcement Learning for Automatic Left Atrial Appendage Segmentation. In: 2018 IEEE International Conference on Bioinformatics and Biomedicine (BIBM). pp. 609–612 (Dec 2018). https://doi.org/10.1109/BIBM.2018.8621575
- [3] Bosi, G.M., Cook, A., Rai, R., Menezes, L.J., Schievano, S., Torii, R., Burriesci, G.: Computational Fluid Dynamic Analysis of the Left Atrial Appendage to Predict Thrombosis Risk. Front Cardiovasc Med 5 (Apr 2018). https://doi.org/10.3389/fcvm.2018.00034
- [4] Cabrera, J.A., Saremi, F., Sánchez-Quintana, D.: Left atrial appendage: Anatomy and imaging landmarks pertinent to percutaneous transcatheter occlusion. Heart 100(20), 1636–1650 (Oct 2014). https://doi.org/10.1136/heartjnl-2013-304464
- [5] Ecabert, O., Peters, J., Schramm, H., Lorenz, C., Von Berg, J., Walker, M.J., Vembar, M., Olszewski, M.E., Subramanyan, K., Lavi, G., et al.: Automatic model-based segmentation of the heart in CT images. Med. Imaging IEEE Trans. On 27(9), 1189–1201 (2008), http://ieeexplore.ieee.org/xpls/abs_all.jsp?arnumber=4505365
- [6] García-Isla, G., Olivares, A.L., Silva, E., Nuñez-Garcia, M., Butakoff, C., Sanchez-Quintana, D., Morales, H.G., Freixa, X., Noailly, J., Potter, T.D., Camara, O.: Sensitivity analysis of geometrical parameters to study haemodynamics and thrombus formation in the left atrial appendage. Int. J. Numer. Methods Biomed. Eng. 34(8), e3100 (2018). https://doi.org/10.1002/cnm.3100
- [7] Goldman, M.E., Pearce, L.A., Hart, R.G., Zabalgoitia, M., Asinger, R.W., Safford, R., Halperin, J.L., Investigators, S.P.i.A.F., et al.: Pathophysiologic correlates of thromboembolism in nonvalvular atrial fibrillation: I. Reduced flow velocity in the left atrial appendage (The Stroke Prevention in Atrial Fibrillation [SPAF-III] study). J. Am. Soc. Echocardiogr. 12(12), 1080–1087 (1999), http://www.sciencedirect.com/science/article/pii/S0894731799701057
- [8] Grasland-Mongrain, P., Peters, J., Ecabert, O.: Combination of shape-constrained and inflation deformable models with application to the segmentation of the left atrial appendage. In: Biomedical Imaging: From Nano to Macro, 2010 IEEE International Symposium On. pp. 428–431. IEEE (2010), http://ieeexplore.ieee.org/abstract/document/5490319/
- [9] Grigoriadis, G.I., Sakellarios, A.I., Naka, K., Kosmidou, I., Ellis, C., Michalis, L.K., Fotiadis, D.I.: Computational Fluid Dynamics of Blood Flow at the Left Atrium and Left Atrium Appendage. In: Henriques, J., Neves, N., de Carvalho, P. (eds.) XV Mediterranean Conference on Medical and Biological Engineering and Computing – MEDICON 2019. pp. 938–946. IFMBE Proceedings, Springer International Publishing, Cham (2020). https://doi.org/10.1007/978-3-030-31635-8_114
- [10] Hecko, J., Jiravsky, O., Chovancik, J., Hudec, M., Sramko, M., Sknouril, L.: Data for 3D left atrial printing acquired using open source and free software, with the aim to determine the proper size of left atrial appendage occlured. European Heart Journal 41(ehaa946.0665) (Nov 2020). https://doi.org/10.1093/ehjci/ehaa946.0665
- [11] Jia, D., Jeon, B., Park, H.B., Chang, H.J., Zhang, L.T.: Image-Based Flow Simulations of Pre- and Post-left Atrial Appendage Closure in the Left Atrium. Cardiovasc Eng Tech 10(2), 225–241 (Jun 2019). https://doi.org/10.1007/s13239-019-00412-7
- [12] Jin, C., Feng, J., Wang, L., Liu, J., Yu, H., Lu, J., Zhou, J.: Left Atrial Appendage Segmentation Using Fully Convolutional Neural Networks and Modified Three-dimensional Conditional Random Fields. IEEE J. Biomed. Health Inform. PP(99), 1–1 (2018). https://doi.org/10.1109/JBHI.2018.2794552
- [13] Jin, C., Feng, J., Wang, L., Yu, H., Liu, J., Lu, J., Zhou, J.: Left atrial appendage segmentation and quantitative assisted diagnosis of atrial fibrillation based on fusion of temporal-spatial information. Comput. Biol. Med. 96, 52–68 (May 2018). https://doi.org/10.1016/j.compbiomed.2018.03.002
- [14] Jin, C., Yu, H., Feng, J., Wang, L., Lu, J., Zhou, J.: Left Atrial Appendage Neck Modeling for Closure Surgery. In: Statistical Atlases and Computational Models of the Heart. ACDC and MMWHS Challenges. pp. 32–41. Lecture Notes in Computer Science, Springer, Cham (Sep 2017). https://doi.org/10.1007/978-3-319-75541-0_4
- [15] Jin, C., Yu, H., Feng, J., Wang, L., Lu, J., Zhou, J.: Detection of Substances in the Left Atrial Appendage by Spatiotemporal Motion Analysis Based on 4D-CT. In: Pop, M., Sermesant, M., Jodoin, P.M., Lalande, A., Zhuang, X., Yang, G., Young, A., Bernard, O. (eds.) Statistical Atlases and Computational Models of the Heart. ACDC and MMWHS Challenges. pp. 42–50. Lecture Notes in Computer Science, Springer International Publishing (2018)
- [16] Leventić, H., Babin, D., Velicki, L., Devos, D., Galić, I., Zlokolica, V., Romić, K., Pižurica, A.: Left atrial appendage segmentation from 3D CCTA images for occluder placement procedure. Computers in Biology and Medicine 104, 163–174 (Jan 2019). https://doi.org/10.1016/j.compbiomed.2018.11.006
- [17] Markl, M., Lee, D.C., Furiasse, N., Carr, M., Foucar, C., Ng, J., Carr, J., Goldberger, J.J.: Left Atrial and Left Atrial Appendage 4D Blood Flow Dynamics in Atrial Fibrillation. Circ Cardiovasc Imaging 9(9), e004984 (Sep 2016). https://doi.org/10.1161/CIRCIMAGING.116.004984
- [18] Morais, P., Queirós, S., Meester, P.D., Budts, W., Vilaça, J.L., Tavares, J.M.R.S., D’hooge, J.: Fast Segmentation of the Left Atrial Appendage in 3D Transesophageal Echocardiographic Images. IEEE Trans. Ultrason. Ferroelectr. Freq. Control pp. 1–1 (2018). https://doi.org/10.1109/TUFFC.2018.2872816
- [19] Otani, T., Al-Issa, A., Pourmorteza, A., McVeigh, E.R., Wada, S., Ashikaga, H.: A Computational Framework for Personalized Blood Flow Analysis in the Human Left Atrium. Ann Biomed Eng 44(11), 3284–3294 (Nov 2016). https://doi.org/10.1007/s10439-016-1590-x
- [20] Qiao, M., Wang, Y., Berendsen, F.F., van der Geest, R.J., Tao, Q.: Fully automated segmentation of the left atrium, pulmonary veins, and left atrial appendage from magnetic resonance angiography by joint-atlas-optimization. Medical Physics 46(5), 2074–2084 (Mar 2019). https://doi.org/10.1002/mp.13475, https://doi.org/10.1002/mp.13475
- [21] Rohlfing, T., Brandt, R., Menzel, R., Russakoff, D.B., Maurer, C.R.: Quo vadis, atlas-based segmentation? In: Handbook of Biomedical Image Analysis, pp. 435–486. Springer US (2005). https://doi.org/10.1007/0-306-48608-3_11, https://doi.org/10.1007/0-306-48608-3_11
- [22] Saw, J., Fahmy, P., Spencer, R., Prakash, R., Mclaughlin, P., Nicolaou, S., Tsang, M.: Comparing Measurements of CT Angiography, TEE, and Fluoroscopy of the Left Atrial Appendage for Percutaneous Closure. J Cardiovasc Electrophysiol 27(4), 414–422 (Apr 2016). https://doi.org/10.1111/jce.12909
- [23] Tobon-Gomez, C., Geers, A.J., Peters, J., Weese, J., Pinto, K., Karim, R., Ammar, M., Daoudi, A., Margeta, J., Sandoval, Z., Stender, B., Zheng, Y., Zuluaga, M.A., Betancur, J., Ayache, N., Chikh, M.A., Dillenseger, J., Kelm, B.M., Mahmoudi, S., Ourselin, S., Schlaefer, A., Schaeffter, T., Razavi, R., Rhode, K.S.: Benchmark for Algorithms Segmenting the Left Atrium From 3D CT and MRI Datasets. IEEE Trans. Med. Imaging 34(7), 1460–1473 (Jul 2015). https://doi.org/10.1109/TMI.2015.2398818
- [24] Vdovjak, K., Leventić, H., Habijan, M., Galić, I.: Adaptive Thresholding for Single Click Left Atrial Appendage Segmentation. In: 2019 International Symposium ELMAR. pp. 35–38 (Sep 2019). https://doi.org/10.1109/ELMAR.2019.8918651
- [25] Wang, D.D., Eng, M., Kupsky, D., Myers, E., Forbes, M., Rahman, M., Zaidan, M., Parikh, S., Wyman, J., Pantelic, M., Song, T., Nadig, J., Karabon, P., Greenbaum, A., O’Neill, W.: Application of 3-Dimensional Computed Tomographic Image Guidance to WATCHMAN Implantation and Impact on Early Operator Learning Curve: Single-Center Experience. JACC: Cardiovascular Interventions 9(22), 2329–2340 (Nov 2016). https://doi.org/10.1016/j.jcin.2016.07.038
- [26] Wang, L., Feng, J., Jin, C., Lu, J., Zhou, J.: Left Atrial Appendage Segmentation Based on Ranking 2-D Segmentation Proposals. In: Statistical Atlases and Computational Models of the Heart. Imaging and Modelling Challenges. pp. 21–29. Springer, Cham (Oct 2016). https://doi.org/10.1007/978-3-319-52718-5_3
- [27] Wang, Y., Di Biase, L., Horton, R.P., Nguyen, T., Morhanty, P., Natale, A.: Left Atrial Appendage Studied by Computed Tomography to Help Planning for Appendage Closure Device Placement. J. Cardiovasc. Electrophysiol. 21(9), 973–982 (Sep 2010). https://doi.org/10.1111/j.1540-8167.2010.01814.x
- [28] World Health Organization: The top 10 causes of death worldwide fact sheet. Tech. rep. (2017), http://www.who.int/mediacentre/factsheets/fs310/en/
- [29] Zheng, Y., Barbu, A., Georgescu, B., Scheuering, M., Comaniciu, D.: Four-Chamber Heart Modeling and Automatic Segmentation for 3-D Cardiac CT Volumes Using Marginal Space Learning and Steerable Features. IEEE Trans. Med. Imaging 27(11), 1668–1681 (Nov 2008). https://doi.org/10.1109/TMI.2008.2004421
- [30] Zheng, Y., Yang, D., John, M., Comaniciu, D.: Multi-Part Modeling and Segmentation of Left Atrium in C-Arm CT for Image-Guided Ablation of Atrial Fibrillation. IEEE Trans. Med. Imaging 33(2), 318–331 (2014). https://doi.org/10.1109/TMI.2013.2284382