Experimental Realization of Neutron Helical Waves
Abstract
Methods of preparation and analysis of structured waves of light, electrons, and atoms have been advancing rapidly. Despite the proven power of neutrons for material characterization and studies of fundamental physics, neutron science has not been able to fully integrate such techniques due to small transverse coherence lengths, the relatively poor resolution of spatial detectors, and low fluence rates. Here, we demonstrate methods that are practical with the existing technologies, and show the experimental achievement of neutron helical wavefronts that carry well-defined orbital angular momentum (OAM) values. We discuss possible applications and extensions to spin-orbit correlations and material characterization techniques.
pacs:
Valid PACS appear hereI Introduction
Neutrons play a vital role in characterization of materials and the experimental verification of fundamental physics Willis and Carlile (2017); Rauch and Werner (2015). They are distinguished as a unique probe by their nanometer-sized wavelengths, magnetic sensitivity, and penetrating abilities stemming from electrical neutrality. Further versatility is enabled by the coupling of neutron’s internal and spatial degrees of freedom Shen et al. (2020), and the advances in neutron interferometry techniques that exploit the phase degree of freedom of the neutron wavefunction Pushin et al. (2011); Shahi et al. (2016).
Structured wavefunctions of light, electrons, and atoms have become widely used scientific tools Rubinsztein-Dunlop et al. (2016); Mair et al. (2001); Andersen et al. (2006); Chen et al. (2021); Ni et al. (2021); Sarenac et al. (2020); Barnett et al. (2017); Ivanov (2022). A general class of structured wavefunctions is indexed by orbital angular momentum (OAM) Bazhenov et al. (1990); Allen et al. (1992); Uchida and Tonomura (2010); McMorran et al. (2011); Luski et al. (2021), in which the wavefunction varies as , where is the OAM value and the angle describes the azimuth around the propagation vector. The OAM states possess a “helical” or “twisted” wavefront, and they have been shown to manifest unique sets of selection rules and scattering cross sections when interacting with matter Schmiegelow et al. (2016); Afanasev et al. (2018); Sherwin (2022); Afanasev et al. (2021, 2019).
It is straightforward to impress OAM upon light with refractive and diffractive optics. However, the full extension of OAM techniques into neutron science has been complicated by several factors. First, the neutron index of refraction of common materials is on the order of . Thus, the basic optimal element, a lens, is not practical in neutron setups. Second, the spatial coherence of neutron beams is at most a few micrometers, as it is typically set by the neutron wavelength, aperture size, and the distance from the aperture to the sample Sarenac et al. (2018a). The imaging of fine details of diffraction is further hindered by the spatial resolution of neutron cameras that are at best a fraction of a millimeter. Lastly, at powerful research reactors the fluence rate of thermal neutrons at monochromatic [polychromatic] beamlines reaches neutrons/(cms). For comparison, note that a typical 1 mW red laser emits over photon/s.
Several experimental demonstrations with neutron OAM have been presented Clark et al. (2015); Sarenac et al. (2016, 2019), reporting the first manipulation of the average neutron OAM value using interferometric measurements of relative phase shifts. However, the creation of a neutron state with helical wavefronts dominated by a single OAM value remained elusive. The prospect of a wide range of significant applications ushered forth diverse proposals and a lively discussion concerning the possibilities of generating and measuring quantized neutron OAM given the technical challenges Cappelletti et al. (2018); Larocque et al. (2018); Geerits and Sponar (2021); Sarenac et al. (2018b); Nsofini et al. (2016); Majkrzak et al. (2019); Jach and Vinson (2021).
Here we demonstrate a holographic approach to tuning of neutron OAM. We use microfabricated arrays of millions of diffraction gratings with critical dimensions comparable to neutron coherence lengths and we follow the evolution of the neutron wave packets from micrometer to decimeter length scales. The arrays can be laid out on the cm-square areas typical of usual neutron scattering targets. This suggests possibilities for the direct integration of other structured wave techniques, such as the generation of Airy and Bessel beams Harris et al. (2015); Berry and Balazs (1979); Durnin et al. (1987), into neutron sciences. Furthermore, we discuss the applications towards characterization of materials, helical neutron interactions, and spin-obit correlations.
II Preparation and Detection of neutron helical waves
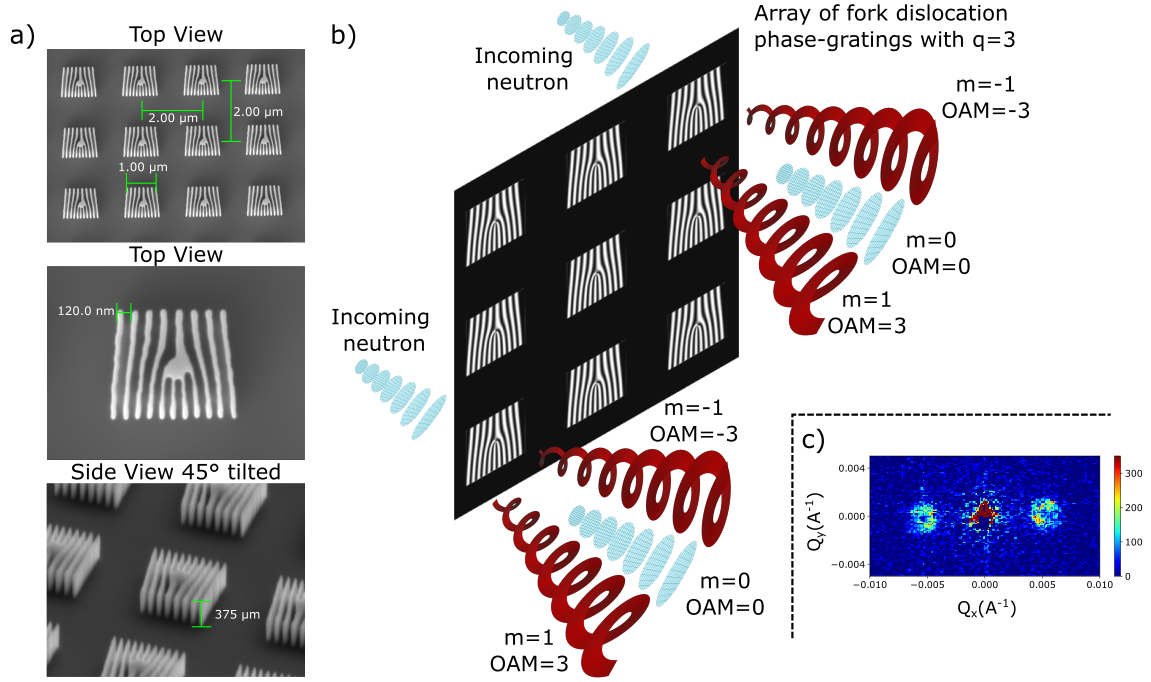
Phase-gratings with -fold fork dislocations are a standard tool in optics that produce photons with OAM value of at the mth order of diffraction Heckenberg et al. (1992). This requires that the transverse coherence length of the light beam be at least comparable to the dimensions of the fork dislocation.
Neutron beams have transverse coherence lengths of microns and fluence rates of neutrons/(cms). Observing the neutron signal from a single micron sized target is impractical. However, we can multiply the signal by using an array of micron-sized fork dislocation gratings. When considering an array it is important that the overall array size is much smaller than the diffraction signal of interest, and that the separation distance between the individual gratings is large enough so that it does not induce an observable diffraction order.
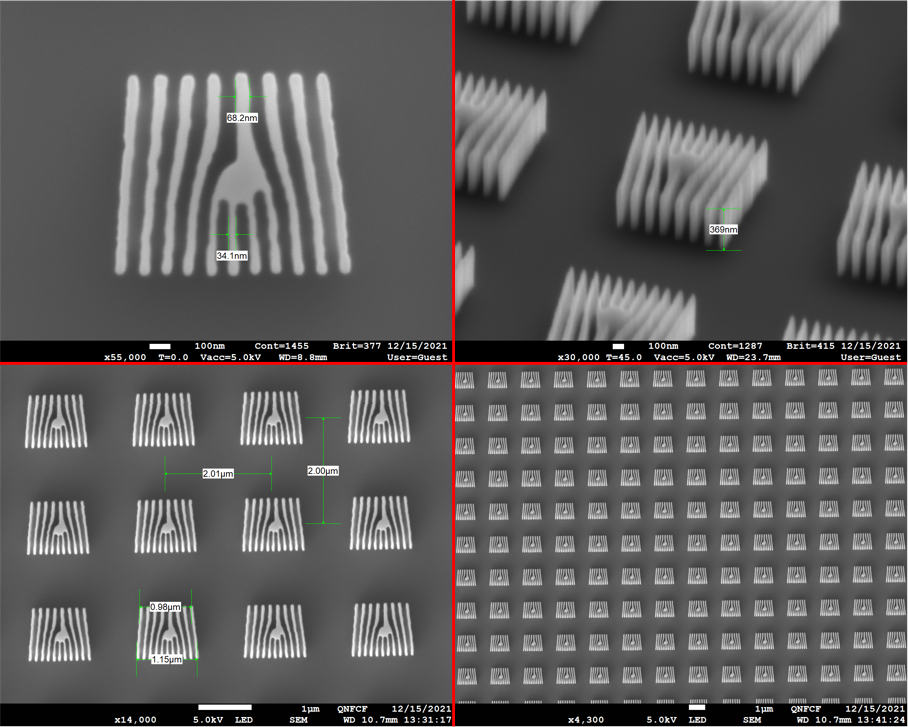
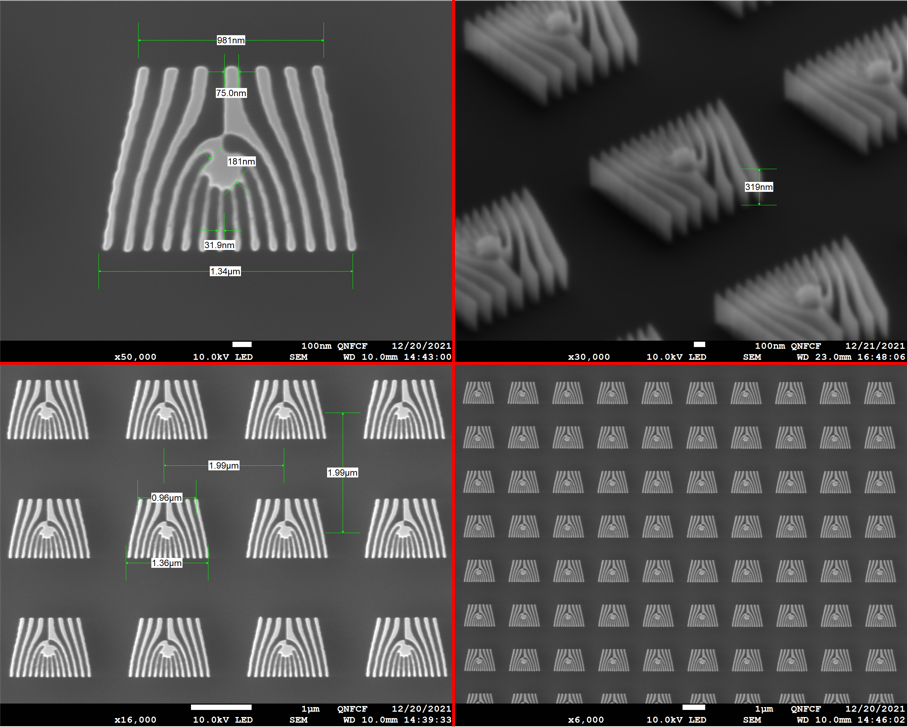
We have fabricated such arrays with on silicon substrates using electron beam lithography. Fig. 1a shows scanning electron microscope (SEM) images of the fork dislocation phase-gratings with . By construction, the spatial dimensions of the individual gratings are comparable to the transverse coherence length of our neutron beam. The use of such an array increases the neutron intensity by in a given diffraction order in the far-field (see Fig. 1b). The individual diffraction orders in the presented intensity profiles (see Fig. 1c) span an area of cm by cm, were taken over a period of min, and consist of the signal from individual fork dislocation phase-gratings.
To characterize the generated OAM states we can map out the momentum distribution. Small Angle Neutron Scattering (SANS) beamlines provide several advantages as they map the spatial profiles in the far-field, where the observed intensity distribution is directly determined by the Fourier transform of the outgoing neutron wavefunction. Having access to the far-field enables the use of holographic techniques that have been developed for optical structured waves Heckenberg et al. (1992). Another advantage is the relatively large flux and the accessibility to a wide range of wavelengths. And lastly, it is the typical setup used in material characterization techniques including the contemporary techniques analyzing skyrmion and topological geometries Henderson et al. (2021a, b). Straight-forward extensions follow for incorporating the characterization of materials and performing experiments with helical neutron interactions.
A simple map for modelling the action of a binary phase-grating with a fork dislocation can be expressed as:
| (1) |
where where () is the Cartesian (azimuthal) coordinate, is the grating period, are the non-zero diffraction orders, is the induced phase by the height of the grating grooves (see Appendix A), and the incoming wavefunction is typically taken to be a Gaussian profile for convenience. The far-field is typically defined to be the distance at which the diffraction orders are spatially separated, so here we can consider the terms independently along their respective propagation directions. We thus obtain well-defined OAM states in the form of . The full analysis of the evolution of such states is presented in Ref. Berry (2004). Consider one diffraction order of a single neutron wavepacket that transverses on-axis with the fork dislocation of a single phase-grating. Each point () in the neutron wavepacket is diffracted along the transverse direction, such that the induced OAM relative to the axis of propagation is independent of the point’s location Berry (1998):
| (2) |
where is the neutron momentum, is the magnitude of the wavevector along the direction, and is the reduced Planck’s constant. Therefore, every part of the neutron wave packet obtains a well-defined OAM of .
With equal transverse coherence lengths we can make use of the cylindrical symmetry to describe the transverse wave function in terms of solutions to the 2-D harmonic oscillator Nsofini et al. (2016):
| (3) |
where is the normalization constant, , , and are the associated Laguerre polynomials. The corresponding neutron energy is
| (4) |
where , and is the mass of the neutron. Each diffraction order of the fork dislocation phase-grating is in a definite state of OAM:
| (5) |
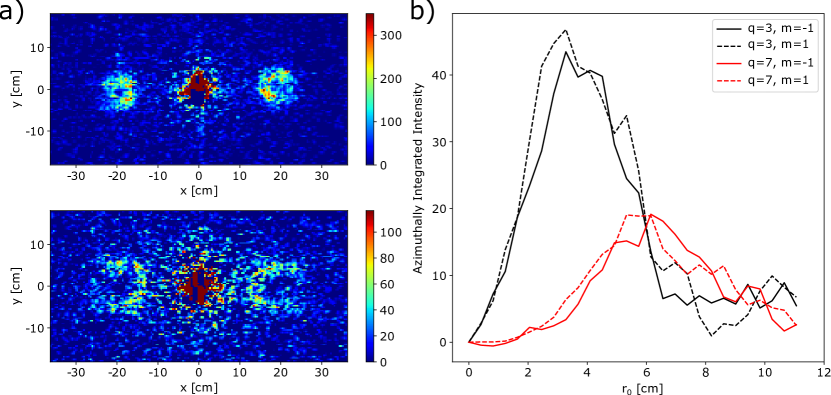
Considering dominant term Nsofini et al. (2016) of the first diffraction order, we can determine that the azimuthally integrated intensity:
| (6) |
peaks at:
| (7) |
III Results and Analysis
The experiments were performed on the GP-SANS beamline at the High Flux Isotope Reactor at Oak Ridge National Laboratory Wignall et al. (2012). The experimental setup parameters are described in detail in Appendix B. A circular aperture of mm diameter is used to define symmetric transverse coherence lengths . With the aperture to sample distance of m and neutron wavelength of Å we set the transverse coherence of the neutron wavepacket to the size of one fork dislocation phase-grating . The distance between the sample and the camera was 19 m, and the camera size span an area of with each pixel being mm by mm in size.
We fabricated two arrays of fork dislocation phase-gratings on Si wafers, one with a topology and the other with . Each array covered a 0.5 cm by 0.5 cm area and consisted of individual 1 by 1 fork dislocation phase-gratings, where each one possessed a period of nm, height nm, and was separated by 1 on each side from the other fork dislocation phase-gratings. The full consideration for the parameters is given in the Appendix A as well as the fab procedure in Appendix C.
The observed SANS data for the two arrays of fork dislocation phase-gratings is shown in Fig. 2a. With the phase-grating period of nm, the angle of divergence of the first diffraction order is rad which corresponds to on the SANS images (see Fig 1c). In our particular setup this corresponds to a spatial distance of cm on the camera as shown in Fig. 2a. Good agreement is found with the observed location of the peaks.
IV Discussion and Conclusion
We have described and experimentally demonstrated a method to generate and characterize neutron helical waves that are dominated by a well-defined OAM value. The experimental demonstration consisted of fabricating a 2D array of fork dislocation phase-gratings. With a pattern area of 0.5 cm by 0.5 cm that amounts to 6,250,000 individual fork dislocation phase-gratings contributing to the observed signal. and topologies were tested and the obtained doughnut shaped intensity distributions are in good agreement with theory.
The presented method opens the door for the implementation of other structured wave techniques with neutrons, such as the generation of “self-accelerating” Airy beams Berry and Balazs (1979); Siviloglou et al. (2007), as well as the “non-diffractive” Bessel beams Durnin et al. (1987); Garces-Chavez et al. (2002). These beams possess a “self-healing” property as they can reform after being partially obstructed. Considering an array of phase-gratings, the Airy beams would be generated through the addition of a cubic phase gradient while the Bessel beams through the addition of a radial phase gradient.
The convenient integration with a SANS beamline provides access to the far-field where the helical beams with specific OAM values are separated in the form of diffraction orders. This enables studies of interactions between neutron’s helical degree of freedom and scattering from materials. For example, placing the fork array phase-grating before a topological sample Henderson et al. (2021a, b) and post-selecting the analysis on individual diffraction orders allows for direct study of scattering properties from neutron helical waves.
Another avenue of exploration that is made possible is the experimental investigation of neutron selection rules. For example, this may be achieved through the addition of 3He spin filters. The absorption of neutrons by nuclear spin-polarized 3He is strongly dependant on the spin orientation of the neutron due to the conservation of spin angular momentum. Our method allows for the direct tests at a SANS beamline through the characterization of the diffraction peaks after the post-selection via 3He cell polarizers.
Acknowledgements
This work was supported by the Canadian Excellence Research Chairs (CERC) program, the Natural Sciences and Engineering Research Council of Canada (NSERC), the Canada First Research Excellence Fund (CFREF), and the US Department of Energy, Office of Nuclear Physics, under Interagency Agreement 89243019SSC000025.
References
- Willis and Carlile (2017) Bertram Terence Martin Willis and Colin J Carlile, Experimental neutron scattering (Oxford University Press, 2017).
- Rauch and Werner (2015) Helmut Rauch and Samuel A Werner, Neutron Interferometry: Lessons in Experimental Quantum Mechanics, Wave-Particle Duality, and Entanglement, Vol. 12 (Oxford University Press; 2 edition, 2015).
- Shen et al. (2020) Jiazhou Shen, Steven J Kuhn, Robert M Dalgliesh, VO de Haan, N Geerits, Abdul AM Irfan, Fankang Li, Shufan Lu, Stephen R Parnell, Jerome Plomp, et al., “Unveiling contextual realities by microscopically entangling a neutron,” Nature communications 11, 1–6 (2020).
- Pushin et al. (2011) DA Pushin, MG Huber, M Arif, and DG Cory, “Experimental realization of decoherence-free subspace in neutron interferometry,” Physical Review Letters 107, 150401 (2011).
- Shahi et al. (2016) CB Shahi, M Arif, DG Cory, T Mineeva, J Nsofini, D Sarenac, CJ Williams, MG Huber, and DA Pushin, “A new polarized neutron interferometry facility at the ncnr,” Nuclear Instruments and Methods in Physics Research Section A: Accelerators, Spectrometers, Detectors and Associated Equipment 813, 111–122 (2016).
- Rubinsztein-Dunlop et al. (2016) Halina Rubinsztein-Dunlop, Andrew Forbes, MV Berry, MR Dennis, David L Andrews, Masud Mansuripur, Cornelia Denz, Christina Alpmann, Peter Banzer, Thomas Bauer, et al., “Roadmap on structured light,” Journal of Optics 19, 013001 (2016).
- Mair et al. (2001) Alois Mair, Alipasha Vaziri, Gregor Weihs, and Anton Zeilinger, “Entanglement of the orbital angular momentum states of photons,” Nature 412, 313–316 (2001).
- Andersen et al. (2006) M. F. Andersen, C. Ryu, P. Cladé, V. Natarajan, A. Vaziri, K. Helmerson, and W. D. Phillips, “Quantized Rotation of Atoms from Photons with Orbital Angular Momentum,” Physical Review Letters 97, 170406 (2006).
- Chen et al. (2021) Jian Chen, Chenhao Wan, and Qiwen Zhan, “Engineering photonic angular momentum with structured light: a review,” Advanced Photonics 3, 064001 (2021).
- Ni et al. (2021) Jincheng Ni, Can Huang, Lei-Ming Zhou, Min Gu, Qinghai Song, Yuri Kivshar, and Cheng-Wei Qiu, “Multidimensional phase singularities in nanophotonics,” Science 374, eabj0039 (2021).
- Sarenac et al. (2020) Dusan Sarenac, Connor Kapahi, Andrew E Silva, David G Cory, Ivar Taminiau, Benjamin Thompson, and Dmitry A Pushin, “Direct discrimination of structured light by humans,” Proceedings of the National Academy of Sciences 117, 14682–14687 (2020).
- Barnett et al. (2017) Stephen M. Barnett, Mohamed Babiker, and Miles J. Padgett, “Optical orbital angular momentum,” Philosophical Transactions of the Royal Society A 375 (2017).
- Ivanov (2022) Igor P Ivanov, “Promises and challenges of high-energy vortex states collisions,” arXiv preprint arXiv:2205.00412 (2022).
- Bazhenov et al. (1990) V. I. Bazhenov, M. V. Vasnetsov, and M. S. Soskin, “Laser beams with wave front screw dislocations,” Pisma v Zhurnal Eksperimentalnoi i Teoreticheskoi Fiziki 52, 1037–1039 (1990).
- Allen et al. (1992) L. Allen, M. W. Beijersbergen, R. J. C. Spreeuw, and J. P. Woerdman, “Orbital angular momentum of light and the transformation of laguerre-gaussian laser modes,” Phys. Rev. A 45, 8185–8189 (1992).
- Uchida and Tonomura (2010) Masaya Uchida and Akira Tonomura, “Generation of electron beams carrying orbital angular momentum,” nature 464, 737 (2010).
- McMorran et al. (2011) Benjamin J McMorran, Amit Agrawal, Ian M Anderson, Andrew A Herzing, Henri J Lezec, Jabez J McClelland, and John Unguris, “Electron vortex beams with high quanta of orbital angular momentum,” science 331, 192–195 (2011).
- Luski et al. (2021) Alon Luski, Yair Segev, Rea David, Ora Bitton, Hila Nadler, A Ronny Barnea, Alexey Gorlach, Ori Cheshnovsky, Ido Kaminer, and Edvardas Narevicius, “Vortex beams of atoms and molecules,” Science 373, 1105–1109 (2021).
- Schmiegelow et al. (2016) Christian T Schmiegelow, Jonas Schulz, Henning Kaufmann, Thomas Ruster, Ulrich G Poschinger, and Ferdinand Schmidt-Kaler, “Transfer of optical orbital angular momentum to a bound electron,” Nature Communications 7 (2016).
- Afanasev et al. (2018) Andrei Afanasev, Carl E Carlson, Christian T Schmiegelow, Jonas Schulz, Ferdinand Schmidt-Kaler, and Maria Solyanik, “Experimental verification of position-dependent angular-momentum selection rules for absorption of twisted light by a bound electron,” New Journal of Physics 20, 023032 (2018).
- Sherwin (2022) Joseph A Sherwin, “Scattering of slow twisted neutrons by ortho-and parahydrogen,” Physics Letters A , 128102 (2022).
- Afanasev et al. (2021) AV Afanasev, DV Karlovets, and VG Serbo, “Elastic scattering of twisted neutrons by nuclei,” Physical Review C 103, 054612 (2021).
- Afanasev et al. (2019) Andrei V Afanasev, DV Karlovets, and VG Serbo, “Schwinger scattering of twisted neutrons by nuclei,” Physical Review C 100, 051601 (2019).
- Sarenac et al. (2018a) D Sarenac, DA Pushin, MG Huber, DS Hussey, H Miao, M Arif, DG Cory, AD Cronin, B Heacock, DL Jacobson, et al., “Three phase-grating moiré neutron interferometer for large interferometer area applications,” Physical Review Letters 120, 113201 (2018a).
- Clark et al. (2015) C. W. Clark, R. Barankov, M. G. Huber, D. G. Cory, and D. A. Pushin, “Controlling neutron orbital angular momentum,” Nature 525, 504–506 (2015).
- Sarenac et al. (2016) Dusan Sarenac, Michael G Huber, Benjamin Heacock, Muhammad Arif, Charles W Clark, David G Cory, Chandra B Shahi, and Dmitry A Pushin, “Holography with a neutron interferometer,” Optics express 24, 22528–22535 (2016).
- Sarenac et al. (2019) Dusan Sarenac, Connor Kapahi, Wangchun Chen, Charles W Clark, David G Cory, Michael G Huber, Ivar Taminiau, Kirill Zhernenkov, and Dmitry A Pushin, “Generation and detection of spin-orbit coupled neutron beams,” Proceedings of the National Academy of Sciences 116, 20328–20332 (2019).
- Cappelletti et al. (2018) Ronald L Cappelletti, Terrence Jach, and John Vinson, “Intrinsic orbital angular momentum states of neutrons,” Physical review letters 120, 090402 (2018).
- Larocque et al. (2018) Hugo Larocque, Ido Kaminer, Vincenzo Grillo, Robert W Boyd, and Ebrahim Karimi, “Twisting neutrons may reveal their internal structure,” Nature Physics 14, 1–2 (2018).
- Geerits and Sponar (2021) Niels Geerits and Stephan Sponar, “Twisting neutral particles with electric fields,” Physical Review A 103, 022205 (2021).
- Sarenac et al. (2018b) D Sarenac, J Nsofini, I Hincks, M Arif, Charles W Clark, DG Cory, MG Huber, and DA Pushin, “Methods for preparation and detection of neutron spin-orbit states,” New Journal of Physics 20, 103012 (2018b).
- Nsofini et al. (2016) Joachim Nsofini, Dusan Sarenac, Christopher J Wood, David G Cory, Muhammad Arif, Charles W Clark, Michael G Huber, and Dmitry A Pushin, “Spin-orbit states of neutron wave packets,” Physical Review A 94, 013605 (2016).
- Majkrzak et al. (2019) CF Majkrzak, NF Berk, BB Maranville, JA Dura, and T Jach, “On coherence and the transverse spatial extent of a neutron wave packet,” arXiv preprint arXiv:1911.07974 (2019).
- Jach and Vinson (2021) Terrence Jach and John Vinson, “Definitive detection of orbital angular momentum states in neutrons by spin-polarized 3he,” arXiv preprint arXiv:2109.07454 (2021).
- Harris et al. (2015) Jérémie Harris, Vincenzo Grillo, Erfan Mafakheri, Gian Carlo Gazzadi, Stefano Frabboni, Robert W Boyd, and Ebrahim Karimi, “Structured quantum waves,” Nature Physics 11, 629–634 (2015).
- Berry and Balazs (1979) Michael V Berry and Nandor L Balazs, “Nonspreading wave packets,” American Journal of Physics 47, 264–267 (1979).
- Durnin et al. (1987) JJJM Durnin, JJ Miceli Jr, and Joseph H Eberly, “Diffraction-free beams,” Physical review letters 58, 1499 (1987).
- Heckenberg et al. (1992) NR Heckenberg, R McDuff, CP Smith, H Rubinsztein-Dunlop, and MJ Wegener, “Laser beams with phase singularities,” Optical and quantum electronics 24, S951–S962 (1992).
- Henderson et al. (2021a) Melissa E Henderson, James Beare, Sudarshan Sharma, Markus Bleuel, Pat Clancy, David G Cory, Michael G Huber, Casey A Marjerrison, Mathew Pula, Dusan Sarenac, et al., “Characterization of a disordered above room temperature skyrmion material co8zn8mn4,” Materials 14, 4689 (2021a).
- Henderson et al. (2021b) ME Henderson, M Bleuel, J Beare, DG Cory, B Heacock, MG Huber, GM Luke, M Pula, D Sarenac, S Sharma, et al., “Skyrmion alignment and pinning effects in a disordered multi-phase skyrmion material co8zn8mn4,” arXiv preprint arXiv:2112.08669 (2021b).
- Berry (2004) MV Berry, “Optical vortices evolving from helicoidal integer and fractional phase steps,” Journal of Optics A: Pure and Applied Optics 6, 259 (2004).
- Berry (1998) Michael V Berry, “Paraxial beams of spinning light,” in International conference on singular optics, Vol. 3487 (International Society for Optics and Photonics, 1998) pp. 6–12.
- Wignall et al. (2012) George D Wignall, Kenneth C Littrell, William T Heller, Yuri B Melnichenko, Kathy M Bailey, Gary W Lynn, Dean A Myles, Volker S Urban, Michelle V Buchanan, Douglas L Selby, et al., “The 40 m general purpose small-angle neutron scattering instrument at oak ridge national laboratory,” Journal of Applied Crystallography 45, 990–998 (2012).
- Siviloglou et al. (2007) GA Siviloglou, J Broky, Aristide Dogariu, and DN Christodoulides, “Observation of accelerating airy beams,” Physical Review Letters 99, 213901 (2007).
- Garces-Chavez et al. (2002) V Garces-Chavez, David McGloin, H Melville, Wilson Sibbett, and Kishan Dholakia, “Simultaneous micromanipulation in multiple planes using a self-reconstructing light beam,” Nature 419, 145–147 (2002).
APPENDIX
IV.1 Fork Array Parameters
A duty cycle phase-grating with a fork dislocation has the following profile:
| (8) |
where is grating period, is the topological charge, is the Cartesian coordinate, and is the azimuthal coordinate. The groove height sets the phase shift that is induced by each grating groove: where is the coherent scattering length density of the grating material and is the neutron wavelength. As per Eq. 1 we can see that determines the relative amplitudes of the diffraction orders. For example, for the zeroth order is suppressed while for there is an equal amount of zeroth order and the higher orders. Note that the fabrication of the small periods currently limits us to small , and hence we will not be considering these effects. The only consideration is given to minimizing the acquisition time by maximizing the height to increase the number of neutrons in the first diffraction order.
The resulting profile for is shown in Fig. 1a. The period determines the angle of propagation of the diffraction orders, and hence it needs to be set by the requirements of the given beamline. The angle of propagation of the first diffraction order is:
| (9) |
where is the scattering vector of the gratings.
The topological charge sets the OAM values carried by the diffraction orders. As depicted on Fig. 1a, is the difference between the number of periods along the grating direction above the origin when compared to the number below the origin.
It is important to note that the fabrication challenges of the central region of the ideal fork dislocation phase-grating are typically overcome through the omission of the central region. Accordingly, a flat circular profile with diameter nm was intentionally imposed in our designs, which can be observed in the SEM figures. This is a common practice in optical OAM techniques given that the effects of such a feature are negligible in diffraction as the beam diverges away from the center.
Lastly the purpose of creating an array of these structures is two-fold. The first is that by creating the array with identical copies we are able to increase the signal to measurable amounts. Note that the spacing between the individual fork dislocation phase-gratings is over the cm by cm area, whereas the diameter of the ring in the first diffraction order is several centimeters. Hence the measured signal is the integral over the positions of the individual gratings whose separation distance and size is much smaller than the signal of interest. The images shown in Fig 2 were taken over 40 min and consist of the signal from millions of fork dislocation phase-gratings. Therefore, it is not practical to measure the signal of a single such grating. The second advantage is that future studies with materials are conveniently integratable with this design. A topological material typically possesses an array of topologies and hence it is desirable to create a tool with similar properties for more specific characterization.
IV.2 Experimental Setup
Small-angle neutron scattering measurements were performed on the GP-SANS beamline at the High Flux Isotope Reactor at Oak Ridge National Laboratory Wignall et al. (2012). The fork dislocation phase-gratings were placed inside a ThorLabs rotation mount (pat number RSP2D) which was then affixed to the end of the sample aperture holder. The gratings were placed 17.8 m away from the 20 mm diameter source aperture. A 4 mm diameter sample aperture was placed right in front of the sample to reduce possible background. The distance from the grating to the camera was 19 m, and a wavelength distribution of and a central wavelength of Å. The resulting standard deviation of the resolution distribution was estimated as =0.0001645 Å.
IV.3 Fork Array Microfabrication and Characterization
The target parameters for the fork dislocation phase-gratings were: period: nm for both and , groove height of ( nm for (), and inner region diameter nm for both and . These parameters were experimentally optimized to ensure that we obtain high quality and robust structures.
Double-side polished, intrinsic, 2 inch diameter (100) silicon wafers were used to fabricate the arrays of fork dislocation phase-gratings. Electron beam lithography (EBL) was employed to pattern the high performance positive EB resists (ZEP520A, 80 nm). The e-beam exposure was carried out with a JEOL JBX-6300FS EBL system operating at 100 kV and 2 nA beam current. The e-beam dosage was 250 C/cm2. After the e-beam exposure, the sample was processed in the developer ZED-N50 for 90 s, and then immersed in IPA for 60 s followed by a pure nitrogen dry. As hard mask during plasma etching of Si, Cr metal (20 nm) was e-beam evaporated and lifted-off in heated PG Remover. A pseudo-Bosch recipe was adopted to achieve vertical sidewall etch profile. The samples were etched in an Oxford PlasmaLab ICP-380 inductively coupled plasma reactive ion etching (ICP-RIE) system, which provides high-density plasma with independently controlled system parameters. The recipe includes rf: 100 W, ICP:1200 W, C4F8: 25 sccm, SF6: 15 sccm, pressure: 10 mTorr, temperature: 20C. After fabricating the array of fork dislocation phase-gratings, the remaining Cr etch mask was removed via plasma etching.