Investigation of lattice dynamics, magnetism and electronic transport in -Na0.33V2O5
Abstract
We investigate the electronic and magnetic properties as well as lattice dynamics and spin-phonon coupling of -Na0.33V2O5 using temperature-dependent Raman scattering, dc-magnetization and dc-resistivity, x-ray photoemission, and absorption spectroscopy. The Rietveld refinement of XRD pattern with space group C2/m confirms the monoclinic structure. The analysis of temperature-dependent Raman spectra in a temperature range of 13–673 K reveals an anharmonic dependence of the phonon frequency and full width at half maximum, which is accredited to the symmetric phonon decay. However, below about 40 K, the hardening of the phonon frequency beyond anharmonicity is attributed to the spin-phonon coupling. Interestingly, the estimated effective magnetic moment 0.63 from the magnetization data manifests a mixed-valence state of V ions in 4+ (181%) and 5+ (821%). A similar ratio of V4+ to V5+ is also observed in the x-ray photoemission and x-ray absorption near-edge spectra and that is found to be consistent with the sample stoichiometry. The analysis of extended x-ray absorption fine structure at the V K-edge gives the corresponding V–O bond lengths, which are utilized in the detailed analysis of Raman modes. Moreover, the temperature-dependent resistivity resembles a semiconducting behavior where the charge carrier transport is facilitated by the band conduction at higher temperatures and via hopping 260 K.
I Introduction
The sodium-based vanadium bronzes have attracted significant attention owing to their peculiar properties like complex magnetic ordering HeinrichPRL04 ; OhwadaPRB12 , pressure-induced superconductivity YamauchiPRL02 , nonlinear transport SirbuEPJB06 , metal-to-insulator transition accompanied with charge ordering SuzukiPRB09 ; YamauchiSSS05 , pressure-induced phase transition GrzechnikJPCM16 . Additionally, the layered vanadium-based compounds are considered as potential electrode materials for Li- and Na-ion batteries HadjeanJMC11 ; SarohaAO19 ; ChandraEA20 . Interestingly, the structure of vanadium bronzes is governed by the distribution of different geometric sites of V ions in the (V2O5)n framework, where comprehensive studies on MxV2O5 have shown that the obtained phases and their homogeneity strongly depend on the value of MarleyCC15 ; GalyJSSC70 . As the V-ions can exist in 3+, 4+ and/or 5+ oxidation states, among which 3+ (3) and 4+ (3) states are magnetic, while 5+ is non-magnetic having 3 configuration. The presence of mixed-valence states (4+ and 5+) with 1:5 ratio in -Na0.33V2O5 leads to the phenomenon of charge ordering (CO) as well as interesting physical properties KhooJMC10 ; HeinrichPRL04 ; YamauchiJPSJ08 ; ChakravertyPRB78 . Moreover, it has been reported that -Na0.33V2O5 exhibits a metallic behavior at high temperatures along the axis, while semiconducting behavior was observed along the and axes, with a metal-to-insulator transition TMI near 135 K YamadaJPSJ99 ; YamauchiSSS05 , which is very sensitive to the stoichiometry and imperfections YamadaJPSJ99 . The temperature-dependent magnetic susceptibility indicates a Curie-Weiss behavior accompanied with an antiferromagnetic ordering near 20 K (attributed to a weak coupling perpendicular to the axis), and an anomaly near TCO/TMI SchlenkerJAP79 .
At room temperature, the crystal structure of -Na0.33V2O5 is monoclinic (space group: C2/m) having six formula units per unit cell with a total of 44 atoms. This structure is highly anisotropic with three inequivalent sites of V-ions namely V1, V2, and V3, such that along the axis the V1O6 octahedra form an edge-sharing zigzag chain. The V2 site has a similar octahedral coordination and forms a corner-sharing ladder chain and the V3 site is in fivefold square pyramidal coordination and arranged in an edge-sharing zigzag chain. Moreover, the sodium ions occupy the empty space formed by the V2O5 framework. Galy et al. reported that there are two different sites for the Na ions, M1 and M2, which have a separation of 1.95 Å in the plane GalyJSSC70 . This distance does not allow simultaneous occupation of both sites (M1 and M2) because of the large ionic radii of Na+ ions (1.02 Å) GalyJSSC70 ; ShannonAC69 , while another report suggests that Na atoms can form a zigzag chain along the axis with a periodicity of 2 MaruyamaJPSJ80 . Moreover, according to Goodenough, the V4+ ions occupy 50% V1 sites and a few of V3 sites GoodenoughJSSC70 , while a study done by Badot et al. using the bipolaron model depicts that V4+ ions are distributed between V1 and V3 sites in a ratio of 84% and 16%, respectively BadotJSSC91 . It was earlier reported from NMR measurements that monovalent sodium in this compound donates its outer shell electrons to the 3-orbital of V-ions ItohPB00 . Goodenough has reported that these Na electrons overlap with the dxz orbital of the V1 sites or -orbital of the V2 sites, including a possibility of hopping into the V3 sites via the intermediate O atom GoodenoughJSSC70 . Interestingly, angle-resolved photoemission measurements revealed a strong electron-phonon coupling, and no significant change in the electronic properties across TMI OkazakiPRB04 . Moreover, Raman spectroscopy has been utilized as a powerful tool to understand the lattice dynamics and distinguish the precise changes over the phase transitions in the vanadium bronzes PopovicJPCM03 ; PopovicJPCM06 as well as in other complex oxides AjayPRB20 ; DuaPRB21 . In this line, there are a few reports on the lattice dynamics and optical properties of the single-crystalline FrankPRB07 ; PresuraPRL03 and polycrystalline HadjeanJMC11 ; OsmanACSAMI21 ; PhuocPRB05 -Na0.33V2O5 samples. However, to the best of our knowledge, no detailed temperature dependence of the Raman spectrum has been performed yet. Therefore, it is vital to extensively investigate the physical properties of polycrystalline -Na0.33V2O5 with temperature.
In this paper, we study the structural, magnetic, transport, electronic, and temperature-dependent vibrational properties of -Na0.33V2O5. The Rietveld refinement of the XRD pattern using monoclinic space group C2/m confirms the phase purity. The experimentally derived value of effective magnetic moment (0.63 B) manifests that the V-ions exist in the mixed-valence states of 4+ and 5+, which is further confirmed by x-ray photoemission spectroscopy and near-edge x-ray absorption spectroscopy at room temperature. Further, the curve fitting analysis of extended x-ray absorption fine structure (EXAFS) at the V K-edge gives an insight into the local structure. More importantly, the temperature-dependent Raman scattering probe the precise structural changes and stability of the compound with a dominant spin-phonon coupling at low temperatures. The dc-resistivity measurements reveal that system does not follow a single conduction mechanism in the measured temperature range and exhibits a semiconducting behavior.
II Experimental
A single-phase -Na0.33V2O5 (NVO) sample was synthesized by the sol-gel route SarohaAO19 . The powder x-ray diffraction pattern was recorded using the Cu-K radiation (1.5406 Å) with a Panalytical x-ray diffractometer and Rietveld refinement was performed with the FullProf software using a linear background. The temperature dependence of the Raman spectra was recorded using a high-resolution Dilor XY triple-monochromator spectrometer in backscattering geometry and the final signal was detected by a liquid nitrogen cooled charge-coupled-device, a CCD-camera. For excitation, the laser lines 632.82 nm of He+/Ne+ mixed gas laser and 514.532 nm of an Ar+ laser were used. In order to avoid sample heating through the laser beam, the incident laser power was kept below 5 mW at the sample position with a diameter of the laser spot of about 0.1 mm. For measurements at low temperature, the samples were mounted in a helium-flow cryostat and for the high temperature measurements in an optical temperature control stage of the company Renishaw was used. For each Raman spectrum, an additional calibration spectrum of a nearby neon line was measured in order to determine the precise frequency and line-width of different phonons. The phonon modes were analyzed by fitting the Voigt profile to the experimental data, which corresponds to the deconvolution of the Lorentzian (phonon line) and Gaussian (instrumental resolution of 2 cm-1 determined from neon spectrum) line shapes RahlenbeckPRB09 . The dc-magnetic susceptibility and dc-transport measurements were performed with the MPMS and PPMS instruments, respectively, from Quantum Design, USA. X-ray photoemission spectra were recorded using a commercial electron analyzer PHOIBOS150 from the company Specs, GmbH, Germany, which utilizes a nonmonochromatic Al-K source (h1486.6 eV). The base pressure in the analysis chamber was of the order of 10-10 mbar and the pass energy of the analyzer was 40 eV in transmission mode. The x-ray absorption spectroscopy (XAS) measurements were carried out in the transmission mode at the energy scanning EXAFS beamline (BL-09) of the INDUS-2 synchrotron source (2.5 GeV, 200 mA) at Raja Ramanna Center of Advanced Technology (RRCAT), Indore, India BasuJPCS14 .
III Results and Discussion
The Rietveld refinement of powder x-ray diffraction pattern of -Na0.33V2O5 measured at room temperature is shown in Fig. 1(a), which confirms a monoclinic space group C2/m with the lattice parameters, 15.4431(7) Å, 3.6147(2) Å, 10.0848(3) Å, and 109.546(2)o SarohaAO19 .
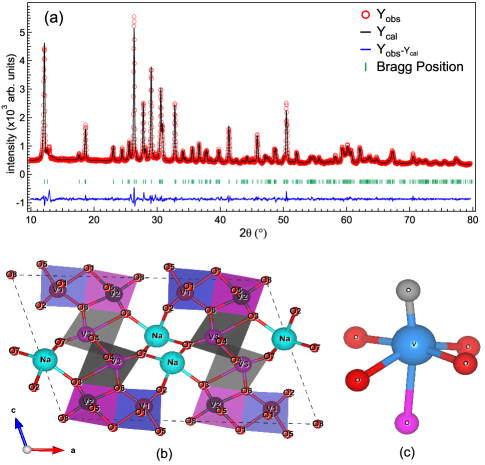
The refinement parameters = 1.65, Rwp = 5.28%, and Rp = 3.95% manifest a good quality fitting of the pure phase XRD pattern. The two-dimensional (2D) projection of the crystal structure of -Na0.33V2O5 is presented in Fig. 1(b) within the plane, where axis points inward. We find that there are three different symmetry positions of the V-ions [V1, V2, and V3], as well as tunnel sites for the accommodation of Na-ions (in cyan color) in the lattice. The blue, magenta, and black color polyhedra are formed around the V1, V2, and V3 sites, respectively, and the symmetry positions for the eight oxygen atoms (in red color) are also indicated with their respective numbers (O1–O8). Fig. 1(c) shows a schematic picture where there are three groups of V-O oxygen bonds having 1.6 Å for the apical oxygen (in grey color), 1.8–2.0 Å for the basal plane (in red color), and 2.3 Å for the farthest oxygen atom (in magenta color) DoubletPRB05 ; SmolinskiPRL98 . Figures 1(b, c) are constructed using VESTA 3 software for visualization of crystal structure MommaJAC11 . We present all the structural parameters including atomic positions and bond distances in Tables I and II of SI , which are found to be in good agreement with reported in refs. HadjeanJMC11 ; WadsleyAC55 .
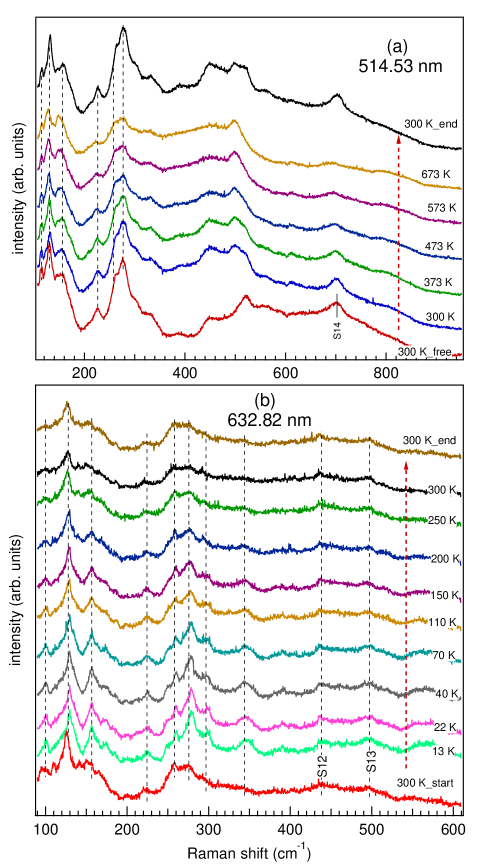
In order to understand the lattice dynamics in -Na0.33V2O5 sample, we have performed temperature-dependent Raman measurements in a large temperature range, i.e., from 13 K to room temperature (RT) using the wavelength 632.82 nm for excitation and from RT to 673 K using the 514.53 nm laser line. The spectra are presented in Figs. 2(a, b) between 107–950 cm-1 and 90–610 cm-1, respectively. Note that all the Raman spectra were calibrated with respect to a Neon line measured at each corresponding temperature and there was no significant variation in the recorded neon spectra with temperature.
At room temperature, -Na0.33V2O5 has a monoclinic crystal structure of space group C2/m (point group: C), which consists of six formula units (Z = 6) with 44 atoms per unit cell. Here, all the atoms have 4 Wyckoff positions (,0,; and ,0,) with site symmetry of C except for one oxygen (O1), which is located at the Wyckoff position 2 (0,0,0) with C2h site symmetry PopovicJPCM03 ; WadsleyAC55 . The Na-ions are statistically distributed in the tunnel sites formed along the -axis (not more than half-filled) by the atoms that occupy 4 Wyckoff positions to maintain the stoichiometry of the compound WadsleyAC55 . According to Popović et al. PopovicJPCM03 , these symmetries result in a large number of optical modes, and according to the group theory, there are in total 66 phonon modes, which involve 3 acoustic (one Au and two Bu), 30 Raman, and 33 infra-red active modes. The factor group analysis yields the following distribution of vibrational modes PopovicJPCM03 :
| (1) |
| poly-crystal | single-crystal | origin of | ||||
|---|---|---|---|---|---|---|
| modes | this work | NVO | NVO | individual mode | ||
| HadjeanJMC11 | FrankPRB07 | PopovicPRB02 ; PopovicSSC99 | ||||
| S0 | Ag(100) | – | – | chain rotation | ||
| S1 | Ag(115) | – | – | – | ||
| S2 | Ag(127.5) | Ag(124) | – | – | ||
| S3 | Bg(152) | Bg(151) | Bg(154) | Nac | ||
| S4 | Ag(170) | – | – |
|
||
| S5 | Ag(222.5) | Ag(223) | Ag(230) |
|
||
| S6 | Ag(249) | – | – | – | ||
| S7 | Bg(257.5) | Ag(256) | Bg(256) |
|
||
| S8 | Bg(274) | Bg(275) | Bg(275) |
|
||
| S9 | Ag(295) | Ag(288) | Ag(298) |
|
||
| S10 | Bg(318) | – | – | – | ||
| S11 | Ag(343) | Ag(333) | Ag(331) |
|
||
| S12 | Ag(438) | Ag(440) | Ag(440) |
|
||
| S13 | Ag(497) | Ag(516) | Ag(500) |
|
||
| S14 | Bg(702.5) | Bg(697) | Bg(694) |
|
As the Raman measurements were done without polarization analysis, both the Ag and Bg modes are present in the spectrum. The mode assignment was performed by comparing the observed phonon frequencies (listed in Table I) with the data from refs. FrankPRB07 ; HadjeanJMC11 . The phonon modes in the range of 200–500 cm-1 originate from the bond bending vibrations, whereas the phonon modes at higher wavenumber ( 500 cm-1) originate from the stretching vibrations of different V–O bonds of the VO5/6 polyhedra in the structure having different symmetry environments. In general, the modes originating from the polyhedra are collective vibrations of the oxygen ions at their corners, and the vibrational modes originating from the octahedra appear at lower wavelengths than the modes of pyramidal units due to the larger reduced mass of the contributing oxygen ions LoaPSS99 . Doublet et al. reported that five out of the six V-ions in the -phase compounds are surrounded by the five nearest oxygen neighbors to form the distorted square pyramid, while the sixth oxygen atom is found at a higher distance as compared to the other five oxygen atoms in the VO6 octahedron DoubletPRB05 , as shown in Figs. 1(b, c). Since there are three inequivalent V-sites available in -Na0.33V2O5, a weighted average of the V-O bond lengths have the values 11.588 Å (apical); 41.901 Å (basal); and 12.315 Å (farthest) in three groups (obtained from the analysis of EXAFS spectra, see Table III for details) PopovicJPCM03 ; DoubletPRB05 ; FrankPRB07 . Moreover, a few weaker Raman modes are present at higher wavenumbers; for example, at 438, 497, and 702.5 cm-1, as marked by S12, S13, and S14, respectively, in Fig. 2. Here, the S12 mode is assigned to Ag vibrations PopovicJPCM06 ; PopovicJPCM03 ; FrankPRB07 ; HadjeanJMC11 , and the peak position (which is sensitive to the Na concentration BacsaPRB00 ) indicates that the electrons in the polycrystalline -Na0.33V2O5 are delocalized to the O-V-O ladder PopovicJPCM03 , where O refers to the bridge O-atoms between the VO5/6 polyhedra. Therefore, the responsible bond for the S12 mode can be V3-O5-V1 (134.935o, 3.716 Å), as also reported in Ref. PopovicPRB02 . Intriguingly, the delocalization of charge in the V3-O5-V1 ladder exhibit that V1 and V3 sites are mixed valent (4+ and 5+), while the V2 site will be in 5+ state BacsaPRB00 . The S13 and S14 modes are associated to Ag and Bg vibrations due to the V3-O6 (1.919 Å) and V3-O4 (1.881 Å) bond stretching, respectively, which are consistent with -NaV2O5, as reported in PopovicPRB02 ; PopovicSSC99 . In Table I, we compare the peak positions of different Raman modes and their respective origins with the help of Refs. HadjeanJMC11 ; FrankPRB07 ; PopovicPRB02 ; PopovicSSC99 .
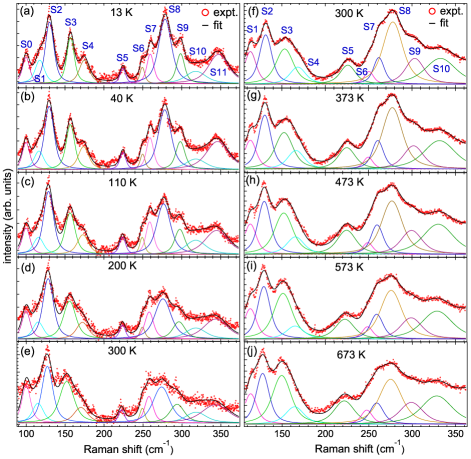
Moreover, we analyze the recorded temperature-dependent Raman spectra below 400 cm-1 by fitting the Voigt peak profiles (marked as S0–S11), as presented in Figs. 3(a–j) for selected temperatures RahlenbeckPRB09 ; BuchenauPRB20 ; GrahamPRB22 . The Raman modes with the frequencies 200 cm-1 (S0–S4) are either associated with the chain rotation/translation or with the movement of Na-atoms along the different crystallographic axis. As the unit cell parameters follow MeetsmaACC98 ; therefore, the smaller, mid, and high-frequency modes in -Na0.33V2O5 are predominantly associated with the movement of sodium atoms along the longer to the smaller axis, respectively, i.e., along the , , and axes, respectively. Moreover, the phenomenon of chain rotation/translation associated with the S0 and S4 Raman modes manifest that these modes correspond to the motion of constituent chains, where the movement of all atoms (V, Na, and O) takes place in a systematic pattern. While the Raman modes which appear due to the translation of Na atoms (S3, S4), the only motion of Na atoms takes place along a defined crystallographic axis. Further, S1 and S2 Raman modes belong to the Ag type and will have a similar origin as S3 and S4 modes. Interestingly, the position of the remaining seven active Raman modes (S5–S11) lies in the frequency range of bond-bending vibrations, in which S5, S6, S9, and S11 modes are of Ag type, while S7, S8, and S10 modes are related to the Bg type vibrations [see Table-I]. The S5 (222.5 cm-1) and S9 (295 cm-1) modes are analogous to the Ag vibrations observed in the and polarizations, respectively, which manifest the different types of bond bending vibrations of O-V-O bonds FrankPRB07 . Note that in -NaV2O5, the Raman modes at 233 and 304 cm-1 are related to the O1-V-O2 bond bending vibrations having the bond lengths and bond-angles of 3.552 Å, 108.488o; and 3.632 Å, 108.428o, respectively PopovicPRB02 . Therefore, the Ag type S5 and S9 vibrational modes in -Na0.33V2O5 are associated with the O8-V3-O7 bond having the dimensions of 3.712 Å and 112.752o, which are very similar to the -NaV2O5. Moreover, the S11 mode at 343 cm-1 is also of Ag type, but is associated with the O3-V2-O4 bond (3.437 Å, 105.364o), which was found to be very similar to the O3-V-O1 bond bending (3.442 Å, 103.455o) in -NaV2O5 PopovicPRB02 . The S7, S8, and S10 modes are of Bg type observed at 257.5, 274, and 318 cm-1, respectively, and correspond to the O-V-O bond bending vibrations.
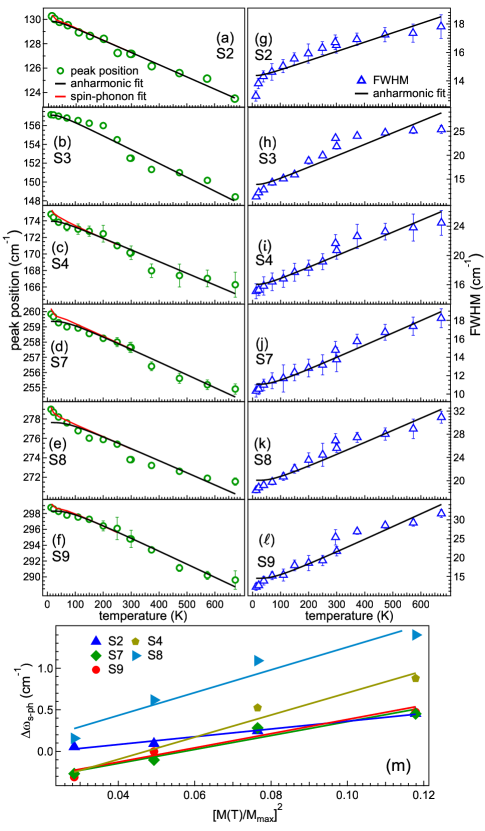
Figures 4(a–f) and 4(g–l) show the peak positions (open green circles) and full width at half maximum (FWHM) (open blue triangles), respectively, of only high intensity and low wavenumber Raman modes, i.e., S2 (127.5 cm-1), S3 (152 cm-1), S4 (170 cm-1), S7 (257.5 cm-1), S8 (274 cm-1), and S9 (295 cm-1) as a function of temperature. We find that all these modes shift towards lower wavenumber and the FWHM increases with temperature, as plotted on the left and right axis of Figs. 4(a–f) and 4(g–l), respectively. Since the temperature predominantly alters the equilibrium positions of atoms in the lattice owing to the changes in the interatomic forces due to the lattice thermal expansion and anharmonicity. These effects can be considered as composed of two different contributions: (i) change in the frequency of phonos originating because of volume expansion with temperature, which is the ’implicit’ anharmonicity, and (ii) the pure-temperature contribution due to anharmonic phonon-phonon interactions, called ’explicit’ anharmonic contribution LucaJRS03 ; MaczkaJPCM12 . Therefore, the change in phonon frequency and linewidth with temperature is caused by the anharmonic decay of the optical phonon into two phonons of lower energy. This can be expressed in terms of a phonon self-energy, where the real part corresponds to the phonon frequency shift and the imaginary part is related to the change in the FWHM BalkanskiPRB83 ; KlemensPR66 ; MenendezPRB84 . This can be modeled in first approximation by a symmetric decay (Klemens decay) into two phonons with half the energy of the optical phonon and opposite momenta, and can be expressed as MenendezPRB84 ; RahlenbeckPRB09 :
| (2) |
where A is a constant and is the frequency of the corresponding optical phonon at lowest temperature. Similarly, we can assume this for the phonon line widths of Raman modes using a positive constant B, and the line width at lowest temperature (), such that
| (3) |
The lifetime of phonon decay can be determined using the energy-time uncertainty relation , where is lifetime of phonon mode, is uncertainty in the phonon energy, is reduced Planck’s constant, is phonon linewidth and is speed of light BergmanPRB99 . Since the linewidth increases with temperature, the lifetime of the phonon decreases [right axis of Figs. 4(g–l)]. The obtained values of (at lowest temperature) are 0.370.02 ps, 0.460.05 ps, 0.350.02 ps, 0.540.03 ps, 0.290.02 ps, and 0.480.08 ps for S2, S3, S4, S7, S8, and S9 Raman modes, respectively, consistent with Refs. DeepaMTC21 ; BergmanPRB99 . The anharmonic model was used to describe the temperature dependence of the phonon frequency and FWHM. Therefore, we use equations (2) and (3) to fit the temperature dependence of the phonon frequency and FWHM, respectively. The corresponding results are shown as the solid black lines in Figs. 4(a–l) and the obtained fitting parameters at lowest temperature are summarised in Table-II.
| Raman | A | B | ||
|---|---|---|---|---|
| mode | (cm | (cm-1) | (cm-1) | (cm-1) |
| S2 | 129.80.1 | -0.470.02 | 14.10.3 | 0.310.04 |
| S3 | 157.10.4 | -0.840.07 | 12.60.9 | 1.360.16 |
| S4 | 174.00.3 | -0.900.06 | 15.10.4 | 1.020.08 |
| S7 | 259.40.2 | -0.790.04 | 9.80.3 | 1.260.07 |
| S8 | 277.60.4 | -1.270.13 | 17.90.6 | 2.110.19 |
| S9 | 298.30.2 | -1.810.07 | 10.90.9 | 3.370.31 |
It is interestingly to note here that the measured data for the peak positions and linewidth deviate from the fitted line of anharmonic phonon-phonon interactions in the low-temperature range below 40 K [see Figs. 4(a–l)]. This deviation can be attributed to an additional spin-phonon interaction of the Raman modes, as the magnetization data also show a rapid increase in the low temperature range [see Fig. 5(a), discussed later]. Here, the change in the phonon frequency due to the spin-phonon interaction can be calculated through a Taylor expansion of the exchange interaction with respect to the phonon displacement following the Refs. BaltenspergerHPA68 ; LockwoodJAP88 ; GranadoPRB99 . A relation between the phonon frequency and spin-correlation function is given by:
| (4) |
where is the anharmonic phonon frequency, is the spin-phonon coupling constant and is the nearest neighbor spin-correlation function. Therefore, deviation in the phonon frequency beyond anharmonicity correspond to the spin-phonon interaction following the formalism developed in Ref. GranadoPRB99 . It can be written in terms of the temperature-dependent magnetization of the magnetic Vanadium (V) GranadoPRB99 :
| (5) |
where is the number of interacting nearest neighbors in a plane. Here, the values of the temperature-dependent magnetization M(T), and the maximum value of the magnetization Mmax were determined independently from the ZFC data. In Fig. 4(m), we have plotted the deviation in the phonon-frequency from beyond the anharmonic phono-phonon interaction with [M(T)/Mmax]2 in the temperature range below 70 K. By a linear fit to these experimental data points using equation (5), we are able to determine the spin-phonon coupling constant () for the individual phonons and the obtained values in cm-1 are 1.20.1, 3.30.4, 2.10.4, 3.40.6, and 2.20.4 for S2, S4, S7, S8, and S9 Raman modes, respectively. These values are consistent with the one reported for the ZnCr2O4 (3.2–6.2 cmSushkovPRL05 . The obtained values of manifest the strength of the spin-phonon coupling and the highest value of for the S8 Raman mode exhibits that this mode is very sensitive to the spin-phonon coupling and this bending mode would be associated with the magnetic V ions (V1 and/or V3 sites) in the material. However, a similar value of (3.3 cm-1) is obtained for the S4 mode, which is associated with the translation and rotational motion of atoms and affected by the spin fluctuations. The lowest value of the (1.2 cm-1) for the S2 mode manifests a lower sensitivity to the spin-phonon coupling. Moreover, in Figs. 4(a–f), we have included an additional fit to the temperature-dependent peak position of the Raman modes corresponding to the spin-phonon interaction with a solid red line, which manifests a good agreement to the experimental data. Therefore, spin-phonon interaction in the low-temperature region is dominant and leads to the hardening of the phonon frequency. As shown in Figs. 4(g-l), the line width (FWHM) also decreases below about 40 K. The phonon self-energy consists of a real and an imaginary part, where the real part corresponds to the shift in phonon frequency caused by the spin-phonon interaction and the imaginary part is reflected in the change in the line width. This is a further support that the additional changes in phonon frequency and line width below 40 K are caused by the spin-phonon interaction and not effects such as lattice distortions BuchenauPRB20 ; GrahamPRB22 .
Now we move to the investigation of magnetic and transport properties of the -Na0.33V2O5 sample, as presented in Fig. 5. The temperature-dependent zero-field cooled (ZFC) and field cooled (FC) dc-magnetic susceptibility data are shown in Fig. 5(a) in the temperature range of 5–320 K. The ZFC-FC curves exhibit a paramagnetic type behavior where the magnetization value rises to 25 emu/mol at 5 K. Note that a hump near 45 K is due to measurement artifacts, i.e., attributed to the oxygen freezing on the sample surface KoblerPRB87 . The Curie-Weiss fit of the versus temperature plot in 150 to 320 K temperature range results in an effective magnetic moment value of = 0.63 and a negative Curie-Weiss temperature = -52 K. The negative value of indicates the presence of antiferromagnetic spin correlations in the sample IsobeJPSJ96 ; VasilevPRB01 . Moreover, in the spin only approximation, we can determine the value of Sav from the experimental results using the formula , which gives the value of Sav = 0.09. The V3+ has two unpaired electrons, V4+ has only one unpaired electron and V5+ has no unpaired electron in the outer shell. Therefore, in the spin-only approximation, V3+ and V4+ will possess the values of 3.46 and 1.73 , respectively, while V5+ will give no contribution. Interestingly, in the unit cell of -Na0.33V2O5, the V-ions occur in 4+ and 5+ valence states in a ratio of 1 and 5, respectively HeinrichPRL04 . This will give the calculated value of 0.61 , which is in good agreement with the experimentally obtained value of 0.63 ; therefore, the experimentally obtained share of V4+ ions (18%) in -Na0.33V2O5 is very close to the stoichiometric (16.7%) value and also in a good agreement with the previous reports HeinrichPRL04 . The isothermal magnetization loop recorded at 5 K with an applied magnetic field of 70 kOe is shown in Fig. 5(b)], which exhibits a paramagnetic type behavior for 20 kOe, and an S-shaped below 20 kOe. This manifests a weak ferromagnetic behavior. The maximum value of magnetization is observed 125 emu/mol at 70 kOe with the coercivity and retentivity values of 175 Oe and 0.75 emu/mol, respectively. Further, we measure the virgin curve at 5 K and this data is utilized to get Arrott’s plot in terms of M2 versus H/M, as shown in Fig. 5(c). It is well known that a linear fit in higher magnetic field region indicates ferromagnetic interaction if it has an intercept on the y-axis and suggests a non-ferromagnetic interaction if the intercept is on the x-axis. In the present case, the extrapolation of the fit [black solid line in Fig. 5(c)] gives an intercept on the x-axis, which indicates a non-ferromagnetic interaction in the -Na0.33V2O5 sample. This is consistent with non-saturating nature of the M-H loop in Fig. 5(b).
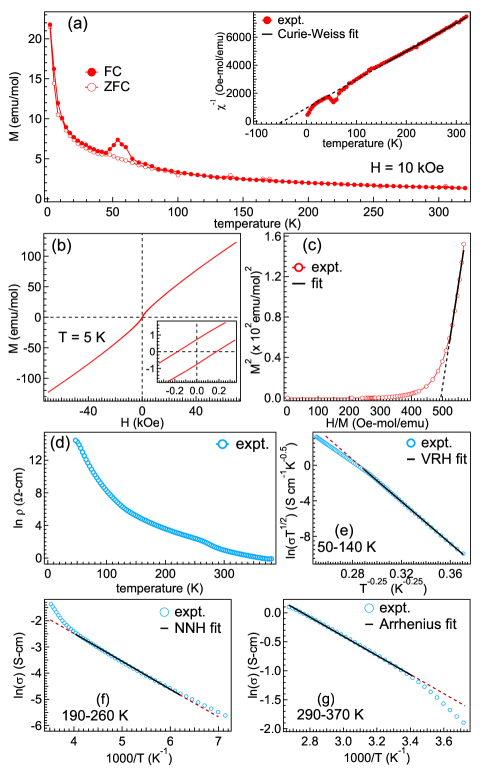
It has been reported that the single-crystalline -Na0.33V2O5 is a quasi-one-dimensional conductor along the axis at high temperatures, while semiconducting along the and axis YamadaJPSJ99 ; ObermeierPRB02 . To investigate the conduction mechanisms/pathways in polycrystalline -Na0.33V2O5 we have measured the resistivity in the temperature range of 50–380 K, as shown in Fig. 5(d). We find that the resistivity increases from cm to Mcm range with decreasing temperature and exhibits a semiconducting nature due to a negative temperature coefficient. In semiconductors, high-temperature carrier transport is dominated by the thermally activated band conduction, where the charge carriers are thermally excited from localized states to delocalized states. However, in the low-temperature regime hopping of charge carriers from localized state to conduction band dominates. Interestingly, the conduction via hopping of charge carriers has two different possibilities (i) nearest-neighbor hopping (NNH) mechanism where the charge carriers hop from one localized state to the nearest unoccupied state, and (ii) variable range hopping (VRH) model where the carrier transport is facilitated to the unoccupied states near to the Fermi level despite their spatial distribution. The universal law of conduction follows BougiatiotiJAP17 ; ShuklaPRB18
| (6) |
where is the pre-exponential factor, Et is the thermal activation energy, and is the characteristic exponent. The value of is 1 for the band conduction and between 0 to 1 for the hopping type conduction. The law for the NNH and thermally activated band conduction is defined as
| (7) |
where and are the pre-exponential factors and Ea1 and Ea2 are the thermal activation energies for the band and NNH conductions, respectively. To understand these mechanisms, we have plotted versus 1000/T in the temperature ranges of 190–260 K and 290–370 K in Figs. 5(f, g) where the solid black lines in each panel show the fit to the experimental data using NNH and Arrhenius models, respectively, and the red dotted lines exhibit the range where the experimental data deviates from the fitting. The obtained activation energy values are 920.8 meV and 1451 meV, for the NNH and band conduction, respectively, and are consistent with other semiconducting oxide materials ZobelPRB02 ; ShuklaPRB18 .
More interestingly, the Mott-VRH type carrier conduction mechanism dominates in the low-temperature range MottCP69 . A strong coupling between the V5+ and V4+ ions in this sample creates delocalized orbitals. Therefore, the smaller values of the activation energies for hopping via an intermediary anion may be anticipated GoodenoughJSSC70 . Thus, the hopping via an intermediary cation goes through the V1/V3 subarray. However, with this kind of conduction in the present sample, any mobile electron will be confined to the single-channel/tunnel, which results in the large anisotropy in the resistivity. The Mott-VRH model assumes that the density of states near the Fermi level is constant and Coulomb repulsion between electrons is very weak and can be neglected PaulPRL73 . Therefore, for the VRH model, the value of is 0.25 and Et is defined as kBT0, where T0 is the characteristic temperature and corresponds to the Mott energy E0. The law for 3D-VRH conduction is:
| (8) |
where is the pre-exponential factor, and T0 is the characteristic temperature. The and T0 are related to the inverse localization length () and the density of states near the Fermi level N(EF) by the relations:
| (9) |
where is the phonon frequency corresponding to the Debye temperature ( Hz), and is the inverse localization length MottCP69 . For further analysis, we have plotted ln() versus T-1/4 in the 50–140 K temperature range and the obtained linear behavior manifests that the conduction in this range is governed by the Mott-VRH mechanism. By fitting a straight line to the experimental data we determine the VRH parameters , T0, N(EF), which are 1.3108 cm-1, 1.6108 K, and 2.91021 eV-1cm-3, respectively. Furthermore, the values of the mean hopping distance (R) and mean hopping energy (W) can be calculated using cm and eV PaulPRL73 . The obtained values of R and W are 1.03 nm, and 76.2 meV, respectively. These values further support the model of Mott-VRH conduction, i.e., 1 and WT PaulPRL73 , which infers that the conduction takes place via VRH in the low-temperature range.
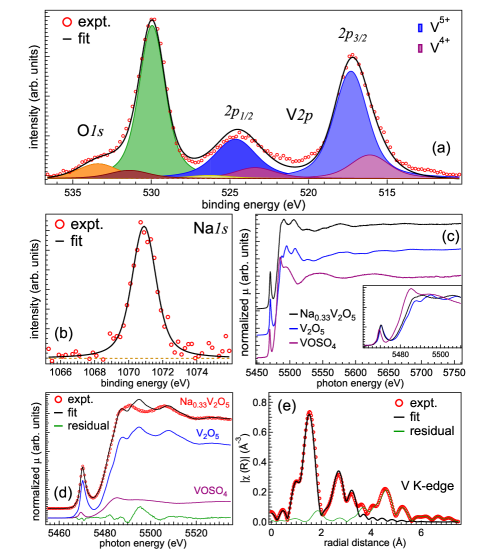
Finally, we use x-ray photoemission and x-ray absorption spectroscopy to understand the electronic properties and local structure of -Na0.33V2O5 at room temperature. Fig. 6(a) shows the O 1 and V 2 core-levels in the vicinity, where the spectral contribution due to Al-K satellites was subtracted following the reference Hufner03 . All the core-level spectra were calibrated with respect to the C 1 peak at the 284.8 eV binding energy (BE). Further, we deconvolute these core levels using the Voigt function (a combination of Lorentzian and Gaussian lineshapes) after the subtraction of the Tougaard background. In the present case, the binding energy of O 1 core-level is found to be 530 eV and an additional component at 532.6 eV is related to the chemically adsorbed oxygen in the form of C–O(H) SilverJESRP04 . The V 2 core-level shows two spin-orbit split components having a separation of 7.35 eV and the absolute BE values are at 516.1 and 523.4 eV for V4+, while 517.3 and 524.7 eV for V5+ oxidation states, respectively, in good agreement with Refs. Hufner03 ; SawatzkyPRB79 ; ZimmermannJPCM98 ; MendialduaJESRP95 . We also notice small shake-up satellite features around 14.1 eV and 10.2 eV from the 2 components of V5+, and V4+ states, respectively. Moreover, a satellite at 8.3 eV is observed from the 2 component of the V4+ state. For the quantitative analysis, we compare the total area ratio of the V5+ and V4+ oxidation states and found that they exist in a percentage of 80% and 20%, respectively. This obtained ratio of the oxidation states is in agreement with the one found from the analysis of magnetization data. Fig. 6(b) shows the Na 1 core-level, where the observed BE value is 1071 eV, which confirms the Na in the 1+ oxidation state PrechtPCCP16 .
Further, in Fig. 6(c) we present the near-edge x-ray absorption spectra (XANES) of the -Na0.33V2O5 sample and compare it with the corresponding spectra of the reference samples V2O5 (for V5+) and VOSO4 (for V4+). The calibration was performed using the vanadium metal foil by fixing the derivative of first-order maxima at 5465 eV, and then shifting the spectra of -Na0.33V2O5 accordingly. Moreover, we subtracted the background from the recorded absorption spectra and then normalized it to unity above 600 eV from the edge jump ShuklaJPCC21 . The position of the absorption edge of the -Na0.33V2O5 sample (black solid line) is in between the two reference samples, i.e., V2O5 and VOSO4 [see inset of Fig. 6(c)]. This indicates the presence of mixed 5+ and 4+ oxidation states of V ions in the -Na0.33V2O5 sample, consistent with the XPS and magnetization results (discussed above). A quantitative ratio of the mixed 5+ and 4+ states can be approximated from a linear combination fitting using the Athena software RavelJSR05 . Therefore, we have performed the linear combination fitting using the standard reference samples of VOSO4 and V2O5 for the oxidation states of 4+ and 5+, respectively, and obtained a ratio of 83% and 17%, respectively [see Fig. 6(d)] for the -Na0.33V2O5 sample. This is again in good agreement with our XPS and magnetization results as well as with references BadotJSSC91 ; HeinrichPRL04 . The strong intensity pre-edge peak emerges due to the tetrahedral symmetry of present V-ions in the monoclinic phase ChandraEA20 ; YamamatoXRS08 . Moreover, it is important to note here that if we consider the presence of three inequivalent absorbing sites of V atoms, in the anisotropic structure of -Na0.33V2O5 sample, the analysis of EXAFS curve becomes challenging due to increased number of scattering paths RavelJSR14 . On the other hand, in this line Ravel introduced a new formalism for such EXAFS analysis and applied for CaZrTi2O7 sample, which consists of three inequivalent Ti sites RavelJSR14 . In this paper, the complexity of the EXAFS curve fitting is minimized through the concept of fuzzy degeneracy in which the contributions of similar scattering paths are averaged in a given margin, known as the bin size, i.e., the scattering paths are grouped together (become degenerate) if they fall within this bin size RavelJSR14 . Interestingly, in this way, the use of fuzzy degeneracy reduces the number of scattering paths without affecting the validity/accuracy of the analysis RavelJSR14 . Moreover, in this formalism the obtained scattering paths become independent of the crystallographic orientations as the similar scattering paths are averaged over the inequivalent sites. This procedure is also applicable and relevant in the present case of inequivalent V sites in the -Na0.33V2O5 sample, as discussed above in XRD analysis (see Table II of SI ).
| path degeneracy | scattering paths | R | D-W factor |
| (Å) | ( Å2) | ||
| 1.00 | V–O (apical) | 1.588 | 0.007 |
| 0.67 | V–O (basal) | 1.857 | 0.003 |
| 2.00 | V–O (basal) | 1.948 | 0.007 |
| 0.33 | V–O (basal) | 1.833 | 0.004 |
| 2.00 | V–O (basal) | 1.879 | 0.001 |
| 0.67 | V–O (farthest) | 2.315 | 0.006 |
| 1.33 | V–V | 3.005 | 0.006 |
| 2.33 | V–V | 3.602 | 0.015 |
Therefore, for the analysis of the EXAFS at V K-edge, we follow the same formalism of fuzzy degeneracy (bin size of 0.03 Å in the present case), and the path degeneracies are calculated over the different sites by the fractional population of the individual site in the unit cell RavelJSR14 . For example, the degeneracy having a value of 0.33 in Table III means that it includes only one scattering path. The structural parameters obtained from the Rietveld refinement of the XRD pattern, shown in Fig. 1(a), were used for the FEFF code of the Artemis program after the reduction and normalization of the absorption spectra in the Athena software available in the Demeter package RavelJSR05 . Then, we fit the Fourier transform of the EXAFS curve [k2] in terms of versus radial distance (R) up to 4.1 Å with the single scattering paths AjayPRB22 from the absorbing V atoms (V–O and V–V) [see Fig. 6(e)]. The path degeneracy, effective bond lengths (Reff), and Debye-Waller (D-W) factor extracted for the scattering paths V–O and V–V are summarized in Table III. The obtained parameters indicate that there are three groups of V–O bond lengths, which are in good agreement with the bond length parameters extracted from the Rietveld refinement of the XRD pattern (see Table II of SI ). Interestingly, these three groups of bond lengths (apical, basal, farthest) were utilized for the in-depth understanding of Raman spectra, which establish the correlation between vibrational and electronic properties of the -Na0.33V2O5 sample.
IV Conclusions
In summary, we have investigated the structural, magnetic, electronic, and lattice vibrational properties of -Na0.33V2O5 by performing a detailed analysis of various experimental results. The Rietveld refined XRD pattern confirms the monoclinic crystal structure with the space group C2/m (#12). The Raman modes in a large temperature range of 13–673 K are assigned to different translational/chain rotations of Na and stretching/bending vibrations of different V-O bonds. Intriguingly, an anharmonic dependence of peak-positions and FWHM of the profound phonon modes is accredited to the symmetric phonon decay. Below about 40 K, a deviation in the phonon frequency and linewidth beyond the anharmonic fit is attributed to a spin-phonon interaction. The experimental value of manifests the presence of V-ions in mixed-valence states of 4+ and 5+ in a ratio of 18% and 82%, respectively, which is further confirmed by the XPS measurements. Also, a linear combination fit of the XANES at the V K-edge validates these observations. Interestingly, a detailed EXAFS curve fitting at the V K-edge provides insight about the local coordination and effective V-O bond-lengths, which are consistent with the one obtained from XRD analysis. Furthermore, the resistivity data demonstrates a semiconducting nature and follows three different conduction mechanisms in which Arrhenius type dominants in 370–290 K range (Ea=145 meV). The carrier conduction in the lower temperature range is dominated by the hopping mechanism, whereas the NNH model is followed in 260–190 K (Ea=92 meV), and then the 3D-VRH type of electrical conduction in 140–50 K region yields N(EF) = 2.91021 eV-1cm-3 and affirms the -Na0.33V2O5 sample as a Mott-insulator.
V Acknowledgments
RS thanks DST-Inspire, India for the fellowship, and the department of physics, IIT Delhi for providing XRD, PPMS and SQUID facilities. We thank Ravi Kumar and S. N. Jha for help and support during XAS measurements at RRCAT, India. RSD gratefully acknowledges the department of science & technology (DST), India for support through Indo-Australia early and mid-career researchers (EMCR) fellowship (IA/INDOAUST/F-19/2017/1887) and UNSW for hosting his visit. We acknowledge the support from SERB-DST through core research grant (CRG/2020/003436). CU acknowledges the support of the Australlian Research Council through the Discovery Grant DP160100545. We also thank Yousef Kareri for help during Raman spectroscopy measurements at UNSW, Australia.
References
- (1) M. Heinrich, H.-A. Krug von Nidda, R. M. Eremina, A. Loidl, Ch. Helbig, G. Obermeier, and S. Horn, Spin dynamics and charge order in -Na1/3V2O5, Phys. Rev. Lett. 93, 116402(1–4) (2004).
- (2) K. Ohwada, T. Yamauchi, Y. Fujii, and Y. Ueda, Two-dimensional charge fluctuation in -Na0.33V2O5, Phys. Rev. B 85, 134102 (2012).
- (3) T. Yamauchi, Y. Ueda, and N. Môri, Pressure-induced superconductivity in -Na0.33V2O5 beyond charge ordering, Phys. Rev. Lett. 89, 057002(1–4) (2002).
- (4) S. Sirbu, T. Yamauchi, Y. Ueda, and P. H. M. van Loosdrecht, Nonlinear transport in -Na0.33V2O5, Eur. Phys. J. B 53, 289–296 (2006).
- (5) T. Suzuki, I. Yamauchi, Y. Shimizu, M. Itoh, N. Takeshita, C. Terakura, H. Takagi, Y. Tokura, T. Yamauchi, and Y. Ueda, High-pressure 51V NMR study of the magnetic phase diagram and metal-insulator transition in quasi-one-dimensional -Na0.33V2O5, Phys. Rev. B 79, 081101(R) (2009).
- (6) T. Yamauchi, M. Isobe, and Y. Ueda, Charge order and superconductivity in vanadium oxides, Solid State Sci. 7, 874–881 (2005).
- (7) A. Grzechnik, Y. Ueda, T. Yamauchi, M. Hanfland, P. Hering, V. Potapkin, and K. Friese, Pressure-induced non-superconducting phase of -Na0.33V2O5 and the mechanism of high-pressure phase transitions in -Na0.33V2O5 and -Li0.33V2O5 at room temperature, J. Phys.: Condens. Matter 28, 035401(1–9) (2016).
- (8) R. Baddour-Hadjean, S. Bach, N. Emery, and J. P. Pereira-Ramos, The peculiar structural behaviour of -Na0.33V2O5 upon electrochemical lithium insertion, J. Mater. Chem. 21, 11296–11305 (2011).
- (9) R. Saroha, T. S. Khan, M. Chandra, R. Shukla, A. K. Panwar, A. Gupta, M. Ali Haider, S. Basu, and R. S. Dhaka, Electrochemical properties of Na0.66V4O10 nanostructures as cathode material in rechargeable batteries for energy storage applications, ACS Omega 4, 9878–9888 (2019).
- (10) M. Chandra, T. S. Khan, R. Shukla, S. Ahmed, A. Gupta, S. Basu, M. Ali Haider, and R. S. Dhaka, Diffusion coefficient and electrochemical performance of NaVO3 anode in Li/Na batteries, Electrochim. Acta 331, 135293(1–10) (2020).
- (11) P. M. Marley, G. A. Horrocks, K. E. Pelcher, and S. Banerjee, Transformers: the changing phases of low-dimensional vanadium oxide bronzes, Chem. Commun. 51, 5181–5198 (2015).
- (12) J. Galy, D. Lavaud, A. Casalot, and P. Hagenmuller, Les bronzes oxygénés de vanadium de formule CuxV2O5: I. structure cristalline des phases CuxV2O5 et CuxV2O5, J. Solid State Chem. 2, 531–543 (1970).
- (13) E. Khoo, J. M. Wang, J. Ma, and P. S. Lee, Electrochemical energy storage in a -Na0.33V2O5 nanobelt network and its application for supercapacitors, J. Mater. Chem. 20, 8368–8374 (2010).
- (14) I. Yamauchi, M. Itoh, T. Yamauchi, and Y. Ueda, Spin dynamics in quasi-one-dimensional conductor -Na0.33V2O3: 51V nuclear spin-lattice relaxation measurements, J. Phys. Soc. Jpn. 77, 104715(1–5) (2008).
- (15) B. K. Chakraverty, M. J. Sienko, and J. Bonnerot, Low-temperature specific heat and magnetic susceptibility of nonmetallic vanadium bronzes, Phys. Rev. B 17, 3781–3789 (1978).
- (16) H. Yamada and Y. Ueda, Magnetic, Electric and structural properties of -AxV2O5 (A = Na, Ag), J. Phys. Soc. Jpn. 68, 2735–2740 (1999).
- (17) C. Schlenker, R. Buder, V. D. Nguyen, J. Dumas, A. Friederich, D. Kaplan, and N. Sol, Magnetic susceptibility of NaxV2O5-, J. Appl. Phys. 50, 1720–1722 (1979).
- (18) R. D. Shannon and C. T. Prewitt, Effective ionic radii in oxides and fluorides, Acta Cryst. B25, 925–946 (1969).
- (19) K. Maruyama and H. Nagasawa, NMR studies of a quasi-one-dimensional conductor -Na0.33V2O5, J. Phys. Soc. Jpn. 48, 2159–2160 (1980).
- (20) J. B. Goodenough, Interpretation of MxV2O5- and MxV2-yTyO5- phases, J. Solid State Chem. 1, 349–358 (1970).
- (21) J. C. Badot, D. Gourier, F. Bourdeau, N. Baffier, and A. Tabuteau, Electronic properties of Na0.33V2O5 bronze obtained by the sol-gel process, J. Solid State Chem. 92, 8–17 (1991).
- (22) M. Itoh, N. Akimoto, M. Tsuchiya, H. Yamada, M. Isobe, and Y. Ueda, 51V NMR study of charge ordering in AV6O15 (A = Ca, Na and Ag), Physica B 281&282, 606–607 (2000).
- (23) K. Okazaki, A. Fujimori, T. Yamauchi, and Y. Ueda, Angle-resolved photoemission study of the quasi-one-dimensional superconductor -Na0.33V2O5, Phys. Rev. B 69, 140506(1-4) (2004).
- (24) Z. V. Popović, M. J. Konstantinović, V. V. Moshchalkov, M. Isobe, and Y. Ueda, Raman scattering study of charge ordering in -Ca0.33V2O5, J. Phys.: Condens. Matter 15, L139–L145 (2003).
- (25) Z. V. Popović, A. G. Kontos, Y. S. Raptis, M. Isobe, and Y. Ueda, Raman scattering study of -Sr0.33V2O5 in charge disordered and ordered phase, J. Phys.: Condens. Matter 18, 7779–7787 (2006).
- (26) Ajay Kumar, and R. S. Dhaka, Unraveling the magnetic interactions and spin state in insulating Sr2-xLaxCoNbO6, Phys. Rev. B 101, 094434 (2020).
- (27) H. Dua, R. Shukla, and R. S. Dhaka, Structural phase transition and its consequences on optical behavior of LaV1-xNbxO4, Phys. Rev. B 103, 174107 (2021).
- (28) S. Franck, C. A. Kuntscher, I. Gregora, J. Petzelt, T. Yamauchi, and Y. Ueda, Pressure-induced changes in the optical properties of quasi-one-dimensional -Na0.33V2O5, Phys. Rev. B 76, 075128(1–6) (2007).
- (29) C. Presura, M. Popinciuc, P. H. M. van Loosdrecht, D. van der Marel, M. Mostovoy, T. Yamauchi, and Y. Ueda, Charge-ordering signatures in the optical properties of -Na0.33V2O5, Phys. Rev. Lett. 90, 026402(1–4) (2003).
- (30) S. Osman, S. Zuo, X. Xu, J. Shen, Z. Liu, F. Li, P. Li, X. Wang, and J. Liu, Freestanding sodium vanadate/carbon nanotube composite cathodes with excellent structural stability and high rate capability for sodium-ion batteries, ACS Applied Materials & Interfaces 13(1), 816–826 (2021).
- (31) V. Ta Phuoc, C. Sellier, and E. Janod, Optical transitions in the two-leg ladder compounds AxV6O15 (A =Sr,Na), Phys. Rev. B 72, 035120 (2005).
- (32) M. Rahlenbeck, G. L. Sun, D. L. Sun, C. T. Lin, B. Keimer, and C. Ulrich, Phonon anomalies in pure and underdoped R1-xKxFe2As2 (R=Ba, Sr) investigated by Raman light scattering, Phys. Rev. B 80, 064509(1–5) (2009).
- (33) S. Basu, C. Nayak, A. K. Yadav, A. Agrawal, A. K. Poswal, D. Bhattacharyya, S. N. Jha, and N. K. Sahoo, A comprehensive facility for EXAFS measurements at the INDUS-2 synchrotron source at RRCAT, Indore, India, J. Phys.:Conf. Ser. 493, 012032(1–4) (2014).
- (34) M.-L. Doublet, and M.-B. Lepetit, Leading interactions in the -SrV6O15 compound, Phys. Rev. B 71, 075119(1–7) (2005).
- (35) H. Smolinski, C. Gros, W. Weber, U. Peuchert, G. Roth, M. Weiden, and C. Geibel, NaV2O5 as a quarter-filled ladder compound, Phys. Rev. Lett. 80, 5164–5167 (1998).
- (36) K. Momma and F. Izumi, VESTA 3 for three-dimensional visualization of crystal, volumetric and morphology data, J. Appl. Cyst. 44, 1272–1276 (2011).
- (37) See Supplemental Material at http://link.aps.org/supplemental/xxxx for further information about the structural parameters including atomic positions and bond-lengths, obtained from the Rietveld refinement of the x-ray diffraction pattern.
- (38) A. D. Wadsley, The crystal structure of Na2-xV6O15, Acta Cryst. 8, 695–701 (1955).
- (39) I. Loa, U. Schwarz, M. Hanfland, R. K. Kremer, and K. Syassen, Crystal structure and optical spectroscopy of NaV2O5 under pressure, phys. stat. sol. (b) 215, 709–714 (1999).
- (40) Z. V. Popović, M. J. Konstantinović, R. Gajić, V. N. Popov, M. Isobe, Y. Ueda, and V. V. Moshchalkov, Phonon dynamics in AV2O5 (A =Na,Ca,Mg,Cs) oxides, Phys. Rev. B 65, 184303(1–8) (2002).
- (41) Z.V. Popović, M. J. Konstantinović, R. Gajić, V. Popov, Y. S. Raptis, A. N. Vasil’ev, M. Isobe, and Y. Ueda, Lattice vibrations in spin-Peierls compound NaV2O5, Solid State Commun. 110, 381–386 (1999).
- (42) W. S. Bacsa, R. Lewandowska, A. Zwick, and P. Millet, Anisotropic electron-phonon coupling in -NaV2O5, Phys. Rev. B 61, R14885–R14888 (2000).
- (43) P. J. Graham, P. Rovillain, M. Bartkowiak, E. Pomjakushina, K. Conder, M. Kenzelmann, and C. Ulrich, Phys. Rev. B 105, 174438 (2022).
- (44) S. Buchenau, S. Scheitz, A. Sethi, J. E. Slimak, T. E. Glier, P. K. Das, T. Dankwort, L. Akinsinde, L. Kienle, A. Rusydi, C. Ulrich, S. L. Cooper and M. Rbhausen, Phys. Rev. B 101, 245431 (2022).
- (45) A. Meetsma, J. L. de Boer, A. Damascelli, J. Jegoudez, A. Revcolevschi, and T. T. M. Palstra, Inversion symmetry in the spin-Peierls compound -NaV2O5, Acta Cryst. C54, 1558–1561 (1998).
- (46) G. Lucazeau, Effect of pressure and temperature on Raman spectra of solids: anharmonicity, J. Raman Spectrosc. 34, 478–496 (2003).
- (47) M. Maczka, M. Ptak, K. P. da Silva, P. T. C. Freire, and J. Hanuza, High-pressure Raman scattering and an anharmonicity study of multiferroic wolframite-type Mn0.97Fe0.03WO4, J. Phys.: Condens. Matter 24, 345403(1–7) (2012).
- (48) M. Balkanski, R. F. Wallis, and E. Haro, Anharmonic effects in light scattering due to optical phonons in silicon, Phys. Rev. B 28, 1928–1934 (1983).
- (49) P. G. Klemens, Anharmonic decay of optical phonons, Phys. Rev. 148, 845–848 (1966).
- (50) J. Menéndez and M. Cardona, Temperature dependence of the first-order Raman scattering by phonons in Si, Ge, and -Sn: anharmonic effects, Phys. Rev. B 29, 2051–2059 (1984).
- (51) L. Bergman, D. Alexson, P. L. Murphy, R. J. Nemanich, M. Dutta, M. A. Stroscio, C. Balkas, H. Shin, and R. F. Davis, Raman analysis of phonon lifetimes in AlN and GaN of wurtzite structure, Phys. Rev. B 59, 12977–12982 (1999).
- (52) D. Yadav, N. Bura, A. Bhoriya, J. Singh, and N. D. Sharma, Estimation of anharmonic parameters of nano-crystalline Sc2O3 and Nd2O3, Mater. Today Commun. 29, 102759(1–9) (2021).
- (53) W. Baltensperger and J. S. Helman, Influence of magnetic order in insulators on the optical phonon frequency, Helv. Phys. Acta 41, 668 (1968).
- (54) D. J. Lockwood and M. G. Cottam, The spin-phonon interaction in FeF2 and MnF2 studied by Raman spectroscopy, J. Appl. Phys. 64, 5876–5878 (1988).
- (55) E. Granado, A. García, J. A. Sanjurjo, C. Rettori, I. Torriani, F. Prado, R. D. Sánchez, A. Caneiro, and S. B. Oseroff, Magnetic ordering effects in the Raman spectra of La1-xMn1-xO3, Phys. Rev. B 60, 11879–11882 (1999).
- (56) A. B. Sushkov, O. Tchernyshyov, W. Ratcliff II, S. W. Cheong, and H. D. Drew, Probing spin correlations with phonons in the strongly frustrated magnet ZnCr2O4, Phys. Rev. Lett. 94, 137202 (2005).
- (57) U. Kbler and R. Marx, Susceptibility study of physisorbed oxygen layers on graphite, Phys. Rev. B 35, 9809–9816 (1987).
- (58) M. Isobe and Y. Ueda, Magnetic susceptibility of quasi-one-dimensional compound -NaV2O5-possible spin-peierls compound with high critical temperature of 34 K, J. Phys. Soc. Jpn. 65, 1178–1181 (1996).
- (59) A. N. Vasil’ev, V. I. Marchenko, A. I. Smirnov, S. S. Sosin, H. Yamada, and Y. Ueda, Magnetic ordering in the mixed-valence compound -Na0.33V2O5, Phys. Rev. B 64, 174403(1–6) (2001).
- (60) G. Obermeier, D. Ciesla, S. Klimm, and S. Horn, Pressure dependence of phase transitions in the quasi-one-dimensional metal-insulator transition system -Na1/3V2O5, Phys. Rev. B 66, 085117(1–5) (2002).
- (61) P. Bougiatioti, O. Manos, C. Klewe, D. Meier, N. Teichert, J.-M. Schmalhorst, T. Kuschel, and G. Reiss, Electrical transport and optical band gap of NiFe2Ox thin films, J. App. Phys. 122, 225101(1–8) (2017).
- (62) R. Shukla and R. S. Dhaka, Anomalous magnetic and spin glass behavior in Nb-substituted LaCo1-xNbxO3, Phys. Rev. B 97, 024430(1–9) (2018).
- (63) C. Zobel, M. Kriener, D. Bruns, J. Baier, M. Grninger, T. Lorenz, P. Reutler, and A. Revcolevschi, Evidence for a low-spin to intermediate-spin state transition in LaCoO3, Phys. Rev. B 66, 020402(1–4) (2002).
- (64) N. F. Mott, Conduction and switching in non-crystalline materials, Contemp. Phys. 10, 125–138 (1969).
- (65) D. K. Paul and S. S. Mitra, Evaluation of Mott’s parameters for hopping conduction in amorphous Ge, Si and Se-Si, Phys. Rev. Lett. 31, 1000–1003 (1973).
- (66) S. Hfner, Photoelectron spectroscopy: principles and application, 3rd ed. (Springer-Verlag, 2003).
- (67) G. Silversmit, D. Depla, H. Poelman, G. B. Marin, and R. De Gryse, Determination of the V 2 XPS binding energies for different vanadium oxidation states (V5+ to V0+), J. Electron. Spectrosc. Relat. Phenom. 135, 167–175 (2004).
- (68) J. Mendialdua, R. Casanova, and Y. Barbaux, XPS studies of V2O5, V6O13, VO2, and V2O3, J. Electron. Spectrosc. Relat. Phenom. 71, 249–261 (1995).
- (69) G. A. Sawatzky and D. Post, X-ray photoelectron and Auger spectroscopy study of some vanadium oxides, Phys. Rev. B 20, 1546–1555 (1979).
- (70) R. Zimmermann, R. Claessen, F. Reinert, P. Steiner, and S. Hfner, Strong hybridization in vanadium oxides: evidence from photoemission and absorption spectroscopy, J. Phys.: Condens. Matter 10, 5697–5716 (1998).
- (71) R. Precht, S. Stolz, E. Mankel, T. Mayer, W. Jaegermann, and R. Hausbrand, Investigation of sodium insertion into tetracyanoquinodimethane (TCNQ): results for a TCNQ thin film obtained by a surface science approach, Phys. Chem. Chem. Phys. 18, 3056–3064 (2016).
- (72) R. Shukla, A. Kumar, R. Kumar, S. N. Jha, and R. S. Dhaka, X-ray absorption spectroscopy study of La1-ySryCo1-xNbxO3, J. Phys. Chem. C 125, 10130–10139 (2021).
- (73) B. Ravel and M. Newville, ATHENA, ARTEMIS, HEPHAESTUS: data analysis for x-ray absorption spectroscopy using IFEFFIT, J. Synchrotron Rad. 12, 537–541 (2005).
- (74) T. Yamamoto, Assignment of pre-edge peaks in K-edge x-ray absorption spectra of 3d transition metal compounds: electric dipole or quadrupole?, X-Ray Spectrom. 37, 572–584 (2008).
- (75) B. Ravel, Path degeneracy and EXAFS analysis of disordered materials, J. Synchrotron Rad. 21, 1269–1274 (2014).
- (76) Ajay Kumar, R. Shukla, R. Kumar, R. J. Choudhary, S. N. Jha, and R. S. Dhaka, Electronic and local structure investigation of Sr2-xLaxCoNbO6 using near-edge and extended x-ray absorption fine structures, Phys. Rev. B, 105, 245155 (2022).