Emotion–Centric Requirements Change Handling in Software Engineering
Abstract
Background: Requirements Changes (RCs) – the additions/modifications/deletions of functional/non-functional requirements in software products – are challenging for software practitioners to handle. Handling some changes may significantly impact the emotions of the practitioners. Objective: We wanted to know the key challenges that make RC handling difficult, how these impact the emotions of software practitioners, what influences their RC handling, and how RC handling can be made less emotionally challenging. Method: We followed a mixed-methods approach. We conducted two survey studies, with 40 participants and 201 participants respectively. The presentation of key quantitative data was followed by descriptive statistical analysis, and the qualitative data was analysed using Strauss–Corbinian Grounded Theory, and Socio–Technical Grounded Theory analysis techniques. Findings: We found (1) several key factors that make RC handling an emotional challenge, (2) varying emotions that practitioners feel when it is challenging to handle RCs, (3) how stakeholders, including practitioners themselves, peers, managers and customers, influence the RC handling and how practitioners feel due to the stakeholder influence, and (4) practices that can be used to better handle RCs. Conclusion: Some challenges are technical and some are social which also belong to aspects of agile practice, emotional intelligence, and cognitive intelligence. Therefore, to better handle RCs with positive emotions in socio–technical environments, agility, emotional intelligence, and cognitive intelligence need to cooperate with each other.
Index Terms:
emotions, emotional intelligence, affects, requirements, changes, human factors, mixed-methods, software engineering, software teams, socio-technical grounded theory, agile, job-related affective well-being scale, well-being, workplace awareness1 Introduction
Emotions are a fundamental part of being human. Scherer defines emotions as “a sequence of interrelated, synchronised changes in the states of all the five organismic subsystems (information processing, support, executive, action, and monitoring) in response to the evaluation of an external or internal stimulus event as relevant to central concerns of the organism” [1]. While emotions play a vital role for human beings, in general requirements changes (RCs) play an important role in software development teams.
RCs can be additions/modifications/deletions of functional/non-functional requirements of any software [2]. As RCs are unavoidable and impact the scope, cost, and time of the software development project, RCs can often be challenging for software practitioners to handle. RCs also act as stimuli in triggering the emotions of software practitioners who handle them. Existing research recognises the association between emotions and behavior [3], cognition [3], productivity [3], [4], [5], [6], and decision-making [7].
Over the past decade, many studies have been conducted to explore the impact of emotions of software practitioners in general, and emotions and their impact on productivity [6], [8], [9], [10], [11], [12]. Furthermore, in light of the recent global pandemic, there has been renewed interest in studying emotions in software engineering (SE) contexts [13]. However, less attention has been given to investigating the emotions of practitioners while handling requirements or RCs [14], [15].
We conducted two studies on RCs and emotional responses to RCs as worldwide survey studies111Approved by Monash Human Research Ethics Committee. Approval Number: 23578, one focusing solely on RCs (survey Alpha: 40 participants) and the other on emotional responses to RCs (survey Beta: 201 participants).
Through the analysis of survey Alpha data using descriptive statistical analysis and Strauss-Corbinian Grounded Theory analysis techniques [16], we found several key factors that make RC handling challenging. In survey Beta, using Job related Affective Well-being Scale (JAWS) [17], and Socio–Technical Grounded Theory for data analysis (STGT4DA) [18], we explored how practitioners feel when they find it challenging to handle RCs. We also investigated how stakeholders influence the overall handling of a RC throughout its life cycle. By synthesising findings from both survey Alpha and Beta we found the most common RC handling techniques practitioners use upon receiving RCs to prior development, i.e., pre–development RC handling techniques.
These findings ultimately led to derive a set of recommended practices that can be utilised throughout the RC handling life cycle.
The key contributions of this paper are:
-
•
Key factors that make RC handling a challenge;
-
•
How practitioners feel due to RC challenges
-
•
How stakeholders influence practitioners’ emotions when handling RCs;
-
•
A number of recommendations for practitioners for a better RC handling experience; and
-
•
A number of future research directions for researchers.
2 Motivation, Research Questions and Definitions
2.1 Motivation
2.1.1 Motivation from Experience
Imagine Kash, a software developer, who unexpectedly receives an RC to work on. The RC’s high complexity, high cascading impact, large size, imprecise/ unclear definition, high priority, high required effort, and difficult/ irregular access to the customer made it challenging for Kash to handle the RC. On top of this, cross–functionality was forced within her team. All these factors make Kash feel high anxiety and low pleasurable emotions. She thinks that if she had some pre–development techniques to use early and some best practices, these could make handling the RC easier. This could also arouse higher pleasurable emotions in her RC handling work. We wanted to help software practitioners like Kash by better understanding their emotional responses to RCs, and then providing such guidance when they go about handling RCs.
2.1.2 Motivation from Related Work
RC Handling in Agile Contexts. Given that agile being widely used in software development, secondary studies on agile requirements engineering, practices, and challenges highlight that studies on functional and non-functional requirements, process support and management, process quality and improvement, requirement negotiation, and acceptance tests have been studied extensively [19]. Also, studies on benefits of agile RE over traditional RE as a research area is saturated [20], studies on user and stakeholder involvement are in a high volume [21], and requirement prioritisation and testing before coding have been studied widely [22]. However, studies on changes in requirements [19], and change management lacks attention in research [20], [21], [22].
Emotions in Software Engineering. According to Muller and Fritz, the reasons for increase in emotions/progress during software development are, localising relevant code, better understanding of parts of the code, clear next steps, writing code, and having new ideas. And, the reasons for decreases in emotions/progress are, difficulty in understanding how parts of the code/API work, difficulty in localising relevant code, not being sure about next steps, realising that hypothesis on how code works is wrong, and missing/insufficient documentation [7]. Furthermore, a negative link exists between hurry and number of commits, a negative relationship exists between social interaction and hindered work well-being [23], and emotions of a technical question impacts the probability of obtaining satisfying answers [24]. Security related discussions on GitHub contain more negative emotions than other discussions [25]. Also, frustration is felt most often during software development [9]. This lowers productivity, while anger increases productivity, enthusiasm increases productivity, and emotions transit from frustration anger contentment enthusiasm [9]. Anxiety and nervousness are felt when presenting and satisfaction and enjoyment are felt when coding [26]. However, emotional awareness increases developer’s progress by mitigating negative emotions [27]. In summary, research has been done on exploring emotions in SE in general during/ post development [28, 29, 30, 5, 27, 31, 32, 33, 25, 12, 24, 34], including how emotions impact productivity [9, 10, 8], progress [35, 7], and how practices impact the emotions [26], relationship between emotions and problem solving [11], and relationship between affective states and software metrics [23]. However, research on emotions during requirements engineering activities, including while handling RCs is extremely limited [36, 14, 15].
2.2 Research Questions
The key research questions that we wanted to answer in this study are:
-
RQ1.
What are the factors that make RC handling a challenge? We were interested in understanding “what” makes the RC handling a challenge. We conducted survey Alpha to answer this research question.
-
RQ2.
How do practitioners feel when it is challenging to handle RCs? We wanted to know how practitioners feel various emotions when they handle RCs. The open–ended questions in Survey Beta resulted in details about how practitioners feel when it is challenging for them to handle their RCs.
-
RQ3.
How do stakeholders influence the handling of RCs emotionally and how do software practitioners feel about this influence? The open–ended questions in survey Beta illuminated how stakeholders influence the overall handling of RCs, and how practitioners feel about their influence on handling of RCs. As we identified a range of key stakeholders – practitioner, peers in the team, manager, and customers – we further breakdown this research question to sub–research questions:
-
RQ3.1.
How do practitioners themselves influence the handling of RCs?
-
RQ3.2.
How do peers in the team influence the handling of RCs?
-
RQ3.3.
How do team managers influence the handling of RCs?
-
RQ3.4.
How do customers influence the handling of RCs?
-
RQ3.1.
-
RQ4.
How do practitioners approach handling RCs while managing emotions? We asked about the techniques practitioners use to handle RCs and make their RC handling more emotionally easier. This emerged from the answers given to the open–ended questions in both surveys.
2.3 Definitions
We use the terms presented in Table I throughout the paper. The cited definitions are directly from the sources and not paraphrased.
| Term | Definition | ||||||
| Agility |
|
||||||
| Cognitive intelligence |
|
||||||
| Emotion |
|
||||||
| Emotional intelligence |
|
||||||
| Emotion regulation |
|
||||||
| Emotion response |
|
||||||
| Empathy |
|
||||||
| Requirements Change |
|
3 Study Design
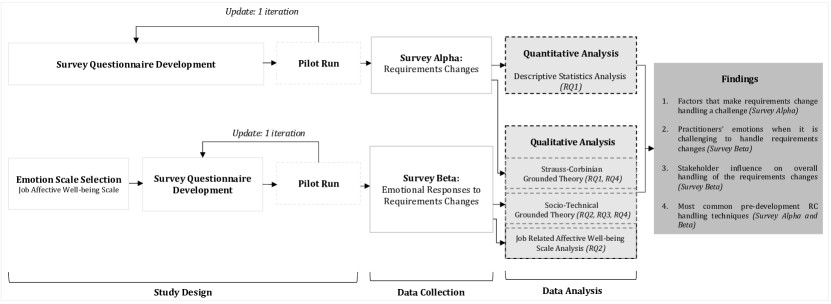
We conducted two studies (survey Alpha and Beta) to gain an in–depth understanding of how RCs arise during software development (Alpha) and how practitioners emotionally respond to these RCs (Beta). Replication packages including the questionnaires and data for both survey Alpha and survey Beta are available online222https://github.com/users/kashumi-m/projects/1. Fig 1 outlines the conduct of the studies, further explained in detail below and in the upcoming sub–sections.
Survey Alpha. First, we developed the survey questionnaire (Section 3.2), then conducted a pilot study to receive feedback and better refine the survey questions. Then we collected data on RCs (Section 3.4). The collected data followed a descriptive statistical analysis (quantitative data) and Strauss–Corbinian Grounded Theory analysis (qualitative data) (Section 3.5). The findings from this analysis answered RQ1.
Survey Beta. Survey Beta started with selecting an emotion scale appropriate for our study (Section 3.3). Then, similar to survey Alpha, we developed the survey (Section 3.3), and conducted the pilot study to refine the survey questionnaire. After this step, we collected data on emotional responses to RCs (Section 3.4). We then used descriptive statistical analysis (quantitative data), and Socio–Technical Grounded Theory analysis and Job related Affective Well–being Scale (qualitative data) to analyse the data. This analysis resulted in answering RQ2 and RQ3.
3.1 Survey Questionnaire Development
We developed both questionnaires of survey Alpha and Beta by following Kitchenham et al.’s [41], [42], and Punter et al.’s [43] guidelines. Both questionnaires had questions on demographic information, project information, and team information of the participants. The rest of the questions of survey Alpha focused on RCs and the survey Beta focused on emotional responses to RCs. We used Qualtrics333https://www.qualtrics.com/ as the survey platform in both cases.
3.2 Survey Alpha
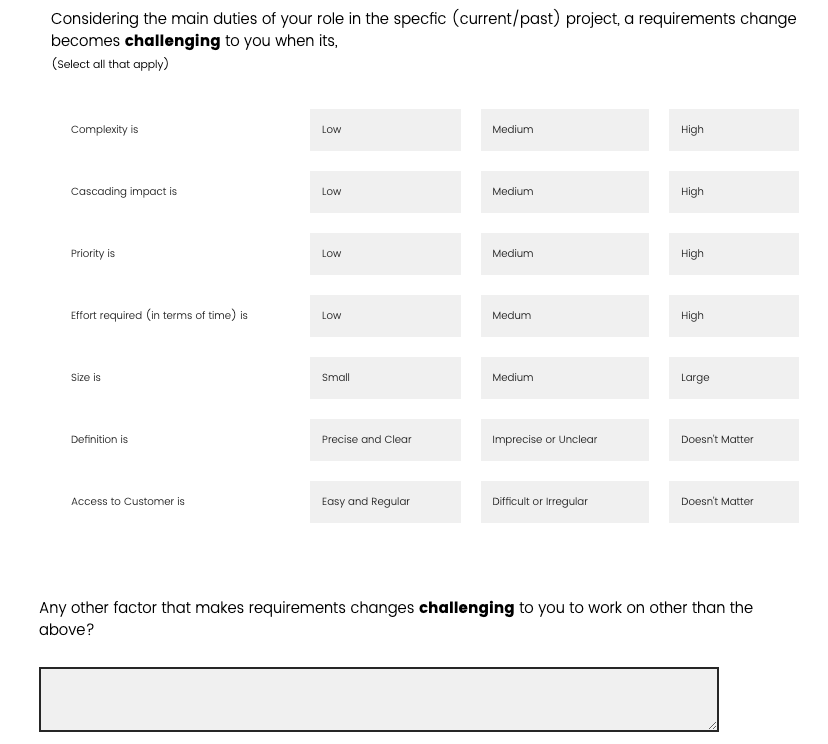
The complete survey questionnaire of survey Alpha is available in the replication package. In Fig. 2 we present the question that we used to answer RQ1 and RQ4. The participants were allowed to choose their choices from the closed–ended question, and also they had the opportunity to give their opinions through the open–ended question.
To develop the choices for the closed–ended question, we consulted literature, our previous interview–based study, and our own collective industry experience. We considered complexity, cascading impact, size of RC, effort required, definition, priority, and access to customer as the factors that make RC handling challenging. According to Boehm [44], complexity is one of the important drivers in software cost. We combined requirements dependability and change conflicts with existing requirements, which are considered as challenges in RC management in general [45] as cascading impact. Furthermore, we derived access to customer from a previous interview–based study we conducted and also adapted from Hoda et al.’s work [46] and Anwer et al.’s work [45] along with prioritisation as prioritisation is a challenge in RC management in general. Other metrics: size of RC, effort required, and definition were hypothesised based on experience. Complexity, cascading impact, effort required, and priority followed the dimensions “low, medium, high”.
We used “small, medium”, and “large” as the dimensions for size of RC. The dimensions “imprecise or unclear, doesn’t matter”, and “precise and clear” were used for the factor definition. Difficult or irregular, doesn’t matter, and easy and regular were used for the factor access to customer.
3.3 Survey Beta
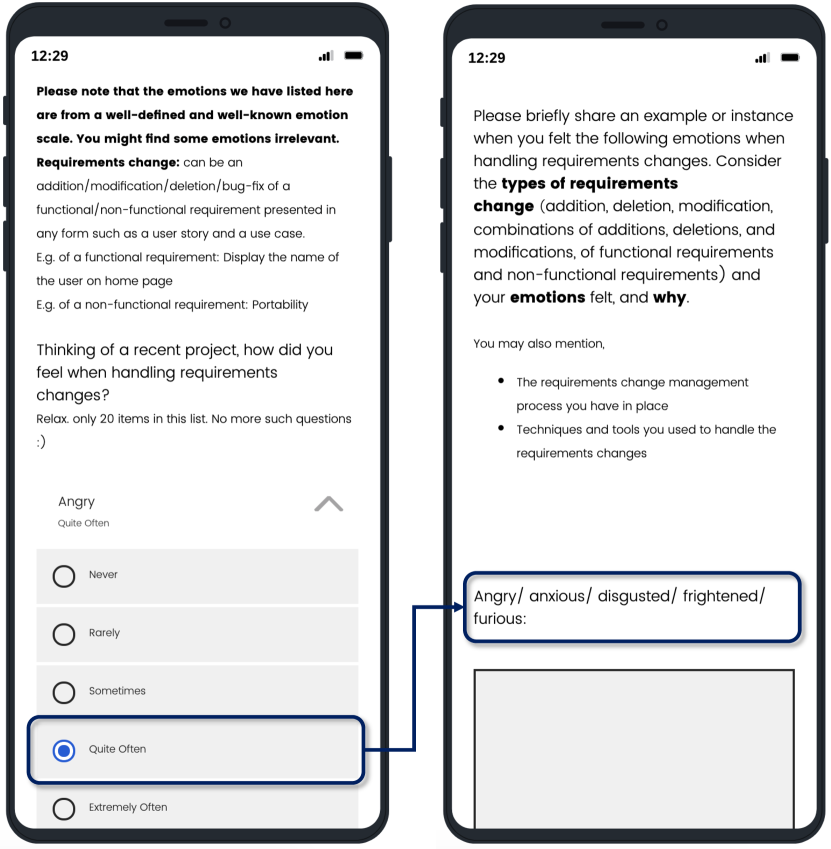
In order to describe and capture emotional responses to RCs, we needed a set of emotions and scale to capture them. We evaluated 20 well-established emotion scales from psychology – the 15 as described in [47], as well as PANAS [48], SPANE [49], JES [50], DEQ [51], and JAWS [17]. We compared their categorisation of emotions and their applicability for use to describe practitioners’ emotional responses to RCs. Through our analysis, we found 3 scales – Discrete Emotions Questionnaire (DEQ), Job Emotion Scale (JES), and Job-related Affective Well-being Scale (JAWS) – to be appropriate scales for use in our study. We found these scales as appropriate for study as the majority of the emotions given in these scales are commonly felt in software engineering contexts given our own industrial experience, whereas other scales consist of less common emotions felt in software engineering contexts. From our own industrial experience, we decided not to use DEQ as we came across certain emotions that were irrelevant for software development teams (e.g.: “terror” and “craving”). In our previous work [14], we used JES which consists of 16 emotions. However, we wanted to gain a more comprehensive understanding of emotional responses to RCs. Therefore, finally we decided to use JAWS which has been used widely to assess emotional reactions of people to their jobs. As our survey Beta questionnaire asked the participants to respond to the questions by thinking of the current or most recent project they worked on, we found JAWS likely to be the most appropriate emotion scale for our study.
JAWS has two forms: long form (30 emotions) and short form (20 emotions). We utilised the short form which the authors of JAWS claim as the form that is most commonly used [52]. The 20 emotions in JAWS are categorised into 4 sub-scales along the dimensions: pleasure and arousal (intensity). The sub-scales are namely, High pleasurable-High arousal (High2), High pleasurable-Low Arousal (High1), Low pleasurable-High Arousal (Low1), and Low pleasurable-Low Arousal (Low2). We abbreviated the sub-scales as above by making the abbreviation central to the pleasure. i.e., for example, when both pleasure and arousal are high, we abbreviated it as high2; otherwise high1. The emotions under each sub-scale are given in Table II. The scale allows the participants to select one of the following five choices choice per emotion: never, rarely, sometimes, quite often, and extremely often.
| Sub Scale | Emotion |
| High2 | Energetic, Excited, Ecstatic, Enthusiastic, Inspired |
| High1 | At-ease, Calm, Content, Satisfied, Relaxed |
| Low1 | Angry, Anxious, Disgusted, Frightened, Furious |
| Low2 | Bored, Depressed, Discouraged, Gloomy, Fatigued |
After we selected the emotion scale to use, we developed the questionnaire for survey Beta, available in the replication package. The open–ended questions that were used to answer RQ2 followed this approach. First, we allowed participants to indicate how they feel when handling RCs through a closed–ended question (complete JAWS scale). Then, upon the selection of their emotions in that question, they were prompted with open–ended questions representing the sub–scales of the emotions in JAWS. This is illustrated in Fig. 3.
3.4 Data Collection
The data collection steps we followed during the two survey studies are summarised in Table III. First we conducted pilot studies (as a part of the study design), then refined the questionnaire based on the feedback we received from pilot study participants, and finally recruited participants through various techniques. The key difference between the data collection techniques used in the surveys was the sampling methods used (DC 3.1. and DC 3.2.). In survey Alpha (40 participants), we used convenience sampling due to convenient access to participants, time and budget constraints. In survey Beta (201 participants), we used random sampling first to get a sample to represent the survey development population (as in [53] 18.9 M in 2019; sample size required=385 participants) and then purposive sampling to have fair geographical distribution and gender distribution. However, in survey Beta, we did not collect data from 385 participants as the data we collected met our requirement on saturation of quantitative data collected, i.e., when we identified the most common emotions felt during RC handling (results are given in [15]), where no more data collection was necessary. We did not collect any identifiable information such as personal information from the participants, except from the participants who provided their details voluntarily for the participation in future studies.
| Steps | Survey Alpha | Alpha Participants | Survey Beta | Beta Participants | ||||||||||||||||
| DC1. |
|
\faCheckSquare |
|
\faCheckSquare |
|
|||||||||||||||
| DC2. |
|
|
|
|||||||||||||||||
| DC3. | Recruit participants | |||||||||||||||||||
| DC3.1. |
|
\faCheckSquare |
\rdelim}15.5*[
|
\faCheckSquare | \rdelim}4.5*[ 42 participants (Random sampling: 37 participants; purposive sampling: 5 participants) ] | |||||||||||||||
| DC3.2. |
|
\faCheckSquare | \faCheckSquare | |||||||||||||||||
| DC3.3. | Using other recruitment techniques |
|
|
|
||||||||||||||||
| Collected data relavant to this paper | Quantitatve and Qualitative data | Qualitative data | ||||||||||||||||||
3.5 Data Analysis
The data analysis steps we followed are given in Table IV. Survey Alpha and Beta followed different approaches in data analysis.
| Step | Survey Alpha | Survey Beta | ||||||||||||||
| DA1. | Quantitative analysis |
|
N/A to this paper | |||||||||||||
| DA2. | Qualitative analysis |
|
|
|||||||||||||
| DA3. |
|
|
||||||||||||||
Quantitative Analysis (DA1): Quantitative analysis where descriptive statistical analysis was done for quantitative data collected via both surveys. However, we only report the quantitative analysis of survey Alpha findings (using Microsoft Excel) here, as survey Beta quantitative analysis findings (using Python) are out of the scope of this paper, and are presented in [15].
Qualitative Analysis (DA2): Qualitative analysis approaches in the 2 surveys are different from each other – survey Alpha focused only on RCs, and survey Beta focused on both emotions and RCs. Survey Alpha only followed the open coding and constant comparison techniques of Strauss–Corbinian Grounded Theory (GT) [16] (using Microsoft Excel). We used Strauss–Corbinian GT due to its structured approach of data analysis and our previous experience in using it. By the time of the first study, STGT4DA was not introduced yet. Therefore, STGT4DA was not used in survey Alpha.
In survey Beta, we followed a combined qualitative approach of JAWS analysis and open coding and constant comparison techniques as in STGT4DA [18] (using MAXQDA444https://www.maxqda.com/ majorly and Microsoft Excel as needed). We used STGT4DA due to its suitability to apply in socio–technical studies, its similarity to Strauss–Corbinian GT data analysis techniques where we had previous experience in, and our interest in applying it. Since the open coding and constant comparison techniques are the same in Strauss–Corbinian GT and STGT4DA, here we only explain the combined qualitative data analysis approach we took in Survey Beta. Below, we further explain the analysis through examples.
DA2.1. JAWS analysis: As the open–ended questions were developed to allow participants to report their experiences in feeling the specific emotions as given in the question (emotion sub–scale of JAWS), the participants used the exact terms of emotions as in JAWS. In cases where the participants did not mention the emotion, we considered that they felt the emotions in that particular sub–scale in general. For example, we extracted the emotion “anxious” from raw data ““Anxious when I feel the new technology is difficult to learn”.
DA2.2. STGT analysis: STGT served our analysis in two key ways. (1) It helped us in identifying the evidence in survey Beta data for emotions for RC handling challenging factors found in survey Alpha. As given in Table VIII, we found evidence for each RC challenging factor along their dimensions using STGT4DA. For example, when participant P94 answered the question on when he felt high2 emotions as “when the implementation turns out to be less complex than initially specified”, we were able to know that when complexity (challenging factor) is low (dimension), P94 felt high2 emotions in general. However, we found these organically, i.e., we did not force the findings to emerge but later on aided in identifying evidence for RC challenging factors in survey Beta. (2) emergence of pre–development techniques and stakeholder factors in survey Beta.
We first open coded the qualitative data (interpreted the data in small, meaningful chunks of words). We then compared these codes using constant comparison and produced concepts where similar codes were grouped together. Constant comparison was applied again on concepts to produce sub–categories. After sub–category creation, we repeated the same to produce categories. For example, raw data “Anxious when I feel the new technology is difficult to learn” yielded in the code “difficulty in learning [new technology]” which we compared with similar codes to produce the concept “difficulty in learning/ acquiring new knowledge’, followed by the sub-category “practitioner–related factors” and the category “stakeholder factors”.
DA3. Data synthesis: Memoing can take different forms (verbal, textual, visual). Here we used visual memos as it was easy to uncover the connections between the findings of the two studies. We observed the findings from a socio–technical perspective, and that allowed us to identify the connection between the findings. We found the challenging factors of effort, cross-functionality within the team, and access to the customer related to the stakeholders. The conceptual model representing the relationships between the findings from survey Alpha and survey Beta is given in Fig. 5.
4 Participant and Project Context
4.1 Demographic Data of Participants
A summary of demographic data of participants for both surveys is given in Table V. The majority of survey Alpha participants represented Asia (N=26; 65%) whereas the majority of survey Beta participants represented North America (N=96; 47.78%). The most commonly played role of both surveys’ participants was developer (Alpha (N=18; 45%); Beta (N=75; 37.31%)). Survey Alpha participants had a mean total experience of 8.74 years (min(total experience)=1 year; max(total experience)=30 years), and a mean total agile experience of 4.4 years (min(total agile experience)=1 year; max(total experience)=20 years). Survey Beta participants had a mean total experience of 7.8 years (min(total experience)=1 year; max(total experience)=35 years), and a mean total agile experience of 5.12 years (min(total agile experience)=0 years; max(total experience)=20 years).
| Survey Alpha (Other: 2 participants) | |||
| Location | # of Participants | Role | # of Participants |
| Asia | 26 | Dev | 15 |
| Australasia | 9 | Tester | 8 |
| North America | 3 | AC/SM | 5 |
| Europe | 2 | BA | 3 |
| Gender | # of Participants | PO | 3 |
| Male | 23 | Other | 6 |
| Female | 17 | ||
| XT | # of Years | XTA | # of Years |
| Minimum | 1 | Minimum | 1 |
| Maximum | 30 | Maximum | 20 |
| Mean | 8.74 | Mean | 4.4 |
| Survey Beta (Other: 5 participants) | |||
| Location | # of Participants | Role | # of Participants |
| North America | 96 | Dev | 75 |
| Asia | 40 | Manager | 21 |
| Europe | 24 | BA | 19 |
| Australasia | 22 | Dev, Tester | 14 |
| South America | 17 | Tester | 10 |
| Africa | 2 | Dev, Manager | 9 |
| Gender | # of Participants | AC/SM | 8 |
| Male | 115 | AC/SM, Dev | 7 |
| Female | 85 | Other | 38 |
| Gender diverse | 1 | ||
| XT | # of Years | XTA | # of Years |
| Minimum | 1 | Minimum | 0 |
| Maximum | 35 | Maximum | 20 |
| Mean | 7.84 | Mean | 5.12 |
4.2 Project and Team Information of Participants
A summary of project and team information for both surveys is given in Appendix A. The projects that both survey participants chose to answer the questionnaires were new developments (Alpha (N=26; 65%), Beta (N=115; 57.21%)). All participants of survey Alpha used agile methods in their projects (N=40; 100%) as we only targeted agile practitioners in survey Alpha, and the majority of survey Beta participants used agile methods in their projects as well (N=176; 87.56%). Therefore, overall, 89.32% (N=216) participants from both the surveys used agile in their projects which is in line with reported agile use in the industry [54], where RCs are common.
5 Findings
5.1 Factors that make RC handling a challenge (Answer to RQ1)
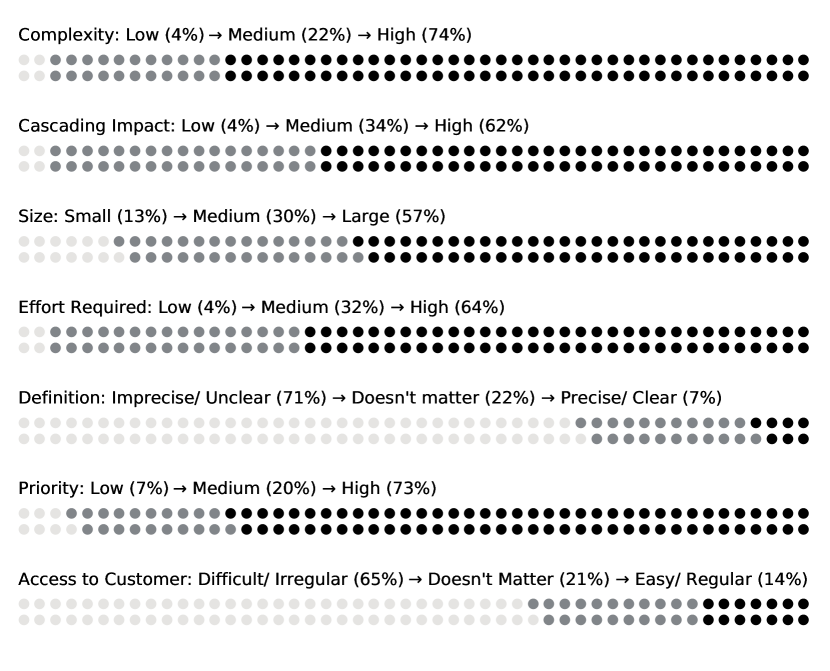
Quantitative analysis of survey responses are shown in Fig. 4. Taking the top most responded results by the participants into consideration, an RC is seen as challenging when its
-
•
complexity is high and/or;
-
•
cascading impact is high and/or;
-
•
size is large and/or;
-
•
effort required is high and/or;
-
•
definition is imprecise or unclear and/or;
-
•
priority is high and/or;
-
•
access to customer is difficult or irregular.
Apart from complexity, cascading impact, size, effort required, definition, priority, and access to customer, our analysis of open–ended responses resulted in identifying that forced cross-functionality make the RC handling challenging. For example, when business analysts try to force the completion of development; there is insufficient impact analysis of the RC by developers; and developers are disengaged from thinking deeply about the RC.
“..disengaged from thinking & expecting others to do the thinking & exploring of expected business value (“I just want to write code, man!”)” – P25
Based on the above quantitative and qualitative data analysis, we define a challenging RC as per below:
5.2 How do Practitioners Feel when it is Challenging to Handle RCs (Answer to RQ2)
The key challenge factors, the key emotions felt, some representative examples, and roles of the participants who reported the challenges and emotions are given in Appendix B and described below.
Complexity. As stated by several participants, when the RC is not complicated to work on, they tend to feel both high2 (e.g.: excited, energetic) and high1 (e.g.: content, calm, relaxed) emotions. Even when the RC complexity that was originally specified changes to a less complicated one, they tend to feel high pleasurable emotions. For example, as P194 mentioned, they felt high2 emotions when the implementation turned out to be less complex than it was initially specified. In contrast, when an RC is complicated to work on, they tend to feel more low1 emotions (e.g.: anxiety), as mentioned by a few participants. For example, 82 mentioned, additions and/or modifications that were highly complex made them feel low1 emotions.
Cascading Impact. When the impact of the RC on the other requirements, including the ones that have already been developed, is low, the practitioners tend to feel high1 emotions (e.g.: content). However, when the cascading impact is high – such as when several changes have to be done together to realise the RC, such as design-level changes in the database, application, and program structure – practitioners tend to feel both low1 (e.g.: angry) and low2 (e.g.: discouraged, fatigued) emotions.
Size of the RC. When the size of the RC is large, the practitioners tend to feel low2 emotions in general. For example, as P10 mentioned, when RC additions such as new features are large, it makes them rewrite on a large scale, and also goes beyond the initial scope. This indicates that the size of the RC, impacts effort (rewriting incurs effort) and increases the scope – i.e., scope creep. Not only the project scope, but also the scope of work of the individual is impacted. For example, when the RCs are within scope, practitioners tend to feel high2 emotions (e.g.: enthusiastic). Even though we found evidence of emotional responses felt towards large-sized RCs, we could not find how practitioners feel when their RCs are small.
Definition. Precise and clear definition of an RC matters. When the RC is well-defined, practitioners tend to feel high1 emotions in general. For example, P175 mentioned that, all required details for working on the RC were well specified and that made them know what exactly they were supposed to do and that did not require them to do a second pass on the code for checking the consistency with the rest of the UI work. On the other hand, when RCs are not well-defined, practitioners tend to feel low2 emotions. Practitioners also struggle to look for information needed to work on the RC, which is connected to the challenge “access to customer”.
Access to Customer. When practitioners have regular conversations about an RC and engage with their team throughout the process, they tend to feel high1 emotions (e.g.: calm). However, some practitioners stated that when the customer is busy and there are delays in replying about the RC, does not read the emails fully, or even not taking the meetings seriously, they feel low2 emotions (e.g.: fatigued, gloomy). This is related to the relationship management of the customer that we explain in the next section.
We did not find specific reported emotional responses for RC priority and cross–functionality aspects.
From the above findings, the variations of emotions found across dimensions of RC challenging factors are summarised below.
5.3 How Stakeholders Influence the Overall Handling of the RCs (Answer to RQ3)
We found several stakeholder factors that are perceived by the practitioners as factors that influence the overall RC handling and resulting in their emotional responses. The key stakeholders found are the “practitioner”, “team”, “manager”, and “customer”. The influence of each of these stakeholders is described in each of the sub–sections below. We describe the key factors, the felt emotions, some representative examples, and the roles of the participants who reported them. We summarise the factors that lead to high and low pleasurable emotions of the practitioners, that we term “high pleasurable and low pleasurable factors”. Some factors take both high and low pleasurable dimensions – for example, learning/ knowledge acquisition arouses high pleasurable emotions when that is preferred by the practitioners. However, when it is difficult to learn/ acquire the knowledge, low pleasurable emotions may be aroused. For such cases, we present the factors as single description points.
The factors not only result in arousing the emotions of the practitioners but may also have work–related consequences. We have indicated these work–related consequences by PC<ID> for the practitioner, TC<ID> for the team, MC<ID> for the manager, and CC<ID> for the customer.
5.3.1 How Practitioners Themselves Influence the Handling of RCs (Answer to RQ3.1.)
Below, we describe the practitioner–related factors. Representative examples for these factors are given in Appendix C.
A. Learning/ knowledge acquisition of the practitioner. Some practitioners prefer acquiring new knowledge and gaining a learning experience through handling an RC. They see knowledge acquisition and learning as an antecedent that makes them feel high2 emotions (e.g.: excited, inspired), which also improves their skills (PC1), allows them to feel “smarter” (PC2), and let the practitioners meet peers’ requests if they ask for any (PC3). However, learning and knowledge acquisition is not easy for everyone. There are cases where practitioners find it difficult to learn– for example, learning a new technology, a tool or a new methodology. In such cases, the practitioners may experience low1 (e.g.: anxious) and low2 (e.g.: gloomy, fatigued, discouraged, over depressed) emotions.
B. Empowerment/ Autonomy/ Responsibility of the practitioner. The practitioners feeling empowered, having autonomy, and feeling responsible while working on RCs result in high2 (e.g.: energetic, inspired) and high1 (e.g.: satisfied, relaxed) emotions within them as they reported. According to self–determination theory, autonomy is one of the psychological needs of human beings. When they are being controlled, their autonomy is restricted, hence the psychological need is violated. Several participants reported that they are required to work overtime because of the RCs. This forced effort often leads to low1 emtions and low2 (e.g.: bored, depressed) emotions, especially in depression, as perceived by the practitioners. Not only low pleasurable emotions, but also working overtime leads to losing sleep (PC4) and time for relaxation (PC5), which are basic physiological needs as in Maslow’s hierarchy of human needs.
C. Practitioner ideating. Practitioners coming up with ideas to work on the RC, often generate high2 emotions in general in them as they reported. Even the ideas that practitioners get at times when they use ideating as an exercise for their brains, become useful when they face a similar occasion in real, in this case a similar RC.
D. Practitioner making mistakes. Practitioners themselves making minor mistakes and finding that their mistakes could have been avoided through easy fixes, make them feel both low1 in general and low2 (e.g.: over depressed) emotions.
5.3.2 How Peers in the Team Influence the Handling of RCs (Answer to RQ3.2)
Below, we describe the peer–related factors. Representative examples for these factors are given in Appendix D.
A. Having the required expertise/ competency/ relevant experience within the team. Having team members who are experts, competent, and having relevant experience in the team tend to arise high2 (e.g.: inspired) and high1 (e.g.: relaxed, satisfied, calm, at ease) emotions in practitioners when they are handling RCs. For example, our participants mentioned that peers with the necessary knowledge, make them inspired and peers having experience working with similar RCs allow the practitioners to stay calm, relaxed, satisfied, at ease when working with RCs.
B. Efficiency/ Productivity of the team. The effect of efficiency and productivity of peers is two–fold. Being efficient and productive tends to lead to high pleasurable emotions, and being inefficient and unproductive tends to lead to low pleasurable emotions of practitioners when they are working on RCs. When the team has members who are efficient and productive, this results in both high2 (e.g.: inspired, excited, energetic) and high1 (e.g.: relaxed, satisfied, calm, at ease) emotions of practitioners, as a better outcome is anticipated. At the same time, when the team is efficient and productive, the absence of a manager does not make much difference, as mentioned by P193 who is both a developer and a manager.
On the contrary, team members whose rate of working is slow, and who believe in traditional ways of executing tasks, tend to result in low efficiency and low productivity, and low1 (e.g.: angry, anxious) emotions in practitioners, as perceived by them. Also, when team members do not work as expected by practitioners, that also may lead to low1 emotions. P156 claimed that they noticed that slow working rates are sometimes apparent in practitioners who are older in age, and also such practitioners may show a resistance to adapt to current practices at work. In relation to this, some participants stated that they feel high pleasurable emotions when working with young peers. These potentially controversial statements related to team member age differences requires further research in the future, and we elaborate this in Section 7.3.
“I feel angry, anxious anytime I work with old folks who always have a slow work rate and always believes in their traditional way of performing duties I am always furious and always hope I get younger teammates” – P156
“Also because of this two young individual added to our team, I feel calm, mainly because I know all work will be done perfectly” – P156
“I have young and vibrant team members who always find new ways to sort things out whenever we deal with software and I am always energetic and excited to work with this particular set of people” – P60
C. Relationship management within the team. Good working relationships, where collaborative working and team engagement play major roles, are essential to effectively handling RCs. When team members work effectively, being accountable for what they do, and ask for and receive help from others in the team, this tends to make individual practitioners feel both high2 (e.g.: inspired, energetic) and high1 (e.g.: relaxed, satisfied, calm) emotions. Having supportive peers also result in the efficiency and productivity of the team (TC1). Better collaboration and team engagement also enable finding solutions easily (TC2), can set a practitioners’ mood to a “jolly” level (TC3), lessens the probability of feeling frustrated and pressurised (TC4), achieve the goal/ objective on time (TC5), and stay within the budget (TC6).
When a team works well, and management communicates well with the team, and most importantly when the team works collaboratively and engages well by conducting meetings to work on the RCs, the high2 (e.g.: inspired, energetic) and high1 (e.g.: relaxed, satisfied, calm) emotions of practitioners arise as reported by our participants. For example, P3 stated that them having a meeting to discuss the RC properly, and to break down the RC into tasks, prioritise them, estimate effort, and allocate the tasks within their working hours led to high pleasurable emotions in him.
D. Team members making mistakes. When peers make mistakes, but not the practitioners themselves, they may feel low1 (e.g.: angry, disgusted) emotions in general, and specifically anger and even disgust. They also believe that not only themselves, but also others in the team feel the same ways when their peers make mistakes.
5.3.3 How Managers Influence the Handling of RCs (Answer to RQ3.3.)
Below, we describe the manager–related factors. Representative examples for these factors are given in Appendix E.
A. Social awareness of the manager. Both positive and negative aspects of social awareness of the manager – having empathy or lacking it – are perceived as factors that lead to the high and low pleasurable emotions of the practitioners. For example, when a manager does not pressurise their team, but motivates the team (MC1) by being empathetic and allowing the team to handle their RCs as best suits them, practitioners tend to experience an arising of high2 emotions (e.g.: energetic), and high1 (e.g.: calm) emotions of the practitioners. On the other hand, when a manager lacks empathy e.g. when they are unable to cope with human errors of the team – even minor mistakes – and when the manager does not seem to feel how the team feels or understand the team’s emotional investments in their RCs, practitioners perceive that it leads to having both low2 in general and low1 (e.g.: angry) emotions in them.
B. Relationship management of the manager. Manager’s prompt and honest communication, better coordination, and having conversations with the team tend to make the practitioners feel both high2 (e.g.: inspired) and high1 (e.g.: satisfied, relaxed) emotions that allows them to better handle the RCs.
5.3.4 How Customers Influence the Handling of RCs (Answer to RQ3.4.)
Below, we describe the customer–related factors. Representative examples for these factors are given in Appendix F.
A. Self–regulation of the customer. A customer manifesting their emotions has an impact on the emotions of the practitioners. For example, when the customer is satisfied or excited with practitioners’ work – that is when the customer manifests both high2 (e.g.: excited) and high1 (e.g.: satisfied) emotions – the practitioners tend also to feel both high2 (e.g.: energetic, inspired) and high1 (e.g.: calm, satisfied) emotions as well. Likewise, if the customer appears to be unsatisfied or unimpressed with the delivered work – that is, when the manifested emotions of the customer are low pleasurable emotions (e.g.: unsatisfied, unimpressed) – then the practitioners tend to feel angry and low2 (e.g.: depressed) emotions. As a further consequence of this, the team may have to redo some RC work (CC2) as well.
B. Relationship management of the customer. Customer’s positive engagement with the project and the team when they are handling RCs leads to high2 and high1 (e.g.: calm, satisfied) emotions of the practitioners. For instance, having a better understanding of the RC and customer working together with the team, and giving input to the team leads to high pleasurable emotions of the practitioners. Customer’s positive engagement not only leads to high pleasure emotions of the team but also allows defining the RC, thereby resulting in a better outcome.
C. Customer’s scepticism of what they need. If practitioners perceive that their customer is not clear about what they need and request RCs repeatedly, then practitioners perceive that as an antecedent that makes them feel both low1 (e.g.: anxious) and low2 (e.g.: bored, depressed, discouraged) emotions. This also possibly leads to the team redoing their RC work (CC2) and the team not fully addressing the RC, expecting that it will change again (CC3). Furthermore, Hoda et al. [46] mentions that customer’s scepticism leads to inadequate collaboration during software development.
6 How do practitioners approach handling RCs while managing emotions? (Answer to RQ4)
Some common RC handling techniques were reported by practitioners – ranging from processes including high-level practices to low-level coding techniques – that they use and that make their RC handling more emotionally easier. We list them below for the benefit of other practitioners.
Re-estimate and change the sprint plan (from Survey Alpha). Some practitioners reported the need to periodically revisit RC change handling priorities and ordering, to help them manage negative reactions. This includes analysing the impact of the RC estimating the effort of the RC adding RC to the iteration backlog removing existing user stories according to the priority and size from the iteration backlog.
RC Prioritisation (from Survey Alpha). As mentioned by several participants, prioritisation can be done based on the changes in the market, based on team leaning, and the business need of the customer, or combinations. However, if the customer is unclear or sceptical about what they need, then it is the responsibility of the manager and the team to move forward with a discussion which resolves different RC priorities.
Discuss with the project manager whether the RC is reasonable to implement (from Survey Beta). Practitioners suggest identify the scope affected discuss with the relevant product owner quick POC implementation plan design assign work. This indicates the utilisation of continuous relationship management before making any decision on the implementation/ acceptance of the RC to help manage practitioner emotions.
First come, first served (from Survey Alpha and Beta). In some cases, participants implement RCs as they receive them. We identified this phenomenon in one of our previous studies as well [55]. This technique does not follow any prioritisation or any other best practices, but simply implementing them as received. Sometimes this strategy works well for managing emotional impact of RCs e.g.
“This is my regular demeanor while working. I try to deal with things as they come” – P52
Find your own ways to handle the RC and use them in similar situations (from Survey Beta). Sometimes the so–called standard ways of handling RCs may not be applicable to every situation. In such instances, practitioners and their teams need to find ways that suit their own situation, team members and customers and apply them. For example, P56 mentioned that having these in hand could be useful in applying at similar situations:
“I feel and have felt this way whenever we found a better way of doing things. One method might work or it might not but then suddenly, we find a way to push requests faster, anything like that and it gets me really excited and hopeful for the project. I feel like there’s other places I could apply these things to” – P56
Write pseudocode to generate solutions (from Survey Beta). Before implementing an RC, working through design changes and pseudocode was suggested as an effective technique by some participants, allowing them to gauge impact on emotions up front before fully implementing an RC.
Early implementation of a flexible structure to manage the logic flow (from Survey Beta). This technique is useful for handling cascading impacts of an RC. Participant P122 mentioned that the flexible structure they had where they used dependency injection help them to more easily implement many RCs:
“In one of my previous projects, my leader and project manager wanted to adjust a piece of the predefined logic flow, because I had already implemented a flexible structure to manage that logic flow, I just need to change the order of parameters and then everything work to fit the new requirement. Emotion: at ease. Process: Scrum. Techniques used to handle changes: program to interfaces, dependency injection” – P122
The above results demonstrate that some RC handling ways are highly organised where a step-by-step process is followed, and some are not. However, common techniques of RC handling include, but are not limited to, impact analysis, prioritisation, effort estimation, and POC implementation or writing pseudocode before implementation.
7 Discussion
7.1 Relationship between Challenges, Stakeholders, and Emotions
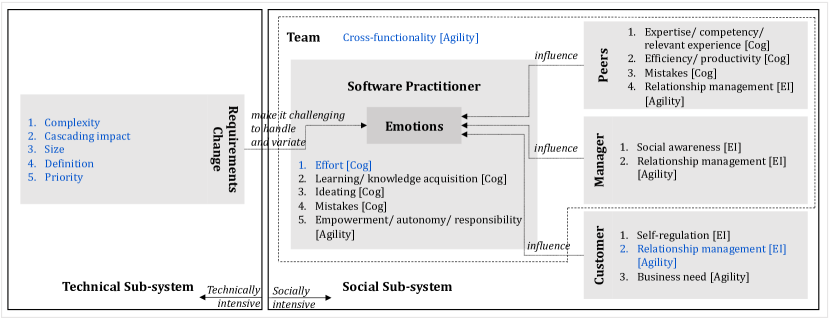
Challenge factors and stakeholder factors. Some of the challenging factors of RC handling reported and their impact on practitioner emotions – complexity, cascading impact, size, definition, and priority – are more technical aspects of handling RCs.Effort, cross–functionality, access to the customer, manager impact, and relationship management of the customer are socio-technical aspects of handling RCs. Fig. 5 summarises the key relationships between these factors that we have identified. The challenging factors are given in blue text and stakeholder factors are given in black text.
Challenging factors, stakeholders, and emotions. From our findings, it is evident that RC handling challenging factors and stakeholders factors both contribute to the triggering of emotions in practitioners. Previously [15] we found that RCs and the stakeholders act as the stimuli of triggering emotions particularly at distinct events in the project and RC handling life cycles.
Agility, emotional intelligence, and cognitive intelligence. Further analysis of our findings resulted in categorising socio-technical factors into agility, emotional intelligence, and cognitive intelligence of practitioners and stakeholders. The majority of the factors under practitioner and peers belong to cognitive intelligence areas, whereas the majority of factors under customer and manager belong to relationship management which comes under emotional intelligence. In addition, cross–functionality, which is often a characteristic of agile teams, applies to practitioners, their peers, and manager. These categorisations are indicated next to the factors in Fig. 5.
7.2 Implications for Practitioners
RC challenge assessment as a pre-development RC handling technique. Practitioners told us that there is a need to assess the challenging nature of RCs earlier – i.e., at the receiving stage. They said that this would help practitioners to better understand how challenging the RC is to handle and ease the emotional impact during the RC handling process. The key challenging factors of RCs summarised in Section 5.1 and their respective dimensions can be used to assess how challenging RCs are (as challenge assessment metrics) before developing the RC.
The interplay between agility, emotional intelligence, and cognitive intelligence. From the relationship we identified between the challenging factors, stakeholders, and emotions (Fig. 5), it is evident that for practitioners to better handle RCs while maintaining high pleasurable emotions in them (regulating low pleasurable emotions by navigating low pleasurable emotions towards high pleasurable emotions), the three aspects – agility, emotional intelligence, and cognitive intelligence should be present at a sufficient level throughout the RC handling life cycle.
Emotional Awareness throughout RC Handling. Our findings indicate that practitioners feel various emotions while handling RCs, and as a final note we would like to emphasise the importance of emotions at work. Therefore, we request organisations, managers, and practitioners to, make being aware of the emotional well–being a consistent and continuous practice. Do not wait till something happens. Tools such as Emotimonitor [56] can be used to monitor emotions at task level.
“Sometimes I feel depressed in bad working members. Many employers take an ad hoc approach to handling depression among employees. Many managers become aware of mental health issues only when they investigate why a team member is performing poorly.” – P107
Recommendations. Based on the above implications, in Table VI we provide best practices for practitioners, managers, and customers to consider following when handling RCs.
| For | Recommendation | How | ||||
| Team including managers and practitioners | Improve agility | Maintain a natural cross-functionality – do not over do it by forcing | ||||
|
||||||
| Prioritise the RC by discussing with the customer, manager, and the team | ||||||
| Improve emotional intelligence (self awareness) | ||||||
|
||||||
| Practitioner | Pre-development RC handling techniques |
|
||||
|
||||||
| Write the pseudocode and manually observe if the required output can be generated | ||||||
| Implement a POC where necessary and if that suits your situation | ||||||
| Improve emotional intelligence (self regulation) |
|
|||||
| Improve emotional intelligence (relationship management) | Collaboratively work with other team members | |||||
| Be supportive to each other | ||||||
| Improve agility | Feel empowered/ autonomous/ responsible | |||||
| Minimise forcing the effort – working overtime, as much as possible | ||||||
| Improve cognitive intelligence |
|
|||||
| Manager |
|
Feel the team and motivate them accordingly | ||||
| Improve emotional intelligence (relationship management) | Promptly and honestly communicate with the team | |||||
| Have proper coordination and conversations with the team | ||||||
| Customer |
|
Positively engage with the team | ||||
|
|
|||||
| Know the business need | If you are unsure about the RCs you request, talk with the team |
7.3 Implications for Researchers
Rational Emotive Therapy: Antecedents, beliefs, and emotional consequences. We have presented the factors that our study participants reported to heavily influence RC handling and in triggering emotions of the practitioners. These findings were derived from the opinions of the practitioners – which are what they believe but which may not be true. According to the ABC model of emotions, antecedents (factors) (A) lead to beliefs (B) that eventually result in consequences (including emotions) (C). This can take two forms: (1) antecedent rational belief rational emotions, or (2) antecedent irrational belief irrational emotions.
Applying these two forms to our findings around low pleasurable emotions, it can be said that the low pleasurable emotions may not be always due to rational beliefs the practitioners have. For example, practitioners making mistakes generating low pleasurable emotions, can be thought of as an irrational belief; where mistakes could be considered as an opportunity to learn, thus resulting in high pleasurable emotions. Questioning the rationality around the beliefs. For instance, questioning the rationality around the beliefs that result in low pleasurable emotions, could help in identifying (1) the irrational beliefs and (2) navigating the irrational belief to replace them with new beliefs that result in high pleasurable emotions. We encourage researchers to investigate this further to devise potential strategies that could replace the irrational beliefs of practitioners – i.e., how to regulate low pleasurable emotions (one of key aspects in emotional intelligence), so that preferred high pleasurable emotions are produced in them when handling RCs.
Antecedent–focused emotion regulation. While rational emotive therapy focuses on regulating the emotions by changing the beliefs, the emotions can be regulated using antecedent–focused emotion regulation (as opposed to response–focused emotion regulation). That is changing the antecedents that trigger the emotions. In simple terms, we are changing the situations early, so that emotions are regulated. For example, when the size of the RC is large (antecedent) and causes low pleasurable emotions, the RC can be broken down into manageable sizes (regulation) so that feeling low pleasurable emotions are regulated. The best practices we have given in Section 7.2 are based on antecedent–focused emotion regulation. Further research on how to regulate emotions by managing the antecedents is encouraged.
Emotions are not the only consequence of stakeholder factors. In Section 5.3, for some stakeholder factors, we identified other consequences than just emotions, though we have not found additional consequences for all the factors. We hypothesise that there could be other consequences for all factors and even additional consequences for the factors for which we found other consequences. We encourage researchers to investigate this in the future.
Age, behavior, team climate, and emotional consequences. Some of our findings indicate that participants perceived the age of the peers in the team impact the RC handling and result in the emotions of the practitioners. For example, P156 said that old peers stick to traditional ways of working, resulting in low efficiency, thus making him feel low pleasurable emotions. On the other hand, some other practitioners mentioned that working with young peers bring high pleasurable emotions in them, and they find new ways to handle the work and do the work perfectly.
A member of a team could have a variety of experiences and expertise related to work that is not only limited to RCs, but also to the other tasks carried out by the team. Therefore, it is discriminatory to form a team based on age, or consider that older peers are not suitable to have within the team but young peers are. If a particular individual is not flexible enough to change their ways of working or to gain new knowledge to adhere to the working mechanism in the team, it is the responsibility of the manager to help them to take the right measures. While Baltes et al. summarised most common employment strategies for older developers in their article [57], we have presented how behavior change models can be used in agile contexts to change the behavior of certain agile roles in a theory–based previous study of us [58]. However, we have not studied the practicality of the suggestions we have made. Therefore, we recommend the future researchers study this in the future, as we consider this as a crucial area to address for the betterment of the software teams.
Low pleasurable stakeholder factors as challenges. Even though the survey Beta participants stated how different stakeholders influence the RC handling and their emotions, it can be hypothesised that the factors that aroused low pleasurable emotions in them could be challenges to them. However, since they did not explicitly mention that they were challenges, we did not conclude them as challenges. This could be validated in the future to expand the challenge assessment metrics that we have given in this paper.
8 Threats to Validity
External Validity. The majority of the participants in survey Alpha represented Asia, while the majority of the participants in survey Beta represented North America. The emotions felt for the challenges (answer to RQ2) reported by survey Alpha participants, were reported by the survey Beta participants. This has 2 aspects. (1) survey Alpha participants may have felt different to the challenges that they experienced, (2) survey Beta participants may have faced additional/less challenges than the ones that we identified in survey Alpha. However, as it was not possible to visit survey Alpha participants back query about the emotions felt, the first point mentioned above remains as a threat to the validity of the findings of RQ2. As mentioned in Section 7.3, the low pleasurable stakeholder factors could be considered as additional challenges faced by survey Beta practitioners. However, since this was not confirmed through our study, we did not derive any conclusions. Both surveys were conducted during the Covid-19 global pandemic, where the emotional wellbeing of every global citizen was impacted. The findings around the emotions we have presented in this paper may have been different during a time without a pandemic. If the global situation changes in the future, future researchers may consider replicating this study again to compare and contrast to validate the findings we have given in this paper.
Construct Validity. In both surveys, we provided the definition of RC so that all participants share the same understanding. However, the definitions of the challenging factors in survey Alpha and the definitions for emotions in survey Beta were not given. We assumed that the participants share a common understanding of the terminology. However, this might not have been the case for every participant. Therefore, in future studies, we suggest researchers to include definitions as much as possible in the surveys.
Reliability. All data were analysed by the first author. In order to mitigate the subjectivity of the analysis, the team had weekly meetings and discussed the findings. After iteratively going through the analysis, a final meeting was held between the first and the second author to finalise the findings. Hence, the researcher bias was mitigated.
9 Conclusions
Through findings from two survey studies, this paper presents the key challenging factors that make RC handling a challenge and how practitioners feel when RCs are challenging to handle, how practitioners themselves, their peers in the team, their managers, and customers influence the overall RC handling. Some challenges are technical and some are social which also belong to aspects of agile, emotional intelligence, and cognitive intelligence. Therefore, to better handle RCs with positive emotions in socio–technical environments, agility, emotional intelligence, and cognitive intelligence need to cooperate with each other.
Acknowledgments
This work is supported by a Monash Faculty of IT scholarship. Grundy is supported by ARC Laureate Fellowship FL190100035. Also, our sincere gratitude goes to Dr William Bingley for providing invaluable feedback for this work, and all the participants who took part in this study.
References
- [1] K. R. Scherer, “Toward a dynamic theory of emotion,” Geneva Studies in Emotion, 1987.
- [2] K. Madampe, R. Hoda, and J. Grundy, “A Faceted Taxonomy of Requirements Changes in Agile Contexts,” IEEE Transactions on Software Engineering, 2021.
- [3] R. Colomo-Palacios, A. Hernández-López, . García-Crespo, and P. Soto-Acosta, “A study of emotions in requirements engineering,” in Communications in Computer and Information Science, 2010.
- [4] D. Graziotin, X. Wang, and P. Abrahamsson, “Do feelings matter? On the correlation of affects and the self-assessed productivity in software engineering,” Journal of Software: Evolution and Process, 2015.
- [5] A. Kolakowska, A. Landowska, M. Szwoch, W. Szwoch, and M. R. Wrobel, “Emotion recognition and its application in software engineering,” in 2013 6th International Conference on Human System Interactions, HSI 2013, 2013.
- [6] D. Girardi, F. Lanubile, N. Novielli, and A. Serebrenik, “Emotions and Perceived Productivity of Software Developers at the Workplace,” IEEE Transactions on Software Engineering, pp. 1–1, 6 2021.
- [7] S. C. Müller and T. Fritz, “Stuck and frustrated or in flow and happy: Sensing developers’ emotions and progress,” in Proceedings - International Conference on Software Engineering, 2015.
- [8] M. R. Wrobel, “Towards the participant observation of emotions in software development teams,” in Proceedings of the 2016 Federated Conference on Computer Science and Information Systems, FedCSIS 2016, 2016.
- [9] M. R. Wrobel, “Emotions in the software development process,” in 2013 6th International Conference on Human System Interactions, HSI 2013, 2013.
- [10] B. Crawford, R. Soto, C. L. de la Barra, K. Crawford, and E. Olguín, “The Influence of Emotions on Productivity in Software Engineering,” in Communications in Computer and Information Science, 2014.
- [11] D. Graziotin, X. Wang, and P. Abrahamsson, “Happy software developers solve problems better: Psychological measurements in empirical software engineering,” PeerJ, 2014.
- [12] D. Graziotin, X. Wang, and P. Abrahamsson, “Software developers, moods, emotions, and performance,” IEEE Software, 2014.
- [13] P. Ralph, S. Baltes, G. Adisaputri, R. Torkar, V. Kovalenko, M. Kalinowski, N. Novielli, S. Yoo, X. Devroey, X. Tan, M. Zhou, B. Turhan, R. Hoda, H. Hata, G. Robles, A. Milani Fard, and R. Alkadhi, “Pandemic programming,” Empirical Software Engineering, vol. 25, no. 6, pp. 4927–4961, 2020.
- [14] K. Madampe, R. Hoda, and P. Singh, “Towards Understanding Emotional Response to Requirements Changes in Agile Teams,” in IEEE/ACM 42nd International Conference on Software Engineering New Ideas and Emerging Results (ICSE-NIER’20), (Seoul, Republic of Korea), p. 4, ACM, New York, NY, USA, 2020.
- [15] K. Madampe, R. Hoda, and J. Grundy, “The Emotional Roller Coaster of Responding to Requirements Changes in Software Engineering,” IEEE Transactions on Software Engineering, p. 1, 2022.
- [16] A. Strauss and J. Corbin, Basics of qualitative research techniques. 1998.
- [17] P. T. Van Katwyk, S. Fox, P. E. Spector, and E. K. Kelloway, “Using the Job-Related Affective Well-Being Scale (JAWS) to investigate affective responses to work stressors.,” Journal of occupational health psychology, vol. 5, no. 2, pp. 219–230, 2000.
- [18] R. Hoda, “Socio-Technical Grounded Theory for Software Engineering,” IEEE Transactions on Software Engineering, pp. 1–1, 8 2021.
- [19] K. Curcio, T. Navarro, A. Malucelli, and S. Reinehr, “Requirements engineering: A systematic mapping study in agile software development,” Journal of Systems and Software, vol. 139, pp. 32–50, 5 2018.
- [20] V. T. Heikkila, D. Damian, C. Lassenius, and M. Paasivaara, “A Mapping Study on Requirements Engineering in Agile Software Development,” in 41st Euromicro Conference on Software Engineering and Advanced Applications (SEAA 2015), pp. 199–207, Institute of Electrical and Electronics Engineers Inc., 10 2015.
- [21] E. M. Schön, J. Thomaschewski, and M. J. Escalona, “Agile Requirements Engineering: A systematic literature review,” Computer Standards and Interfaces, vol. 49, pp. 79–91, 1 2017.
- [22] I. Inayat, S. S. Salim, S. Marczak, M. Daneva, and S. Shamshirband, “A systematic literature review on agile requirements engineering practices and challenges,” Computers in Human Behavior, vol. 51, pp. 915–929, 10 2015.
- [23] M. Kuutila, M. V. Mäntylä, M. Claes, M. Elovainio, and B. Adams, “Using experience sampling to link software repositories with emotions and work well-being,” in International Symposium on Empirical Software Engineering and Measurement, 2018.
- [24] N. Novielli, F. Calefato, and F. Lanubile, “Towards discovering the role of emotions in stack overflow,” in 6th International Workshop on Social Software Engineering, SSE 2014 - Proceedings, 2014.
- [25] D. Pletea, B. Vasilescu, and A. Serebrenik, “Security and emotion: Sentiment analysis of security discussions on GitHub,” in 11th Working Conference on Mining Software Repositories, MSR 2014 - Proceedings, 2014.
- [26] R. Colomo-Palacios, T. Samuelsen, and C. Casado-Lumbreras, “Emotions in software practice: Presentation vs. coding,” in Proceedings - 2019 IEEE/ACM 4th International Workshop on Emotion Awareness in Software Engineering, SEmotion 2019, pp. 23–28, Institute of Electrical and Electronics Engineers Inc., 5 2019.
- [27] A. Fountaine and B. Sharif, “Emotional awareness in software development: Theory and measurement,” in Proceedings - 2017 IEEE/ACM 2nd International Workshop on Emotion Awareness in Software Engineering, SEmotion 2017, pp. 28–31, Institute of Electrical and Electronics Engineers Inc., 6 2017.
- [28] A. Murgia, M. Ortu, P. Tourani, B. Adams, and S. Demeyer, “An exploratory qualitative and quantitative analysis of emotions in issue report comments of open source systems,” Empirical Software Engineering, 2018.
- [29] G. Yang, S. Baek, J. W. Lee, and B. Lee, “Analyzing emotion words to predict severity of software bugs: A case study of open source projects,” in Proceedings of the ACM Symposium on Applied Computing, vol. Part F128005, 2017.
- [30] A. Murgia, P. Tourani, B. Adams, and M. Ortu, “Do developers feel emotions? An exploratory analysis of emotions in software artifacts,” in 11th Working Conference on Mining Software Repositories, MSR 2014 - Proceedings, 2014.
- [31] N. Novielli, F. Calefato, and F. Lanubile, “A gold standard for emotion annotation in stack overflow,” in Proceedings - International Conference on Software Engineering, 2018.
- [32] K. Neupane, K. Cheung, and Y. Wang, “EmoD: An End-to-End Approach for Investigating Emotion Dynamics in Software Development,” in Proceedings - 2019 IEEE International Conference on Software Maintenance and Evolution, ICSME 2019, pp. 252–256, Institute of Electrical and Electronics Engineers Inc., 9 2019.
- [33] K. Werder and S. Brinkkemper, “MEME: Toward a method for emotions extraction from github,” in Proceedings - International Conference on Software Engineering, 2018.
- [34] E. Guzman and B. Bruegge, “Towards emotional awareness in software development teams,” in 2013 9th Joint Meeting of the European Software Engineering Conference and the ACM SIGSOFT Symposium on the Foundations of Software Engineering, ESEC/FSE 2013 - Proceedings, 2013.
- [35] D. Girardi, F. Lanubile, N. Novielli, and D. Fucci, “Sensing Developers’ Emotions: The Design of a Replicated Experiment,” in IEEE/ACM 3rd International Workshop on Emotion Awareness in Software Engineering (SEmotion), 2018.
- [36] R. Colomo-Palacios, C. Casado-Lumbreras, P. Soto-Acosta, and . García-Crespo, “Using the affect grid to measure emotions in software requirements engineering,” Journal of Universal Computer Science, vol. 17, no. 9, pp. 1281–1298, 2011.
- [37] G. R. VandenBos, APA Dictionary of Psychology. American Psychological Association, 2007.
- [38] P. Koval, E. A. Butler, T. Hollenstein, D. Lanteigne, and P. Kuppens, “Emotion regulation and the temporal dynamics of emotions: Effects of cognitive reappraisal and expressive suppression on emotional inertia,” Cognition and Emotion, vol. 29, pp. 831–851, 7 2015.
- [39] J. J. Gross and R. Thompson, “Emotion regulation: Conceptual foundations. In J.J. Gross (Ed.), Handbook of emotion regulation. New York: Guilford Press.,” in Handbook of Emotion Regulation, vol. 3, 2007.
- [40] S. Koole, “The psychology of emotion regulation: An integrative review,” 2009.
- [41] B. A. Kitchenham and S. L. Pfleeger, “Personal opinion surveys,” in Guide to Advanced Empirical Software Engineering, pp. 63–92, Springer London, 2008.
- [42] B. A. Kitchenham, S. L. Pfleeger, L. M. Pickard, P. W. Jones, D. C. Hoaglin, K. El Emam, and J. Rosenberg, “Preliminary guidelines for empirical research in software engineering,” IEEE Transactions on Software Engineering, vol. 28, no. 8, pp. 721–734, 2002.
- [43] T. Punter, M. Ciolkowski, B. Freimut, and I. John, “Conducting on-line surveys in software engineering,” in Proceedings - 2003 International Symposium on Empirical Software Engineering, ISESE 2003, pp. 80–88, Institute of Electrical and Electronics Engineers Inc., 2003.
- [44] B. W. Boehm, “Software Engineering Economics,” in Pioneers and Their Contributions to Software Engineering: sd&m Conference on Software Pioneers, Bonn, June 28/29, 2001, Original Historic Contributions (M. Broy and E. Denert, eds.), pp. 99–150, Berlin, Heidelberg: Springer Berlin Heidelberg, 2001.
- [45] S. Anwer, L. Wen, and Z. Wang, “A systematic approach for identifying requirement change management challenges: Preliminary results,” in EASE ’19: Proceedings of the Evaluation and Assessment on Software Engineering, (New York, NY, USA), pp. 230–235, Association for Computing Machinery, 4 2019.
- [46] R. Hoda, J. Noble, and S. Marshall, “The impact of inadequate customer collaboration on self-organizing Agile teams,” in Information and Software Technology, vol. 53, pp. 521–534, Elsevier, 5 2011.
- [47] M. K. Curumsing, Emotion-oriented requirements engineering. PhD thesis, 2017.
- [48] D. Watson, L. A. Clark, and A. Tellegen, “Development and validation of brief measures of positive and negative affect: The PANAS scales.,” Journal of Personality and Social Psychology, vol. 54, no. 6, 1988.
- [49] E. Diener, D. Wirtz, W. Tov, C. Kim-Prieto, D. w. Choi, S. Oishi, and R. Biswas-Diener, “New well-being measures: Short scales to assess flourishing and positive and negative feelings,” Social Indicators Research, vol. 97, no. 2, 2010.
- [50] C. D. Fisher, “Emotions at work: What do people feel and how should we measure it? Part of the Human Resources Management Commons,” tech. rep., 1997.
- [51] University of York. NHS Centre for Reviews & Dissemination, Systematic Reviews: CRD’s guidance for undertaking reviews in health care. CRD, University of York, 2009.
- [52] “Job-related Affective Well-being Scale JAWS - Paul Spector.”
- [53] SlashData Ltd., “The Global Developer Population Report 2019,” tech. rep., 2019.
- [54] “14th State of Agile Report — State of Agile,” tech. rep., https://stateofagile.com/, 2020.
- [55] K. Madampe, R. Hoda, J. Grundy, and P. Singh, “Towards Understanding Technical Responses to Requirements Changes in Agile Teams,” in IEEE/ACM 42nd International Conference on Software Engineering Workshops (ICSEW’20), (Seoul, Republic of Korea), p. 4, ACM, New York, NY, USA, 2020.
- [56] M.-A. A. El-Migid, D. Cai, T. Niven, J. Vo, K. Madampe, J. Grundy, and R. Hoda, “Emotimonitor: A Trello power-up to capture and monitor emotions of Agile teams,” Journal of Systems and Software, vol. 186, p. 111206, 4 2022.
- [57] S. Baltes, G. Park, and A. Serebrenik, “Is 40 the New 60? How Popular Media Portrays the Employability of Older Software Developers,” IEEE Software, vol. 37, no. 6, 2020.
- [58] K. Madampe, R. Hoda, and J. Grundy, “Towards Better Understanding of Agile Teams through Behavior Change Models,” in he 35th IEEE/ACM International Conference on Automated Software Engineering - Human-Centric Software Engineering and Cyber Security Workshop, (Melbourne), 2020.
Appendix A Project Information
| Survey Alpha | |||||
| Project Domain | # of Participants | Project Category | # of Participants | Agile Method Used | # of Participants |
| IT | 23 | New Development | 22 | Scrum | 28 |
| Other | 17 | Software as a Service | 9 | Other | 12 |
| Other | 9 | ||||
| Team Size | # of People | Iteration Length | # of Weeks | ||
| Minimum | 3 | Minimum | 2 | ||
| Maximum | 80 | Maximum | 10 | ||
| Mean | 14.36 | Mean | 3.28 | ||
| Standard Deviation | 15.54 | Standard Deviation | 2.25 | ||
| Practices Followed (Order of the Bars in Each Graph Below: Never Sometimes About half the time Most of the Time Always) | |||||
| Collective Estimation | Product Backlog | Scrum/Kanban Board | |||
| Customer Demos | Short iterations/Sprints | Self–assignment | |||
| Daily Standup/Team Meeting | Release Planning | Sprint Backlog | |||
| Definition of Done | Retrospectives | User Stories | |||
| Iteration Planning | Review Meetings | Pair Programming | |||
| Survey Beta | |||||
| Project Domain | # of Participants | Project Category | # of Participants | Development Method Used | # of Participants |
| IT | 122 | New development | 115 | Scrum | 57 |
| Finance & Banking | 30 | Software as a Service | 47 | Dynamic System Development | 44 |
| Manufacturing | 10 | Maintenance | 22 | Feature Driven Development | 25 |
| Transport | 10 | Migration | 17 | Waterfall | 17 |
| Telecom | 7 | Kanban | 14 | ||
| Other | 16 | Crystal | 11 | ||
| Team Size | # of People | Iteration Length | # of Weeks | None | 8 |
| Minimum | 1 | Minimum | 1 | Other | 11 |
| Maximum | 100 | Maximum | 10 | ||
| Mean | 18.61 | Mean | 5.67 | ||
| Standard Deviation | 18.8 | Standard Deviation | 2.11 | ||
| Practices Followed (Order of the Bars in Each Graph Below: Never Sometimes About half the time Most of the time Always) | |||||
| Collective Estimation | Product Backlog | Scrum/Kanban Board | |||
| Customer Demos | Short Iterations/Sprints | Self-assignment | |||
| Daily Standup/team meeting | Release Planning | Sprint Backlog | |||
| Definition of Done | Retrospectives | User Stories | |||
| Iteration Planning | Review Meetings | Use Cases | |||
| Pair Programming | |||||
Appendix B Challenges and Emotions Felt – Examples
| Challenge | Dimension | Emotions | Examples | Roles (<Participants>) | ||||||||||||||||||
| Complexity | High |
|
|
Dev (P82, P128, P188) | ||||||||||||||||||
| Low |
|
|
|
|||||||||||||||||||
| Cascading impact | High |
|
|
Dev (P128, P138, P151, P188) | ||||||||||||||||||
| Low |
|
|
|
|||||||||||||||||||
| Size | Large | Low2 in gen. |
|
Dev (P10) | ||||||||||||||||||
| Definition | Precise/ clear | High1 in gen. |
|
|
||||||||||||||||||
| Imprecise/ unclear | Low2 in gen. |
|
Dev (P104) | |||||||||||||||||||
| Access to customer | Easy/ regular | Calm |
|
|
||||||||||||||||||
| Difficult/ irregular |
|
|
|
|||||||||||||||||||
| Effort required | High | Low2 in gen. |
|
|
Appendix C Practitioner–related Factors – Examples
| \faBrainFactor | Emotions | Examples | Roles (<Participants>) | ||||||||||||||||||||||
|
|
|
|
||||||||||||||||||||||
|
|
|
|
||||||||||||||||||||||
| [+C] Practitioner ideating | High2 in gen. |
|
|
||||||||||||||||||||||
|
|
|
|
||||||||||||||||||||||
|
|
|
|
||||||||||||||||||||||
| [-D] Making mistakes |
|
|
|
Appendix D Peer–related Factors – Examples
| \faUsersFactor | Emotions | Examples | Roles (<Participants>) | |||||||||||||||||||||||||||||
|
|
|
|
|||||||||||||||||||||||||||||
| [+B] High efficiency/ productivity of peers |
|
|
|
|||||||||||||||||||||||||||||
|
|
|
|
|||||||||||||||||||||||||||||
| [-B] Low efficiency/ low productivity of the team |
|
|
|
|||||||||||||||||||||||||||||
| [-D] Team members making mistakes |
|
|
|
Appendix E Manager–related Factors – Examples
| \faUserSecretFactor | Emotions | Examples | Roles (<Participants>) | ||||||||||||||
| [+A] Manager having empathy (social awareness) |
|
|
|
||||||||||||||
|
|
|
|
||||||||||||||
| [-A] Manager lacking empathy (social awareness) |
|
|
|
Appendix F Customer–related Factors – Examples
| \faPeopleArrowsFactor | Emotions | Examples | Roles (<Participants>) | |||||||||||||||||
|
|
|
|
|||||||||||||||||
|
|
|
|
|||||||||||||||||
|
|
|
|
|||||||||||||||||
| [-C] Customer being sceptical [CC2, CC3] |
|
|
|