TASEH Collaboration
First Results from the Taiwan Axion Search Experiment with Haloscope at 19.6
Abstract
This Letter reports on the first results from the Taiwan Axion Search Experiment with Haloscope, a search for axions using a microwave cavity at frequencies between 4.70750 and 4.79815 GHz. Apart from the non-axion signals, no candidates with a significance more than 3.355 were found. The experiment excludes models with the axion-two-photon coupling , a factor of eleven above the benchmark KSVZ model, reaching a sensitivity three orders of magnitude better than any existing limits in the mass range . It is also the first time that a haloscope-type experiment places constraints on in this mass region.
Various astrophysical and cosmological observations indicate that dark matter (DM) exists and makes up 26.4% of the total energy density of the universe [1, 2, 3, 4, 5]. One of the viable dark matter candidates is the axion, which arises from the spontaneous breaking of a new global U(1)PQ symmetry [6] introduced by Peccei and Quinn to solve the strong CP problem [6, 7, 8]. Axions are abundantly produced during the QCD phase transition in the early universe and may constitute the DM [9, 10, 11, 12]. In the post-inflationary PQ symmetry breaking scenario, current calculations suggest a mass range of for axions so that the cosmic axion density does not exceed the observed cold DM density [13, 14, 15, 16, 17, 18, 19, 20, 21, 22, 23, 24, 25].
Axions could be detected and studied via their two-photon interaction, of which the strength is described by the coupling constant . The detectors with the best sensitivities to axion DMs with a mass of , as first proposed by Sikivie [26, 27], are haloscopes consisting of a microwave (MW) cavity immersed in a strong static magnetic field and operated at a cryogenic temperature. In the presence of an external magnetic field, the ambient oscillating axion field drives the cavity and they resonate when the frequencies of the electromagnetic modes in the cavity match the MW frequency , where is set by the total energy of the axion: . The axion signal power is further delivered to the readout probe followed by a low-noise linear amplifier.
Several haloscope experiments have actively carried out axion searches. The most significant efforts are from the Axion Dark Matter eXperiment (ADMX), placing tight constraints on within the mass range of 1.9–4.2 [28, 29, 30, 31, 32, 33, 34]. Others include the Haloscope at Yale Sensitive to Axion Cold dark matter (HAYSTAC) [35, 36, 37], the Center for Axion and Precision Physics Research (CAPP) [38, 39, 40], and the QUest for AXions- (QUAX-) [41]. This Letter presents the first results of a search for axions in the mass range of 19.4687–19.8436, from the Taiwan Axion Search Experiment with Haloscope (TASEH).
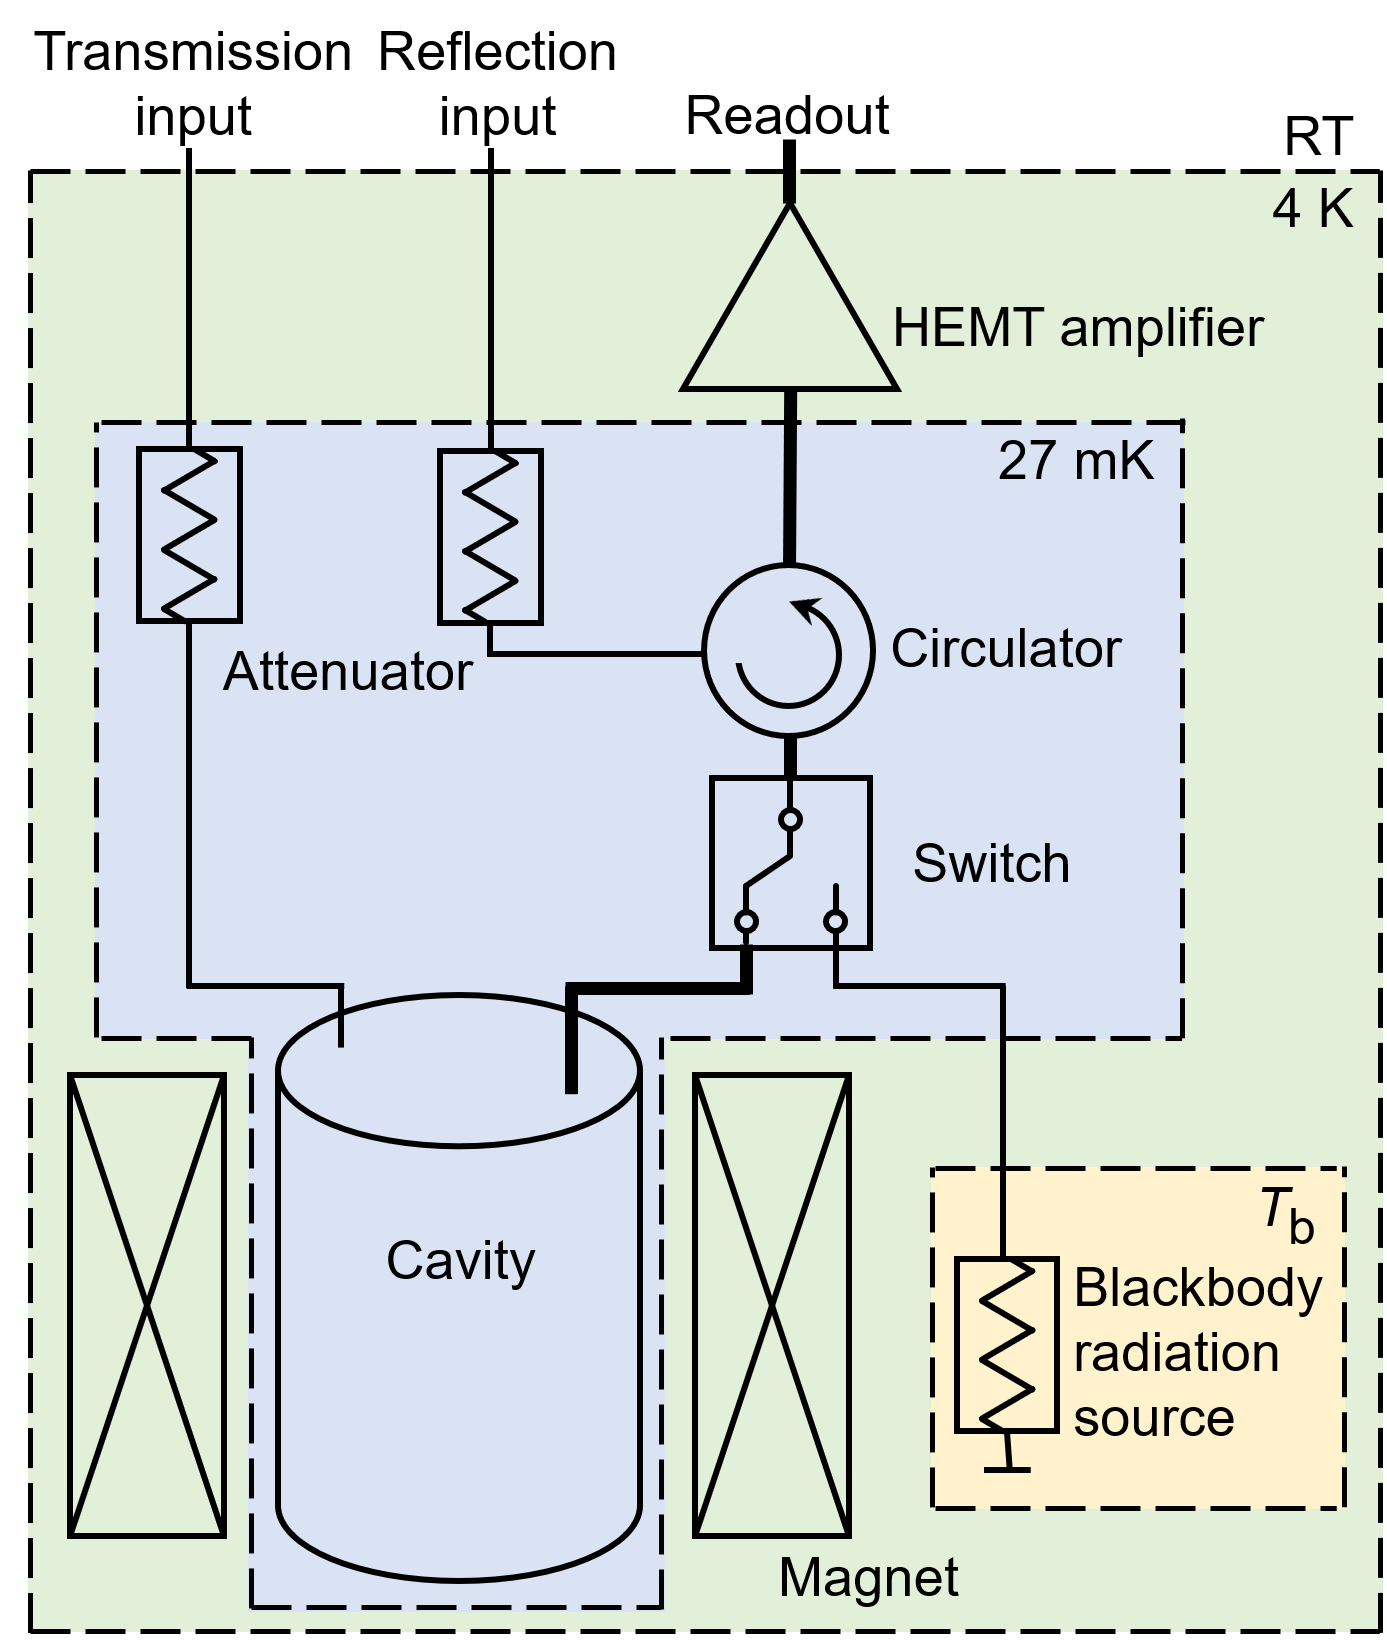
The detector of TASEH is located at the Department of Physics, National Central University, Taiwan and housed within a cryogen-free dilution refrigerator (DR) from BlueFors. Figure 1 shows a simplified diagram of the TASEH apparatus. An 8-Tesla superconducting solenoid with a bore diameter of 76 mm and a length of 240 mm is integrated with the DR. The DR has multiple flanges at different temperatures for the required cooling: 50 K, 4 K, still, and mixing flanges, among which the mixing flange could reach the lowest temperature at mK. During the data taking, the MW cavity with two coupling probes sits in the center of the magnet bore and is connected via holders to the mixing flange. The -L cylindrical cavity, made of oxygen-free high-conductivity (OFHC) copper, has an inner radius of 2.5 cm and a height of 12 cm and is split into two halves along the axial direction to reduce the loss from the seam [42]. The resonant frequency can be tuned via the rotation of an off-axis OFHC copper tuning rod. The axion-photon conversion signal from the readout probe is directed to an impedance-matched amplification chain (thick lines in Fig. 1). The first-stage amplifier is a low noise high-electron-mobility-transistor (HEMT) amplifier mounted on the 4 K flange. A circulator, anchored at the mixing flange, prevents thermal radiation from the HEMT amplifier back streaming to the cold cavity and then being reflected. The signal is further amplified at room temperature via a three-stage post-amplifier, and down-converted to in-phase (I) and quadrature (Q) components and digitized by an analog-to-digital converter with a sampling rate of 2 MHz. Two heavily attenuated input lines support scattering parameter measurements of the cavity and transmit test signals. More details of the TASEH detector can be found in Ref. [43].
The signal power extracted from a MW cavity on resonance is given by [44, 35]:
| (1) |
The first set of parentheses contains , , physical constants, and the local dark-matter density [[][.Both$0.45\text{GeV}/\mathrm{cm}^3$(usedbyADMX, HAYSTAC, CAPP, andQUAX-$aγ$)and$0.3\text{GeV}/\mathrm{cm}^3$(morecommonlycitedbytheotherdirectDMsearchexperiments)areconsistentwiththerecentmeasurements.]Read:2014qva, 5]. For the QCD axions, is related to the axion mass :
| (2) |
where is a dimensionless model-dependent parameter, with numerical values -0.97 and 0.36 in the Kim-Shifman-Vainshtein-Zakharov (KSVZ) [46, 47] and the Dine-Fischler-Srednicki-Zhitnitsky (DFSZ) [48, 49] benchmark models, respectively. The symbol is the fine-structure constant and is a scale parameter that can be derived from the mass and the decay constant of the pion and the ratio of the up to down quark masses. The second set of parentheses contains parameters related to the experimental setup: the angular resonant frequency of the cavity , the vacuum permeability , the nominal strength of the external magnetic field , the effective volume of the cavity , and the loaded quality factor of the cavity , where is the unloaded, intrinsic quality factor and is the coupling coefficient which determines the amount of coupling of the signal to the receiver. The form factor is the normalized overlap of the electric field , for a particular cavity resonant mode, with the external magnetic field :
| (3) |
The magnetic field in TASEH points mostly along the axial direction of the cavity. For cylindrical cavities, the largest form factor is from the TM010 mode. The expected signal power derived from the experimental parameters of TASEH is W for a KSVZ axion with a mass of 19.6.
In the haloscope experiments, the figure of merit that determines the design of the experimental setup is the signal-to-noise ratio (SNR), i.e. the ratio of the signal power to the fluctuation in the averaged noise power spectrum [50], given by:
| (4) |
where is the system noise temperature, an effective temperature associated with the total noise of the system, is the data integration time, and is the resolution bandwidth. Here, one assumes that all the axion signal power falls within .
The system noise temperature has three major components:
| (5) |
where is the angular frequency. The last term is the effective temperature of the noise added by the receiver (mainly from the first-stage amplifier). The sum of the first two terms is equivalent to the sum of the reflection of the incoming noise from the attenuator anchored to the mixing flange (Fig. 1) and the transmission of the noise from the cavity body itself. The symbol refers to the effective temperature due to the blackbody radiation at a physical temperature and the vacuum fluctuation. The difference of the effective temperatures is modulated by a Lorentzian function . If the physical temperatures of the cavity and of the mixing flange are identical, the thermal noise spectrum from the cavity is flat. The derivation of the first two terms in Eq. (5) can be found in Ref. [51].
The calibration for the amplification chain is performed by connecting the HEMT to a blackbody radiation source (Fig. 1) instead of the cavity via a cryogenic switch. Various values of input currents are sent to a nearby resistor heater to change its temperature monitored by a thermometer. The output power is fitted to a first-order polynomial, as a function of the source temperature, to extract the overall gain and added noise .
The data for the analysis presented here were collected by TASEH from October 13, 2021 to November 15, 2021, and are termed as the CD102 data, where CD stands for “cool down”. The CD102 data cover the frequency range of 4.70750–4.79815 GHz. In this Letter, most of the frequencies in unit of GHz are quoted with five decimal places as the absolute accuracy of frequency is kHz. It shall be noted that the frequency resolution is 1 kHz. During the CD102 data run, the temperature of the cavity stayed at mK, higher with respect to the mixing flange mK; it is believed that the cavity had an unexpected thermal contact with the radiation shield in the DR. As a result, and are 0.18 K and 0.11 K, respectively. The form factor for the TM010 mode varies from 0.60 to 0.61 over the operational frequency range. The intrinsic quality factor at the cryogenic temperature is . The insertion depth of the readout probe is set for since this value, for a given amount of time and a fixed value of SNR, maximizes the frequency coverage. In this case, the cavity line width, , is about 240 kHz.
The calibration was carried out before, during, and after the data taking, which showed that the performance of the system was stable over time. The added noise obtained from the calibration is about K, with a frequency dependence. In CD102, there were 837 resonant-frequency steps in total, with a frequency difference of kHz between the steps. The value of was kept within 10% of 105 kHz ( half of the cavity line width) rather than a fixed value, such that the rotation angle of the tuning rod did not need to be fine-tuned and the operation time could be minimized. A 10% variation of is found to have no impact on the limits. Each resonant-frequency step is denoted as a “scan” and the data integration time was about 32-42 minutes. The variation of the integration time was introduced to compensate the frequency dependence of the added noise.
The analysis of the CD102 data follows the procedure similar to that developed by the HAYSTAC experiment [52] and the details are described in Ref. [51]. The fast Fourier transform algorithm is performed on the IQ time series data to obtain the frequency-domain power spectrum. The Savitzky-Golay (SG) filter [53] is applied to model the Lorentzian structure of the background caused by the temperature difference between the cavity and the mixing flange [Eq. (5)] and to obtain the average noise power. Deviations from the average noise power are compared with the uncertainty on the averaged power spectrum, which defines the observed SNR. All the spectra from different frequency scans, particularly for the frequency bins that appear in multiple spectra, are combined with a weighting algorithm. In order to maximize the SNR, a running window of five consecutive bins in the combined spectrum is applied and the five bins within each window are merged to construct a final spectrum. The five frequency bins correspond to the 5-kHz axion signal line width, assuming a standard Maxwellian axion line shape with a velocity variance (270 km/s)2 [52]. This line shape is also used when defining the maximum likelihood weights for merging.
After the merging, 22 candidates with an SNR greater than 3.355 were found and a rescan was performed to check if they were real signals or statistical fluctuations. Among them, 20 candidates were from the fluctuations because they were gone after a few rescans. The remaining two candidates, in the frequency ranges of 4.71017 – 4.71019 GHz and 4.74730 – 4.74738 GHz, are not considered axion signal candidates for the following reasons. The signal in the second frequency range was detected via a portable antenna outside the DR and found to come from the instrument control computer in the laboratory, while the signal in the first frequency range was not detected outside the DR but still present after turning off the external magnetic field. No limits are placed for the above two frequency ranges.
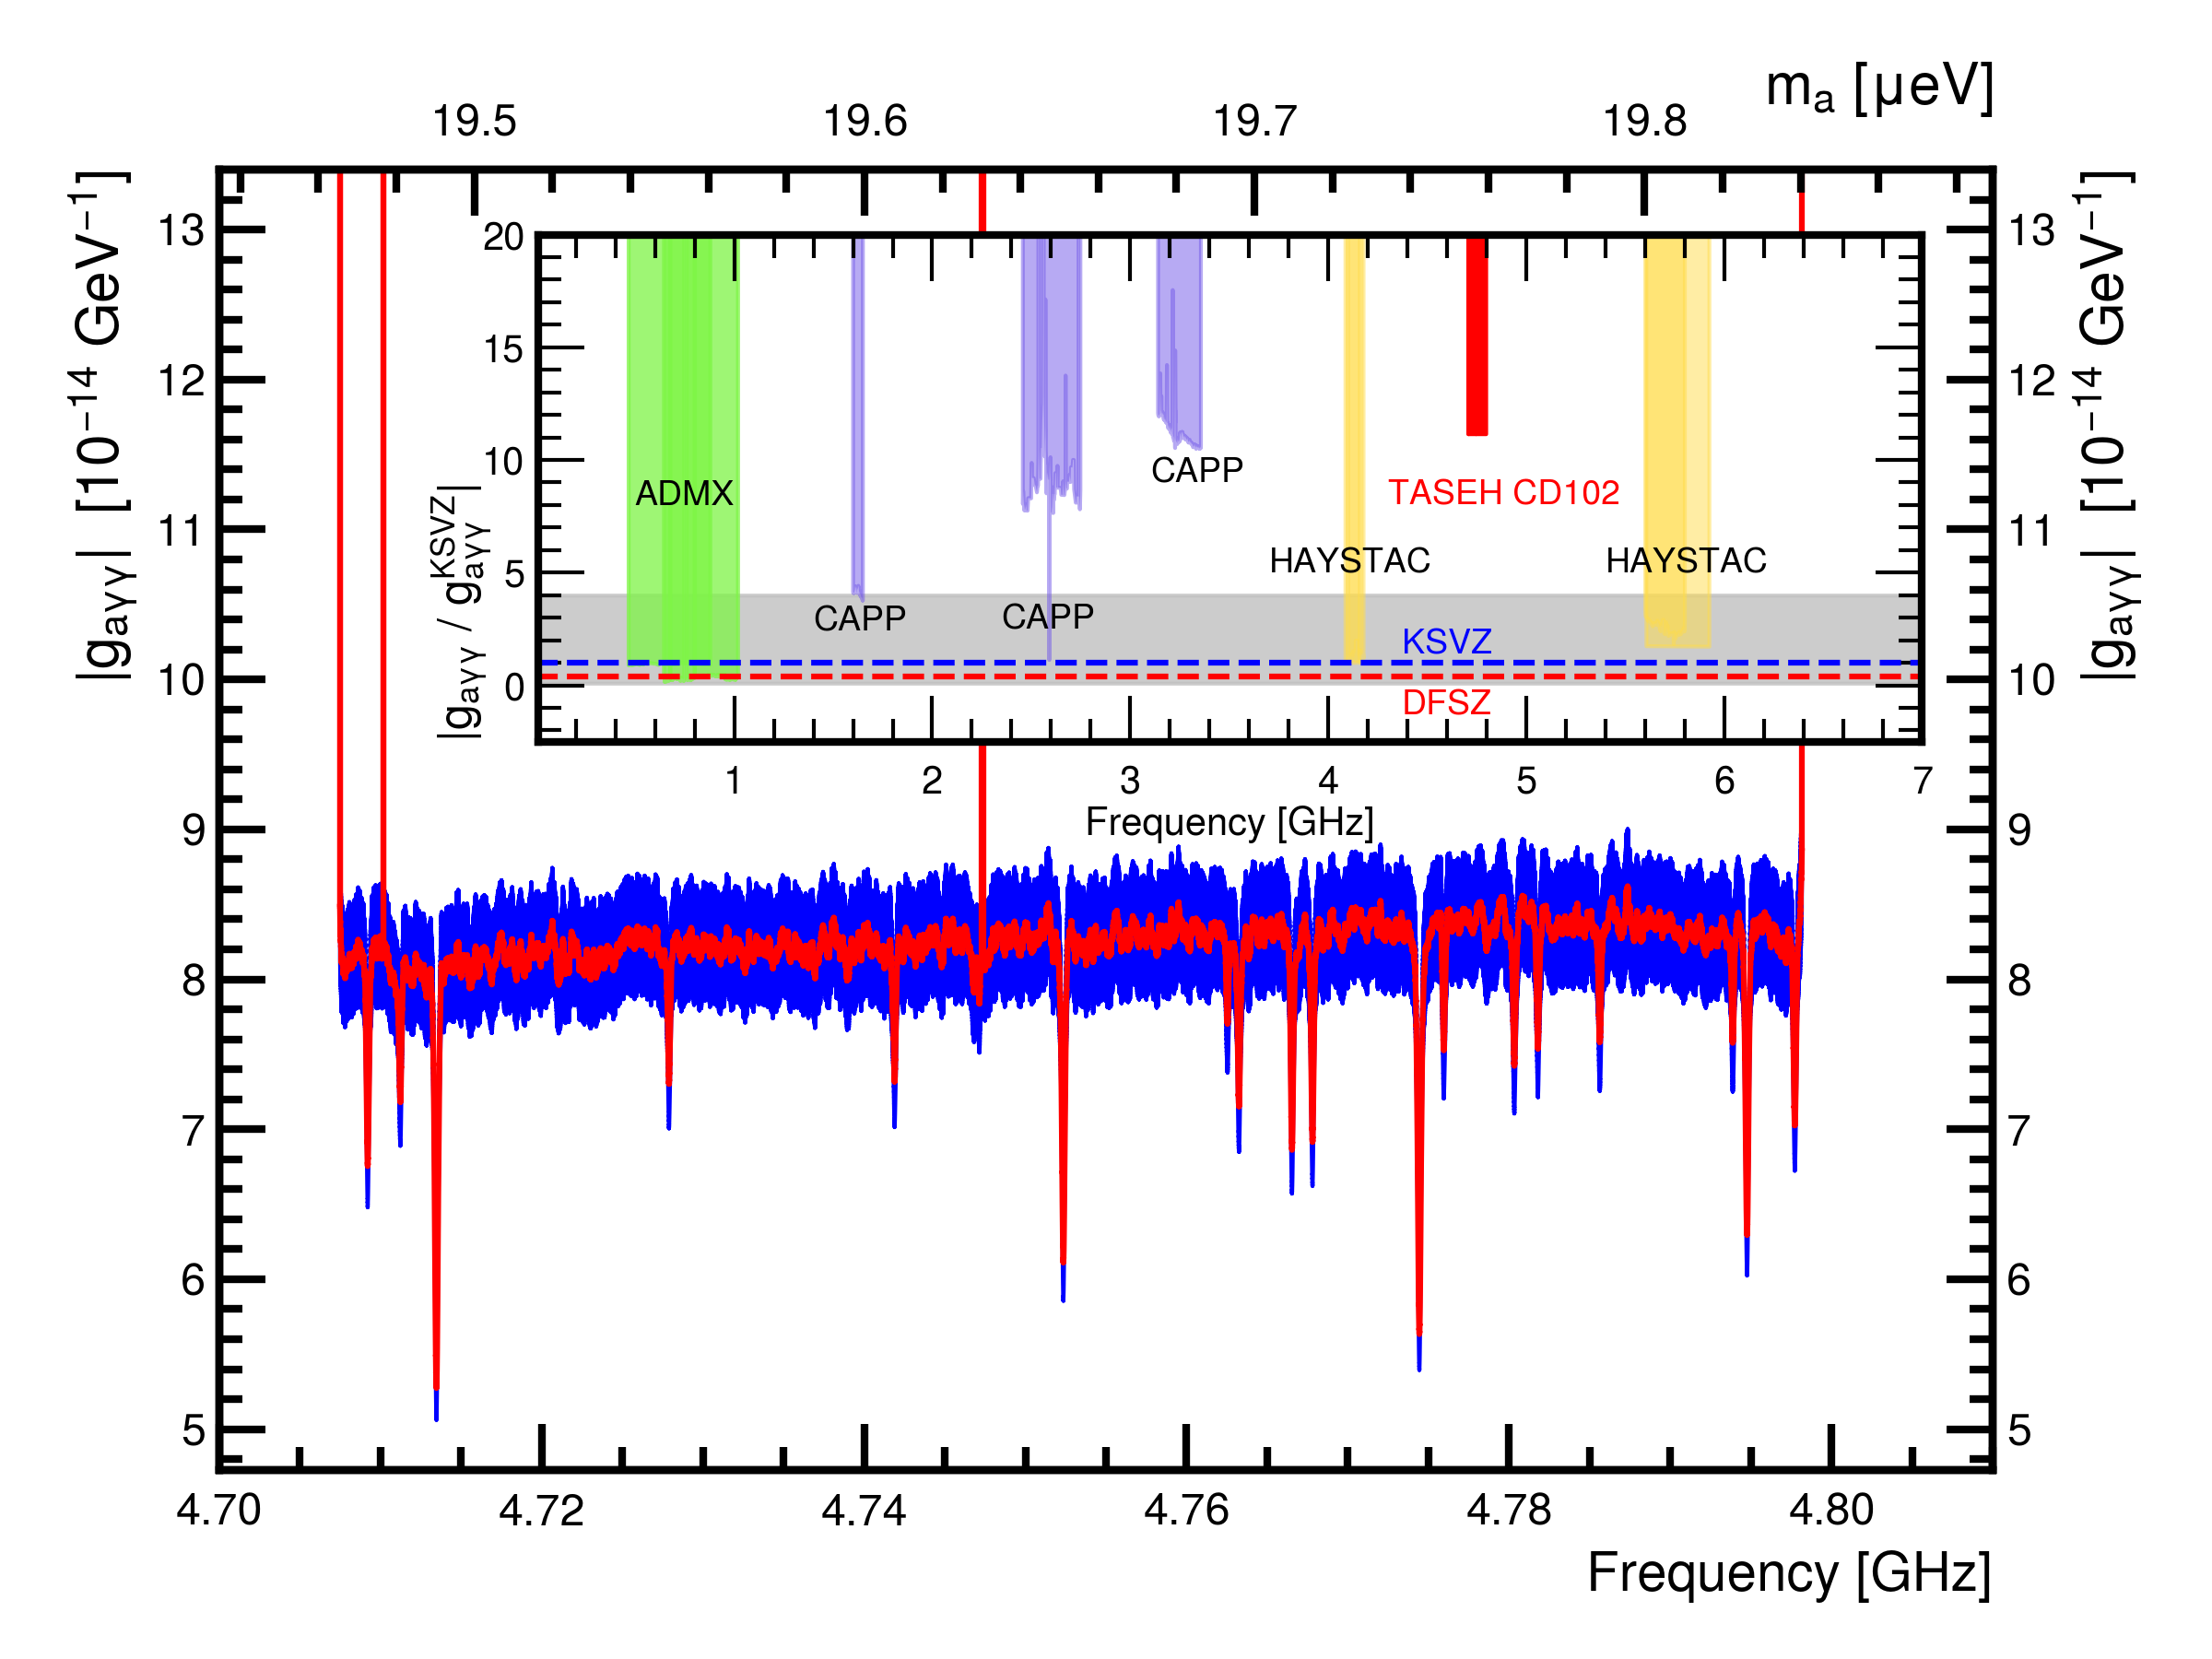
Since no candidates were found after the rescan, the upper limits at 95% confidence level (C.L.) on are derived by setting the maximum SNR equal to five, with the assumption that axions make up 100% of the local dark matter density. Figure 2 shows the limits of TASEH and the ratios relative to the KSVZ benchmark value, together with those from the previous searches. The limits on range from to , with an average value of ; the lowest value comes from the frequency bins with additional eight times more data from the rescans, while the highest value comes from the frequency bins near the boundaries of the spectrum. Overall the total relative systematic uncertainty is , coming from the uncertainties on the loaded quality factor , the coupling coefficient , the added noise temperature , the effect of the misalignment between the true axion frequency and the lower boundaries of the frequency bins, and the variation of the SG-filter parameters.
The analysis that merges bins without assuming a signal line shape results in % larger values on the limits. If a Gaussian signal line shape with an FWHM of 2.5 kHz is assumed instead, the limits will be % smaller than the central results. If the limits are derived from the observed SNR as described in the ADMX paper [54], rather than using the 5 target SNR, the average limit on will be .
After the collection of the CD102 data, synthetic axion signals were injected into the cavity via the transmission input line (Fig. 1) and read out via the same amplification chain. The procedure to generate axion-like signals is summarized in Ref. [43] and the analysis of the synthetic axion data is described in Ref. [51]. The analysis results demonstrate the capability of the experimental setup and the analysis strategy to discover an axion signal with .
In summary, a search for axions in the mass range was performed by the TASEH Collaboration. Apart from the non-axion signals, no candidates with a significance more than 3.355 were found. The experiment excludes models with the axion-two-photon coupling at 95% C.L., a factor of eleven above the benchmark KSVZ model. The sensitivity on reached by TASEH is three orders of magnitude better than the existing limits in the same mass range. It is also the first time that a haloscope-type experiment places constraints in this mass region. The target of TASEH is to search for axions in the mass range of 16.5–20.7 corresponding to a frequency range of 4–5 GHz. With the upcoming upgrades of the experimental setup and several years of data taking, TASEH is expected to probe the QCD axion band in the target mass range.
Acknowledgements.
We thank Chao-Lin Kuo for his help to initiate this project as well as discussions on the microwave cavity design, Gray Rybka and Nicole Crisosto for their introduction of the ADMX experimental setup and analysis, Anson Hook for the discussions and the review of the axion theory, and Jiunn-Wei Chen, Cheng-Wei Chiang, Cheng-Pang Liu, and Asuka Ito for the discussions of future improvements in axion searches. We acknowledge support of microwave test and measurement equipment from the National Chung-Shan Institute of Science and Technology. The work of the TASEH Collaboration was funded by the Ministry of Science and Technology (MoST) of Taiwan with grant numbers MoST-109-2123-M-001-002, MoST-110-2123-M-001-006, MoST-110-2112-M-213-018, MoST-110-2628-M-008-003-MY3, and MoST-109-2112-M-008-013-MY3, and by the Institute of Physics, Academia Sinica.References
- Gaitskell [2004] R. J. Gaitskell, Ann. Rev. Nucl. Part. Sci. 54, 315 (2004).
- Trimble [1987] V. Trimble, Ann. Rev. Astron. Astrophys. 25, 425 (1987).
- Porter et al. [2011] T. A. Porter, R. P. Johnson, and P. W. Graham, Ann. Rev. Astron. Astrophys. 49, 155 (2011).
- Aghanim et al. [2020] N. Aghanim et al. (Planck), Astron. Astrophys. 641, A6 (2020), [Erratum: Astron.Astrophys. 652, C4 (2021)].
- Zyla et al. [2021] P. A. Zyla et al. (Particle Data Group), PTEP 2020, 083C01 (2021).
- Peccei and Quinn [1977] R. D. Peccei and H. R. Quinn, Phys. Rev. Lett. 38, 1440 (1977).
- Weinberg [1978] S. Weinberg, Phys. Rev. Lett. 40, 223 (1978).
- Wilczek [1978] F. Wilczek, Phys. Rev. Lett. 40, 279 (1978).
- Preskill et al. [1983] J. Preskill, M. B. Wise, and F. Wilczek, Physics Letters B 120, 127 (1983).
- Abbott and Sikivie [1983] L. Abbott and P. Sikivie, Physics Letters B 120, 133 (1983).
- Dine and Fischler [1983] M. Dine and W. Fischler, Physics Letters B 120, 137 (1983).
- Ipser and Sikivie [1983] J. Ipser and P. Sikivie, Phys. Rev. Lett. 50, 925 (1983).
- Borsanyi et al. [2016] S. Borsanyi, Z. Fodor, J. Guenther, K.-H. Kampert, S. D. Katz, T. Kawanai, T. G. Kovacs, S. W. Mages, A. Pasztor, F. Pittler, J. Redondo, A. Ringwald, and K. K. Szabo, Nature 539, 69 (2016).
- Dine et al. [2017] M. Dine, P. Draper, L. Stephenson-Haskins, and D. Xu, Phys. Rev. D 96, 095001 (2017).
- Hiramatsu et al. [2011] T. Hiramatsu, M. Kawasaki, T. Sekiguchi, M. Yamaguchi, and J. Yokoyama, Phys. Rev. D 83, 123531 (2011).
- Kawasaki et al. [2015] M. Kawasaki, K. Saikawa, and T. Sekiguchi, Phys. Rev. D 91, 065014 (2015).
- Berkowitz et al. [2015] E. Berkowitz, M. I. Buchoff, and E. Rinaldi, Phys. Rev. D 92, 034507 (2015).
- Fleury and Moore [2016] L. Fleury and G. D. Moore, J. Cosmol. Astropart. Phys. 01 (2016), 004.
- Bonati et al. [2016] C. Bonati, M. D’Elia, M. Mariti, G. Martinelli, M. Mesiti, F. Negro, F. Sanfilippo, and G. Villadoro, JHEP 03 (2016), 155.
- Petreczky et al. [2016] P. Petreczky, H.-P. Schadler, and S. Sharma, Phys. Lett. B 762, 498 (2016).
- Ballesteros et al. [2017] G. Ballesteros, J. Redondo, A. Ringwald, and C. Tamarit, Phys. Rev. Lett. 118, 071802 (2017).
- Klaer and Moore [2017] V. B. Klaer and G. D. Moore, J. Cosmol. Astropart. Phys. 11 (2017), 049.
- Buschmann et al. [2020] M. Buschmann, J. W. Foster, and B. R. Safdi, Phys. Rev. Lett. 124, 161103 (2020).
- Gorghetto et al. [2021] M. Gorghetto, E. Hardy, and G. Villadoro, SciPost Phys. 10, 050 (2021).
- Buschmann et al. [2022] M. Buschmann, J. W. Foster, A. Hook, A. Peterson, D. E. Willcox, W. Zhang, and B. R. Safdi, Nature Commun. 13, 1049 (2022).
- Sikivie [1983] P. Sikivie, Phys. Rev. Lett. 51, 1415 (1983).
- Sikivie [1985] P. Sikivie, Phys. Rev. D 32, 2988 (1985).
- Hagmann et al. [1998] C. Hagmann, D. Kinion, W. Stoeffl, K. van Bibber, E. Daw, H. Peng, L. J. Rosenberg, J. LaVeigne, P. Sikivie, N. S. Sullivan, D. B. Tanner, F. Nezrick, M. S. Turner, D. M. Moltz, J. Powell, and N. A. Golubev, Phys. Rev. Lett. 80, 2043 (1998).
- Asztalos et al. [2002] S. J. Asztalos, E. Daw, H. Peng, L. J. Rosenberg, D. B. Yu, C. Hagmann, D. Kinion, W. Stoeffl, K. van Bibber, J. LaVeigne, P. Sikivie, N. S. Sullivan, D. B. Tanner, F. Nezrick, and D. M. Moltz, The Astrophysical Journal 571, L27 (2002).
- Asztalos et al. [2004] S. J. Asztalos, R. F. Bradley, L. Duffy, C. Hagmann, D. Kinion, D. M. Moltz, L. J. Rosenberg, P. Sikivie, W. Stoeffl, N. S. Sullivan, D. B. Tanner, K. van Bibber, and D. B. Yu, Phys. Rev. D 69, 011101(R) (2004).
- Asztalos et al. [2010] S. J. Asztalos, G. Carosi, C. Hagmann, D. Kinion, K. van Bibber, M. Hotz, L. J. Rosenberg, G. Rybka, J. Hoskins, J. Hwang, P. Sikivie, D. B. Tanner, R. Bradley, and J. Clarke, Phys. Rev. Lett. 104, 041301 (2010).
- Du et al. [2018] N. Du, N. Force, R. Khatiwada, E. Lentz, R. Ottens, L. J. Rosenberg, G. Rybka, G. Carosi, N. Woollett, D. Bowring, A. S. Chou, A. Sonnenschein, W. Wester, C. Boutan, N. S. Oblath, R. Bradley, E. J. Daw, A. V. Dixit, J. Clarke, S. R. O’Kelley, N. Crisosto, J. R. Gleason, S. Jois, P. Sikivie, I. Stern, N. S. Sullivan, D. B. Tanner, and G. C. Hilton (ADMX Collaboration), Phys. Rev. Lett. 120, 151301 (2018).
- Braine et al. [2020] T. Braine, R. Cervantes, N. Crisosto, N. Du, S. Kimes, L. J. Rosenberg, G. Rybka, J. Yang, D. Bowring, A. S. Chou, R. Khatiwada, A. Sonnenschein, W. Wester, G. Carosi, N. Woollett, L. D. Duffy, R. Bradley, C. Boutan, M. Jones, B. H. LaRoque, N. S. Oblath, M. S. Taubman, J. Clarke, A. Dove, A. Eddins, S. R. O’Kelley, S. Nawaz, I. Siddiqi, N. Stevenson, A. Agrawal, A. V. Dixit, J. R. Gleason, S. Jois, P. Sikivie, J. A. Solomon, N. S. Sullivan, D. B. Tanner, E. Lentz, E. J. Daw, J. H. Buckley, P. M. Harrington, E. A. Henriksen, and K. W. Murch (ADMX Collaboration), Phys. Rev. Lett. 124, 101303 (2020).
- Bartram et al. [2021a] C. Bartram et al. (ADMX Collaboration), Phys. Rev. Lett. 127, 261803 (2021a).
- Brubaker et al. [2017a] B. M. Brubaker, L. Zhong, Y. V. Gurevich, S. B. Cahn, S. K. Lamoreaux, M. Simanovskaia, J. R. Root, S. M. Lewis, S. Al Kenany, K. M. Backes, I. Urdinaran, N. M. Rapidis, T. M. Shokair, K. A. van Bibber, D. A. Palken, M. Malnou, W. F. Kindel, M. A. Anil, K. W. Lehnert, and G. Carosi, Phys. Rev. Lett. 118, 061302 (2017a).
- Zhong et al. [2018] L. Zhong, S. Al Kenany, K. M. Backes, B. M. Brubaker, S. B. Cahn, G. Carosi, Y. V. Gurevich, W. F. Kindel, S. K. Lamoreaux, K. W. Lehnert, S. M. Lewis, M. Malnou, R. H. Maruyama, D. A. Palken, N. M. Rapidis, J. R. Root, M. Simanovskaia, T. M. Shokair, D. H. Speller, I. Urdinaran, and K. A. van Bibber, Phys. Rev. D 97, 092001 (2018).
- Backes et al. [2021] K. M. Backes, D. A. Palken, S. Al Kenany, B. M. Brubaker, S. B. Cahn, A. Droster, G. C. Hilton, S. Ghosh, H. Jackson, S. K. Lamoreaux, A. F. Leder, K. W. Lehnert, S. M. Lewis, M. Malnou, R. H. Maruyama, N. M. Rapidis, M. Simanovskaia, S. Singh, D. H. Speller, I. Urdinaran, L. R. Vale, E. C. van Assendelft, K. van Bibber, and H. Wang, Nature 590, 238–242 (2021).
- Lee et al. [2020] S. Lee, S. Ahn, J. Choi, B. R. Ko, and Y. K. Semertzidis, Phys. Rev. Lett. 124, 101802 (2020).
- Jeong et al. [2020] J. Jeong, S. W. Youn, S. Bae, J. Kim, T. Seong, J. E. Kim, and Y. K. Semertzidis, Phys. Rev. Lett. 125, 221302 (2020).
- Kwon et al. [2021] O. Kwon, D. Lee, W. Chung, D. Ahn, H. S. Byun, F. Caspers, H. Choi, J. Choi, Y. Chong, H. Jeong, J. Jeong, J. E. Kim, J. Kim, C. Kutlu, J. Lee, M. J. Lee, S. Lee, A. Matlashov, S. Oh, S. Park, S. Uchaikin, S. W. Youn, and Y. K. Semertzidis, Phys. Rev. Lett. 126, 191802 (2021).
- Alesini et al. [2021] D. Alesini, C. Braggio, G. Carugno, N. Crescini, D. D’Agostino, D. Di Gioacchino, R. Di Vora, P. Falferi, U. Gambardella, C. Gatti, G. Iannone, C. Ligi, A. Lombardi, G. Maccarrone, A. Ortolan, R. Pengo, A. Rettaroli, G. Ruoso, L. Taffarello, and S. Tocci, Phys. Rev. D 103, 102004 (2021).
- Choi et al. [2021] J. Choi, S. Ahn, B. Ko, S. Lee, and Y. Semertzidis, Nuclear Instruments and Methods in Physics Research Section A: Accelerators, Spectrometers, Detectors and Associated Equipment 1013, 165667 (2021).
- Chang et al. [2022a] H. Chang, J.-Y. Chang, Y.-C. Chang, Y.-H. Chang, Y.-H. Chang, C.-H. Chen, C.-F. Chen, K.-Y. Chen, Y.-F. Chen, W.-Y. Chiang, W.-C. Chien, H. T. Doan, W.-C. Hung, W. Kuo, S.-B. Lai, H.-W. Liu, M.-W. OuYang, P.-I. Wu, and S.-S. Yu (TASEH Collaboration), (2022a), arXiv:2205.01477 [physics.ins-det] .
- Alesini et al. [2019] D. Alesini, C. Braggio, G. Carugno, N. Crescini, D. D’Agostino, D. Di Gioacchino, R. Di Vora, P. Falferi, S. Gallo, U. Gambardella, C. Gatti, G. Iannone, G. Lamanna, C. Ligi, A. Lombardi, R. Mezzena, A. Ortolan, R. Pengo, N. Pompeo, A. Rettaroli, G. Ruoso, E. Silva, C. C. Speake, L. Taffarello, and S. Tocci, Phys. Rev. D 99, 101101(R) (2019).
- Read [2014] J. I. Read, J. Phys. G: Nucl. Part. Phys. 41, 063101 (2014).
- Kim [1979] J. E. Kim, Phys. Rev. Lett. 43, 103 (1979).
- Shifman et al. [1980] M. A. Shifman, A. I. Vainshtein, and V. I. Zakharov, Nucl. Phys. B 166, 493 (1980).
- Dine et al. [1981] M. Dine, W. Fischler, and M. Srednicki, Phys. Lett. B 104, 199 (1981).
- Zhitnitsky [1980] A. R. Zhitnitsky, Sov. J. Nucl. Phys. 31, 260 (1980).
- Dicke [1946] R. H. Dicke, Review of Scientific Instruments 17, 268 (1946).
- Chang et al. [2022b] H. Chang, J.-Y. Chang, Y.-C. Chang, Y.-H. Chang, Y.-H. Chang, C.-H. Chen, C.-F. Chen, K.-Y. Chen, Y.-F. Chen, W.-Y. Chiang, W.-C. Chien, H. T. Doan, W.-C. Hung, W. Kuo, S.-B. Lai, H.-W. Liu, M.-W. OuYang, P.-I. Wu, and S.-S. Yu (TASEH Collaboration), (2022b), arXiv:2204.14265 [hep-ex] .
- Brubaker et al. [2017b] B. M. Brubaker, L. Zhong, S. K. Lamoreaux, K. W. Lehnert, and K. A. van Bibber, Phys. Rev. D 96, 123008 (2017b).
- Savitzky and Golay [1964] A. Savitzky and M. J. E. Golay, Anal. Chem. 36, 1627 (1964).
- Bartram et al. [2021b] C. Bartram, T. Braine, R. Cervantes, N. Crisosto, N. Du, G. Leum, L. J. Rosenberg, G. Rybka, J. Yang, D. Bowring, A. S. Chou, R. Khatiwada, A. Sonnenschein, W. Wester, G. Carosi, N. Woollett, L. D. Duffy, M. Goryachev, B. McAllister, M. E. Tobar, C. Boutan, M. Jones, B. H. LaRoque, N. S. Oblath, M. S. Taubman, J. Clarke, A. Dove, A. Eddins, S. R. O’Kelley, S. Nawaz, I. Siddiqi, N. Stevenson, A. Agrawal, A. V. Dixit, J. R. Gleason, S. Jois, P. Sikivie, J. A. Solomon, N. S. Sullivan, D. B. Tanner, E. Lentz, E. J. Daw, M. G. Perry, J. H. Buckley, P. M. Harrington, E. A. Henriksen, and K. W. Murch (ADMX Collaboration), Phys. Rev. D 103, 032002 (2021b).