Analysis of TESS observations of V844 Her during the 2020 superoutburst
Abstract
I analyzed Transiting Exoplanet Survey Satellite (TESS) observations of the 2020 superoutburst of the SU UMa-type dwarf nova V844 Her. This object showed “textbook” superhump stages A, B and C confirmed by modern satellite observations. The resultant figure can be used for an illustration of the concept of superhump stages under the Creative Commons (CC-BY-NC) licence. During the growing phase of superhumps, the period was initially close to, but slightly longer than the orbital period. Observers should pay attention to the presence of such a phenomenon not to confuse the phenomenon with early superhumps seen in WZ Sge stars. After the superoutburst, superhumps were detected for additional 18 d with the same period and no orbital signal was detected. Small wiggles with a period of 0.5 d were recorded in the post-superoutburst phase and they may be the same phenomenon recorded in the Kepler data of the SU UMa star V585 Lyr.
tkato@kusastro.kyoto-u.ac.jp
Department of Astronomy, Kyoto University, Sakyo-ku, Kyoto 606-8502, Japan
Superhump stages A, B and C in SU UMa-type (including WZ Sge-type) dwarf novae were established in Kato et al. (2009) [for general information of cataclysmic variables and dwarf novae, see e.g. Warner (1995)]. In Kato et al. (2009), a figure representing stage A–C was shown based on the 2000 ground-based observation of SW UMa (in their figure 3), and this figure or its revision (figure 1 in Kato and Osaki (2013b)) has been used in various papers to explain the concept of superhump stages. The data for SW UMa, however, were rather old and there were gaps in the observations. Although a figure based on continuous satellite observations had been desired, only long cadence (LC) Kepler data of V585 Lyr could be used nine years ago (Kato and Osaki 2013a). The Kepler LC data were insufficient to draw an diagram directly and Kato and Osaki (2013a) had to reconstruct the original light curve by introducing a Bayesian method.
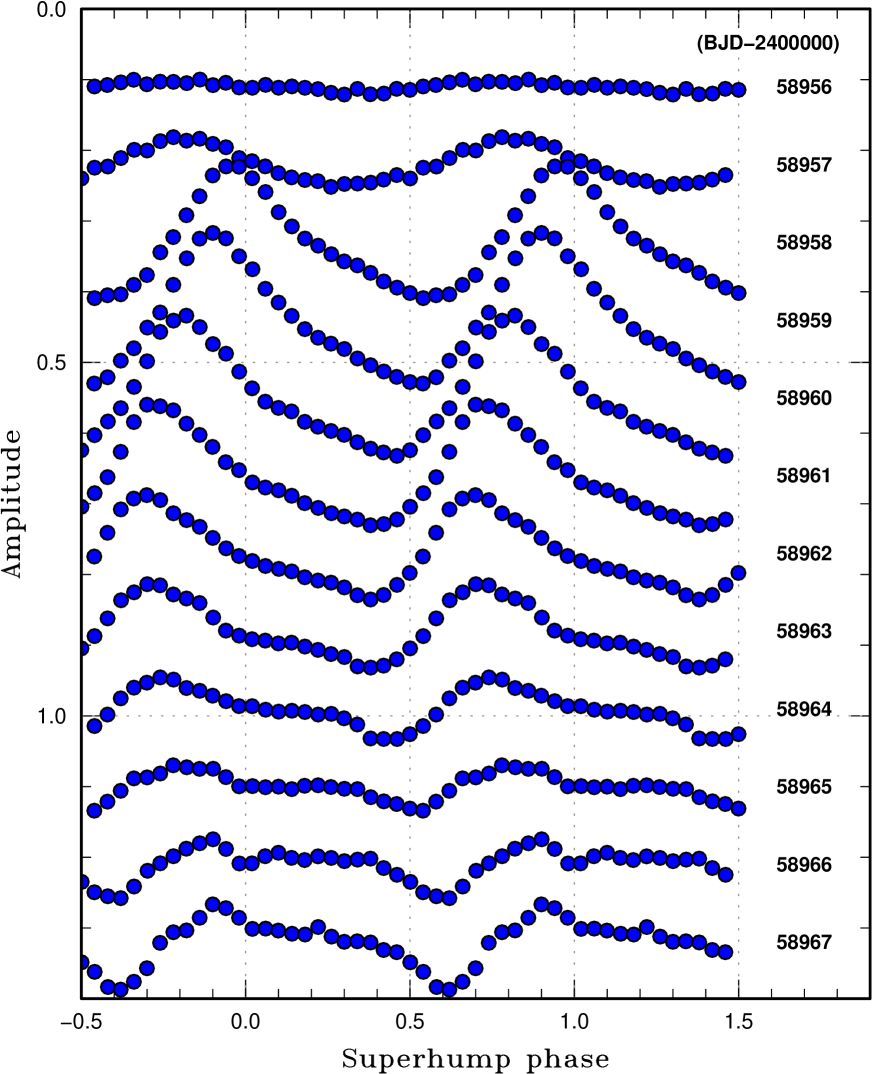
The aim of this paper is to provide a corresponding figure based on modern data which is equivalent to figure 3 in Kato et al. (2009). I used Transiting Exoplanet Survey Satellite (TESS) observations (Ricker et al. 2015)111 https://tess.mit.edu/observations/. The full light-curve is available at the Mikulski Archive for Space Telescope (MAST, http://archive.stsci.edu/). of the 2020 superoutburst of V844 Her, which is an SU UMa-type dwarf nova very similar to SW UMa (Antipin 1996; Kato and Uemura 2000; Oizumi et al. 2007) and has a similar short orbital period of 0.054643 d (Thorstensen et al. 2002). In addition to the greatly improved coverage and statistics, the figures in this paper are provided under the Creative Commons licence (CC-BY-NC) and can be used without consideration of the copyright of the publisher. First of all, I show figure 1. This figure clearly demonstrate the “textbook” example of superhump stages in a short-period SU UMa-type dwarf nova. I describe how I obtained this figure.
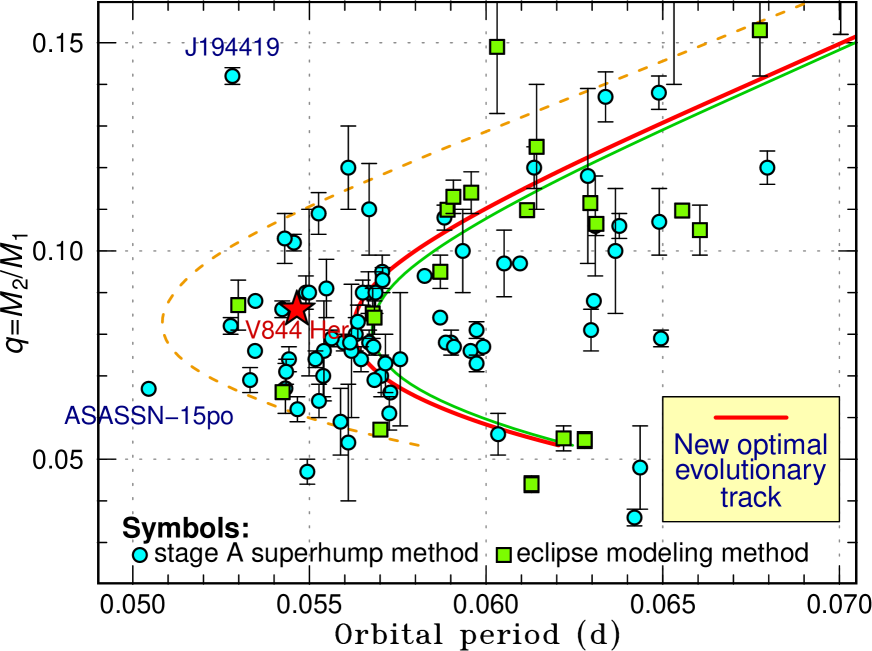
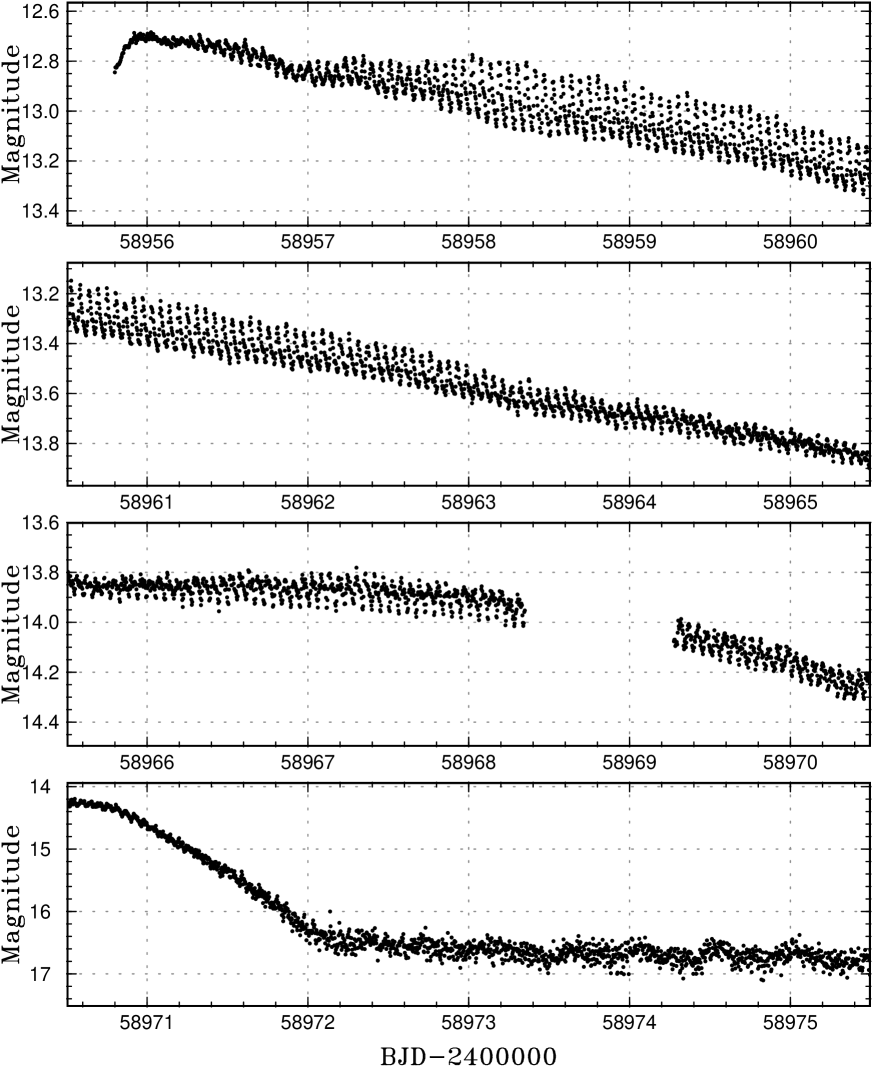
The TESS data of V844 Her during the 2020 superoutburst and early post-superoutburst phase are shown in figure 3. The superhump maxima were obtained by the template fitting method introduced in Kato et al. (2009) and the quality of the values is the same as in the series of “Pdot papers” (Kato et al. 2009, 2010, 2012, 2013, 2014b, 2014a, 2015, 2016, 2017, 2020) for a collection of SU UMa/WZ Sge stars and which were homogeneously determined using the same method. This method has an advantage of much higher signal-to-noise and thereby higher precision in determining maxima than picking up the peaks (Kato et al. 2009). The representative superhump periods in different superhump stages are given in table 1. For stages A, B and C, the mean period () and the period derivative () are given. For the post-superoutburst stage, individual maxima could not be obtained by the template fitting method and the periods were determined using the Phase Dispersion Minimization (PDM, Stellingwerf (1978)) method after removing long-term trends by locally-weighted polynomial regression (LOWESS: Cleveland (1979)). The errors of periods by the PDM method were estimated by the methods of Fernie (1989) and Kato et al. (2010). I used 3-d windows considering the beat period between and the superhump period (). Using and the period of stage A superhumps, the fractional superhump excess in frequency for stage A is 0.0316(7). This value corresponds to a mass ratio of =0.086(2) using the stage A superhump method (Kato and Osaki 2013b; Kato 2022). The location on the – plane is shown in figure 2, on which V844 Her was plotted on figure 11 in Kato (2022).
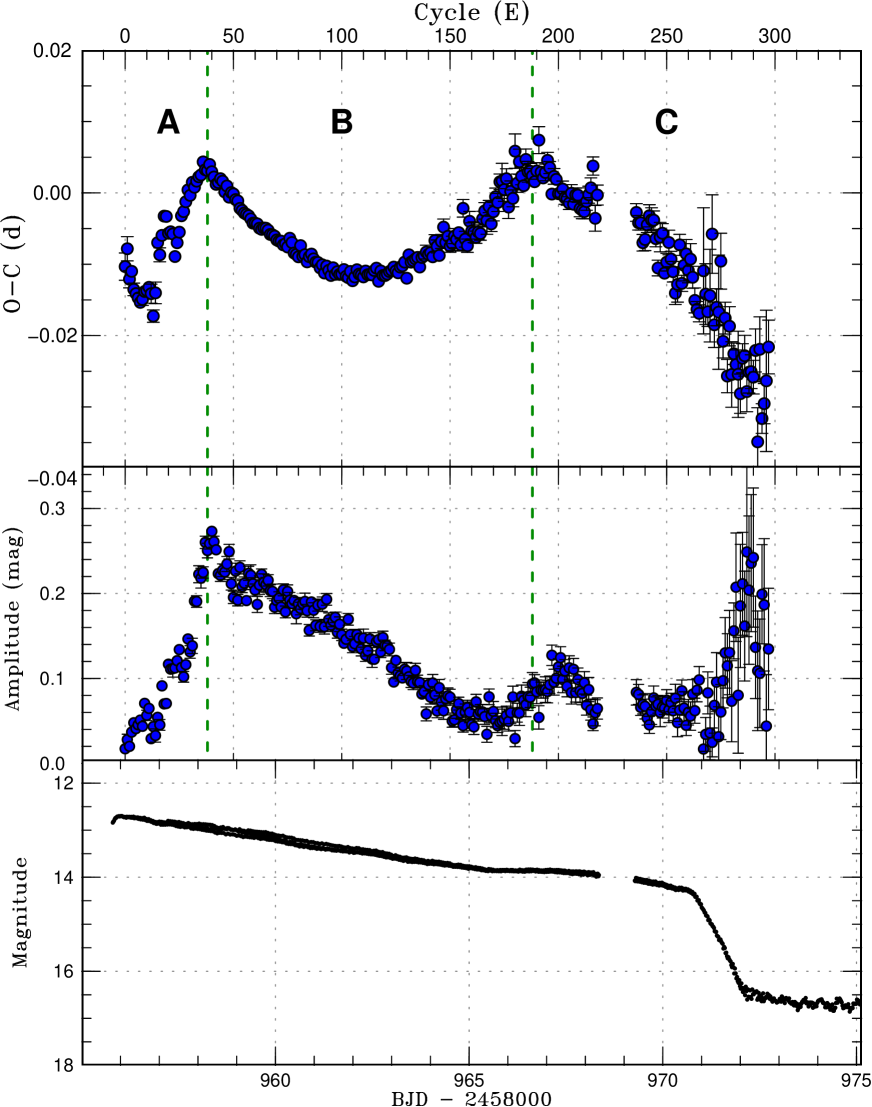
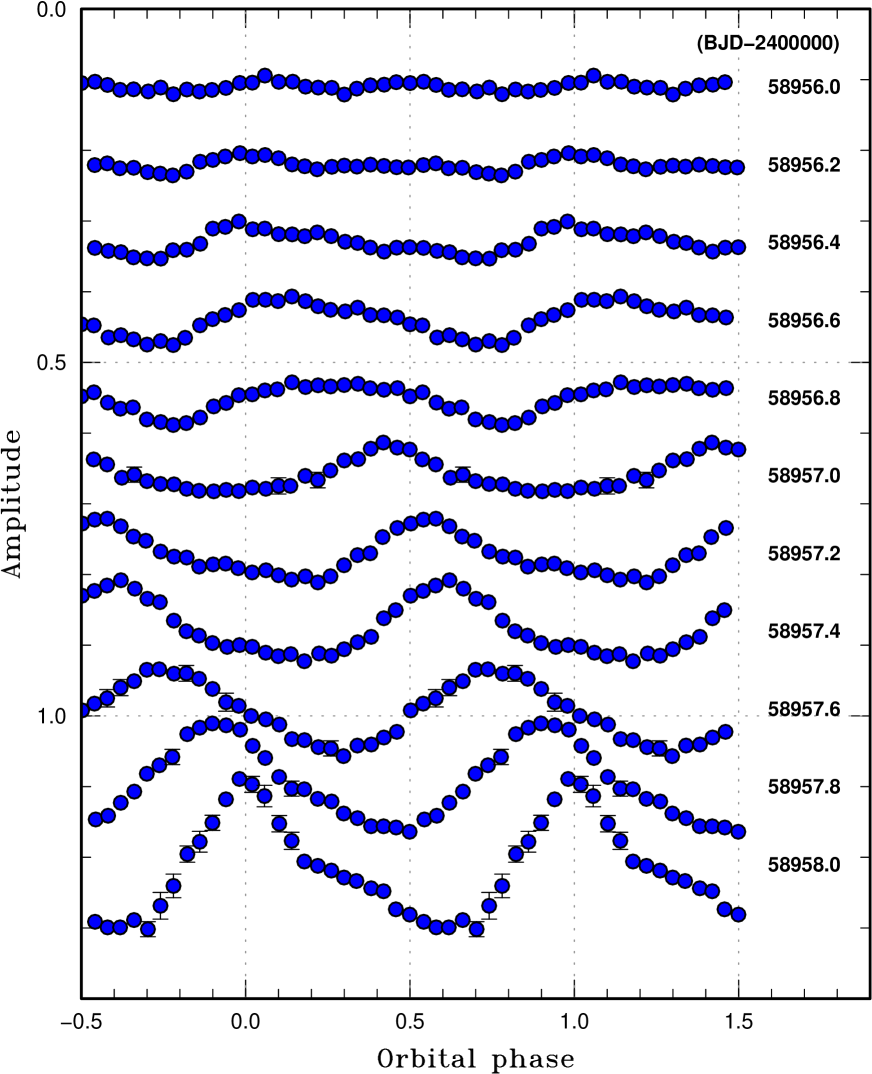
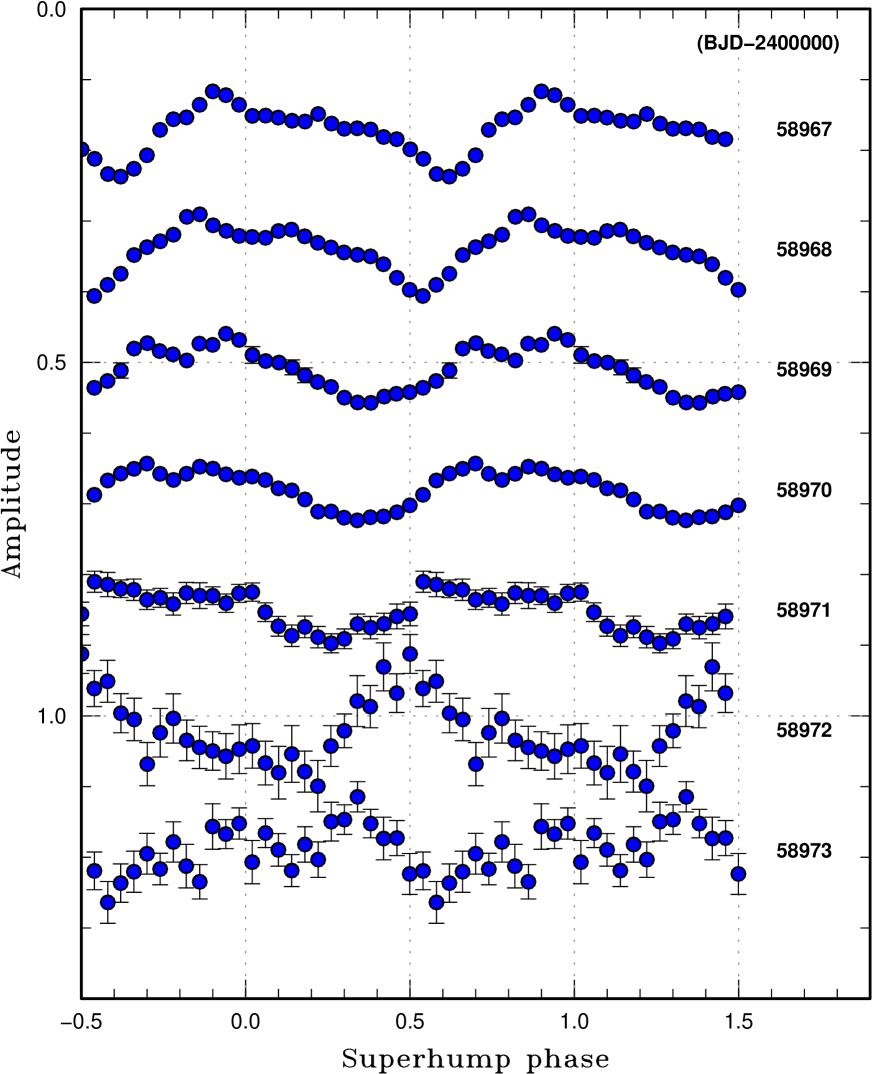
The variation of the superhump profile is shown in figures 4, 5 and 6. The most important finding in this paper is in the development of superhumps in stage A (figure 4). Although stage A with growing amplitudes is clearly present in figure 1, the variation is not on a straight line. The reason has been clarified in figure 4: before stage A superhump started to develop fully, there was a phase when the period was close to (but slightly longer than) the orbital period. The average epoch of humps in this phase, however, was on the smooth extension of stage A superhumps (see figure 1). It was not clear whether this feature is special to V844 Her or it is a general phenomenon. Observers should pay attention to the presence of this phenomenon not to confuse this variation with early superhumps seen in WZ Sge stars (Kato 2015). This is particularly true when the period is identified only by frequency(period) analysis and no analysis is performed.
During the post-superoutburst phase (figure 6), superhumps rapidly decayed. The superhump signal, however, was detected with the same period by the PDM method for 18 d in the post-superoutburst phase (table 1; the gap between BJD 2458981 and 2458984 was due to the gap in TESS observation). No orbital signal was detected during the post-superoutburst phase as in the case of V585 Lyr. The small wiggles with a period of 0.5 d during the post-superoutburst phase (figure 3) may be the same phenomenon of “mini-rebrightenings” recorded in the Kepler data of V585 Lyr (Kato and Osaki 2013a).
The times of maxima of superhumps used in this study are listed in table Analysis of TESS observations of V844 Her during the 2020 superoutburst.
| Stage | BJD2400000 | Period (d) | ||
|---|---|---|---|---|
| A | 0–38 | 58956.11–58958.25 | 0.056425(43) | 44(13) |
| B | 38–188 | 58958.25–58966.64 | 0.055928(9) | 9.7(2) |
| C | 188–297 | 58966.64–58972.71 | 0.055638(12) | 9.0(12) |
| Post-superoutburst | – | 58972–58975 | 0.05554(4) | – |
| Post-superoutburst | – | 58975–58978 | 0.05554(4) | – |
| Post-superoutburst | – | 58978–58981 | 0.05554(4) | – |
| Post-superoutburst | – | 58984–58987 | 0.05553(6) | – |
| Post-superoutburst | – | 58987–58990 | 0.05558(8) | – |
| ∗ | error | amp† | error | amp | error | amp | |||||
|---|---|---|---|---|---|---|---|---|---|---|---|
| 0 | 956.1094 | 0.0019 | 0.017 | 47 | 958.7490 | 0.0003 | 0.235 | 94 | 961.3654 | 0.0003 | 0.169 |
| 1 | 956.1679 | 0.0017 | 0.028 | 48 | 958.8033 | 0.0002 | 0.249 | 95 | 961.4206 | 0.0003 | 0.163 |
| 2 | 956.2195 | 0.0012 | 0.020 | 49 | 958.8599 | 0.0002 | 0.212 | 96 | 961.4776 | 0.0003 | 0.167 |
| 3 | 956.2765 | 0.0008 | 0.037 | 50 | 958.9156 | 0.0003 | 0.195 | 97 | 961.5326 | 0.0003 | 0.172 |
| 4 | 956.3299 | 0.0009 | 0.048 | 51 | 958.9707 | 0.0003 | 0.226 | 98 | 961.5889 | 0.0003 | 0.154 |
| 5 | 956.3852 | 0.0007 | 0.041 | 52 | 959.0265 | 0.0002 | 0.192 | 99 | 961.6444 | 0.0004 | 0.164 |
| 6 | 956.4406 | 0.0008 | 0.045 | 53 | 959.0814 | 0.0002 | 0.231 | 100 | 961.7004 | 0.0003 | 0.151 |
| 7 | 956.4959 | 0.0008 | 0.051 | 54 | 959.1370 | 0.0002 | 0.208 | 101 | 961.7569 | 0.0003 | 0.141 |
| 8 | 956.5522 | 0.0008 | 0.044 | 55 | 959.1925 | 0.0003 | 0.212 | 102 | 961.8119 | 0.0003 | 0.146 |
| 9 | 956.6092 | 0.0004 | 0.071 | 56 | 959.2483 | 0.0002 | 0.192 | 103 | 961.8676 | 0.0003 | 0.170 |
| 10 | 956.6653 | 0.0007 | 0.056 | 57 | 959.3040 | 0.0003 | 0.224 | 104 | 961.9244 | 0.0003 | 0.152 |
| 11 | 956.7216 | 0.0005 | 0.065 | 58 | 959.3595 | 0.0004 | 0.221 | 105 | 961.9791 | 0.0004 | 0.137 |
| 12 | 956.7767 | 0.0013 | 0.029 | 59 | 959.4148 | 0.0002 | 0.211 | 106 | 962.0355 | 0.0005 | 0.141 |
| 13 | 956.8295 | 0.0009 | 0.043 | 60 | 959.4707 | 0.0002 | 0.204 | 107 | 962.0924 | 0.0003 | 0.152 |
| 14 | 956.8886 | 0.0015 | 0.033 | 61 | 959.5265 | 0.0004 | 0.187 | 108 | 962.1477 | 0.0003 | 0.147 |
| 15 | 956.9516 | 0.0007 | 0.054 | 62 | 959.5819 | 0.0004 | 0.210 | 109 | 962.2035 | 0.0004 | 0.135 |
| 16 | 957.0058 | 0.0010 | 0.045 | 63 | 959.6376 | 0.0002 | 0.223 | 110 | 962.2592 | 0.0005 | 0.147 |
| 17 | 957.0644 | 0.0005 | 0.091 | 64 | 959.6937 | 0.0003 | 0.213 | 111 | 962.3159 | 0.0004 | 0.127 |
| 18 | 957.1231 | 0.0005 | 0.070 | 65 | 959.7496 | 0.0003 | 0.210 | 112 | 962.3713 | 0.0003 | 0.132 |
| 19 | 957.1789 | 0.0005 | 0.070 | 66 | 959.8053 | 0.0002 | 0.215 | 113 | 962.4273 | 0.0004 | 0.147 |
| 20 | 957.2325 | 0.0003 | 0.117 | 67 | 959.8606 | 0.0002 | 0.203 | 114 | 962.4831 | 0.0006 | 0.123 |
| 21 | 957.2886 | 0.0004 | 0.111 | 68 | 959.9164 | 0.0003 | 0.202 | 115 | 962.5397 | 0.0003 | 0.123 |
| 22 | 957.3442 | 0.0006 | 0.112 | 69 | 959.9722 | 0.0003 | 0.184 | 116 | 962.5959 | 0.0003 | 0.143 |
| 23 | 957.3970 | 0.0003 | 0.112 | 70 | 960.0276 | 0.0002 | 0.191 | 117 | 962.6500 | 0.0004 | 0.146 |
| 24 | 957.4549 | 0.0003 | 0.121 | 71 | 960.0833 | 0.0003 | 0.194 | 118 | 962.7074 | 0.0004 | 0.131 |
| 25 | 957.5123 | 0.0003 | 0.134 | 72 | 960.1392 | 0.0003 | 0.184 | 119 | 962.7627 | 0.0004 | 0.148 |
| 26 | 957.5705 | 0.0003 | 0.113 | 73 | 960.1946 | 0.0002 | 0.204 | 120 | 962.8186 | 0.0003 | 0.139 |
| 27 | 957.6270 | 0.0004 | 0.102 | 74 | 960.2507 | 0.0003 | 0.178 | 121 | 962.8747 | 0.0003 | 0.138 |
| 28 | 957.6843 | 0.0003 | 0.116 | 75 | 960.3062 | 0.0003 | 0.202 | 122 | 962.9310 | 0.0004 | 0.134 |
| 29 | 957.7419 | 0.0002 | 0.146 | 76 | 960.3633 | 0.0003 | 0.192 | 123 | 962.9871 | 0.0005 | 0.113 |
| 30 | 957.7970 | 0.0004 | 0.131 | 77 | 960.4186 | 0.0002 | 0.188 | 124 | 963.0434 | 0.0004 | 0.096 |
| 31 | 957.8548 | 0.0005 | 0.138 | 78 | 960.4731 | 0.0002 | 0.192 | 125 | 963.0988 | 0.0003 | 0.121 |
| 32 | 957.9100 | 0.0002 | 0.191 | 79 | 960.5288 | 0.0005 | 0.176 | 126 | 963.1545 | 0.0005 | 0.106 |
| 33 | 957.9668 | 0.0003 | 0.191 | 80 | 960.5844 | 0.0003 | 0.188 | 127 | 963.2112 | 0.0004 | 0.103 |
| 34 | 958.0233 | 0.0003 | 0.223 | 81 | 960.6419 | 0.0003 | 0.182 | 128 | 963.2673 | 0.0003 | 0.101 |
| 35 | 958.0795 | 0.0004 | 0.218 | 82 | 960.6963 | 0.0002 | 0.188 | 129 | 963.3237 | 0.0005 | 0.111 |
| 36 | 958.1372 | 0.0002 | 0.225 | 83 | 960.7525 | 0.0004 | 0.191 | 130 | 963.3774 | 0.0007 | 0.109 |
| 37 | 958.1920 | 0.0002 | 0.260 | 84 | 960.8074 | 0.0003 | 0.180 | 131 | 963.4366 | 0.0004 | 0.102 |
| 38 | 958.2479 | 0.0002 | 0.251 | 85 | 960.8640 | 0.0003 | 0.157 | 132 | 963.4915 | 0.0005 | 0.096 |
| 39 | 958.3046 | 0.0002 | 0.259 | 86 | 960.9203 | 0.0002 | 0.190 | 133 | 963.5476 | 0.0006 | 0.095 |
| 40 | 958.3595 | 0.0001 | 0.273 | 87 | 960.9756 | 0.0003 | 0.180 | 134 | 963.6038 | 0.0005 | 0.109 |
| 41 | 958.4147 | 0.0002 | 0.261 | 88 | 961.0310 | 0.0003 | 0.162 | 135 | 963.6599 | 0.0005 | 0.096 |
| 42 | 958.4696 | 0.0001 | 0.251 | 89 | 961.0869 | 0.0003 | 0.186 | 136 | 963.7145 | 0.0004 | 0.095 |
| 43 | 958.5258 | 0.0002 | 0.223 | 90 | 961.1421 | 0.0003 | 0.161 | 137 | 963.7717 | 0.0005 | 0.082 |
| 44 | 958.5822 | 0.0002 | 0.221 | 91 | 961.1984 | 0.0003 | 0.187 | 138 | 963.8279 | 0.0006 | 0.084 |
| 45 | 958.6378 | 0.0002 | 0.227 | 92 | 961.2532 | 0.0004 | 0.161 | 139 | 963.8843 | 0.0010 | 0.058 |
| 46 | 958.6922 | 0.0003 | 0.225 | 93 | 961.3101 | 0.0003 | 0.193 | 140 | 963.9400 | 0.0005 | 0.093 |
∗BJD2458000. †Amplitude (mag).
†Amplitude (mag).
Acknowledgements
This work was supported by JSPS KAKENHI Grant Number 21K03616. The author is grateful to the TESS team for making their data available to the public. I am grateful to Naoto Kojiguchi for helping downloading the TESS data.
List of objects in this paper
V844 Her, V585 Lyr, WZ Sge, SU UMa, SW UMa
References
We provide two forms of the references section (for ADS and as published) so that the references can be easily incorporated into ADS.
References (for ADS)
- Antipin (1996) Antipin, S. V. 1996, IBVS, 4360, 1
- Cleveland (1979) Cleveland, W. S. 1979, J. Amer. Statist. Assoc., 74, 829 (https://doi.org/10.2307/2286407)
- Fernie (1989) Fernie, J. D. 1989, PASP, 101, 225 (https://doi.org/10.1086/132426)
- Kato (2015) Kato, T. 2015, PASJ, 67, 108 (arXiv:1507.07659)
- Kato (2022) Kato, T. 2022, VSOLJ Variable Star Bull., 89, (arXiv:2201.02945)
- Kato et al. (2014a) Kato, T., et al. 2014a, PASJ, 66, 90 (arXiv:1406.6428)
- Kato et al. (2015) Kato, T., et al. 2015, PASJ, 67, 105 (arXiv:1507.05610)
- Kato et al. (2013) Kato, T., et al. 2013, PASJ, 65, 23 (arXiv:1210.0678)
- Kato et al. (2014b) Kato, T., et al. 2014b, PASJ, 66, 30 (arXiv:1310.7069)
- Kato et al. (2016) Kato, T., et al. 2016, PASJ, 68, 65 (arXiv:1605.06221)
- Kato et al. (2009) Kato, T., et al. 2009, PASJ, 61, S395 (arXiv:0905.1757)
- Kato et al. (2017) Kato, T., et al. 2017, PASJ, 69, 75 (arXiv:1706.03870)
- Kato et al. (2020) Kato, T., et al. 2020, PASJ, 72, 14 (arXiv:1911.04645)
- Kato et al. (2012) Kato, T., et al. 2012, PASJ, 64, 21 (arXiv:1108.5252)
- Kato et al. (2010) Kato, T., et al. 2010, PASJ, 62, 1525 (arXiv:1009.5444)
- Kato and Osaki (2013a) Kato, T., & Osaki, Y. 2013a, PASJ, 65, 97 (arXiv:1305.5636)
- Kato and Osaki (2013b) Kato, T., & Osaki, Y. 2013b, PASJ, 65, 115 (arXiv:1307.5588)
- Kato and Uemura (2000) Kato, T., & Uemura, M. 2000, IBVS, 4902, 1
- Knigge et al. (2011) Knigge, C., Baraffe, I., & Patterson, J. 2011, ApJS, 194, 28 (arXiv:1102.2440)
- Oizumi et al. (2007) Oizumi, S., et al. 2007, PASJ, 59, 643 (arXiv:astro-ph/0702752)
- Ricker et al. (2015) Ricker, G. R., et al. 2015, J. of Astron. Telescopes, Instruments, and Systems, 1, 014003 (https://doi.org/10.1117/1.JATIS.1.1.014003)
- Stellingwerf (1978) Stellingwerf, R. F. 1978, ApJ, 224, 953 (https://doi.org/10.1086/156444)
- Thorstensen et al. (2002) Thorstensen, J. R., Patterson, J., Kemp, J., & Vennes, S. 2002, PASP, 114, 1108 (arXiv:astro-ph/0206426)
- Warner (1995) Warner, B. 1995, Cataclysmic Variable Stars (Cambridge: Cambridge University Press)
References (as published)
- Antipin (1996) Antipin, S. V. (1996) Nine new variables in the Herculis field. IBVS 4360, 1
- Cleveland (1979) Cleveland, W. S. (1979) Robust locally weighted regression and smoothing scatterplots. J. Amer. Statist. Assoc. 74, 829
- Fernie (1989) Fernie, J. D. (1989) Uncertainties in period determinations. PASP 101, 225
- Kato (2015) Kato, T. (2015) WZ Sge-type dwarf novae. PASJ 67, 108
- Kato (2022) Kato, T. (2022) Evolution of short-period cataclysmic variables: implications from eclipse modeling and stage a superhump method (with New Year’s gift). VSOLJ Variable Star Bull. 89, (arXiv:2201.02945)
- Kato et al. (2014a) Kato, T. et al. (2014a) Survey of period variations of superhumps in SU UMa-type dwarf novae. VI: The fifth year (2013–2014). PASJ 66, 90
- Kato et al. (2015) Kato, T. et al. (2015) Survey of period variations of superhumps in SU UMa-type dwarf novae. VII: The sixth year (2014–2015). PASJ 67, 105
- Kato et al. (2013) Kato, T. et al. (2013) Survey of period variations of superhumps in SU UMa-type dwarf novae. IV: The fourth year (2011–2012). PASJ 65, 23
- Kato et al. (2014b) Kato, T. et al. (2014b) Survey of period variations of superhumps in SU UMa-type dwarf novae. V: The fifth year (2012–2013). PASJ 66, 30
- Kato et al. (2016) Kato, T. et al. (2016) Survey of period variations of superhumps in SU UMa-type dwarf novae. VIII: The eighth year (2015-2016). PASJ 68, 65
- Kato et al. (2009) Kato, T. et al. (2009) Survey of period variations of superhumps in SU UMa-type dwarf novae. PASJ 61, S395
- Kato et al. (2017) Kato, T. et al. (2017) Survey of period variations of superhumps in SU UMa-type dwarf novae. IX. The ninth year (2016-2017). PASJ 69, 75
- Kato et al. (2020) Kato, T. et al. (2020) Survey of period variations of superhumps in SU UMa-type dwarf novae. X. The tenth year (2017). PASJ 72, 14
- Kato et al. (2012) Kato, T. et al. (2012) Survey of period variations of superhumps in SU UMa-type dwarf novae. III. The third year (2010–2011). PASJ 64, 21
- Kato et al. (2010) Kato, T. et al. (2010) Survey of Period Variations of Superhumps in SU UMa-Type Dwarf Novae. II. The Second Year (2009-2010). PASJ 62, 1525
- Kato and Osaki (2013a) Kato, T., & Osaki, Y. (2013a) Analysis of three SU UMa-type dwarf novae in the Kepler field. PASJ 65, 97
- Kato and Osaki (2013b) Kato, T., & Osaki, Y. (2013b) New method to estimate binary mass ratios by using superhumps. PASJ 65, 115
- Kato and Uemura (2000) Kato, T., & Uemura, M. (2000) CCD photometry of the 1999 superoutburst of V844 Her. IBVS 4902, 1
- Knigge et al. (2011) Knigge, C., Baraffe, I., & Patterson, J. (2011) The evolution of cataclysmic variables as revealed by their donor stars. ApJS 194, 28
- Oizumi et al. (2007) Oizumi, S. et al. (2007) Long-term monitoring of the short period SU UMa-type dwarf nova, V844 Herculis. PASJ 59, 643
- Ricker et al. (2015) Ricker, G. R. et al. (2015) Transiting Exoplanet Survey Satellite (TESS). J. of Astron. Telescopes, Instruments, and Systems 1, 014003
- Stellingwerf (1978) Stellingwerf, R. F. (1978) Period determination using phase dispersion minimization. ApJ 224, 953
- Thorstensen et al. (2002) Thorstensen, J. R., Patterson, J., Kemp, J., & Vennes, S. (2002) The dwarf novae of shortest period. PASP 114, 1108
- Warner (1995) Warner, B. (1995) Cataclysmic Variable Stars (Cambridge: Cambridge University Press)