11email: andrea.chiavassa@oca.eu 22institutetext: Exzellenzcluster ’Origins’, Boltzmannstr. 2, 85748 Garching, Germany 33institutetext: Max Planck Institute for Astrophysics, Karl-Schwarzschild-Str. 1, 85748 Garching, Germany 44institutetext: LMU München, Universitätssternwarte, Scheinerstr. 1, 81679 München, Germany 55institutetext: Institute for Astronomy, University of Hawaii at Manoa, 2680 Woodlawn Drive, Honolulu, HI 96822, USA 66institutetext: Astrophysics Research Institute, Liverpool John Moores University, Liverpool Science Park ic2, mv 146 Brownlow Hill, Liverpool, L3 5RF, UK 77institutetext: Department of Physics and Astronomy at Uppsala University, Regementsvägen 1, Box 516, SE-75120 Uppsala, Sweden 88institutetext: Anton Pannekoek Institute of Astronomy and GRAPPA, Science Park 904, University of Amsterdam, 1098XH Amsterdam, The Netherlands 99institutetext: Center for Astrophysics Harvard Smithsonian, 60 Garden St., Cambridge, MA 02138, USA
Probing Red Supergiant dynamics through photo-center displacements measured by Gaia
Abstract
Context. Red supergiant (RSGs) are cool massive stars in a late phase of their evolution when the stellar envelope becomes fully convective. They are the brightest stars in the universe at infrared light and can be detected in galaxies far beyond the Local Group, allowing for accurate determination of chemical composition of galaxies. The study of their physical properties is extremely important for various phenomena including the final fate of massive stars as type II supernovae and gravitational wave progenitors.
Aims. We explore the well-studied nearby young stellar cluster Per, which contains a relatively large population of RSG stars. Using Gaia EDR3 data, we find the distance of the cluster (d = 2.2600.020 kpc) from blue main sequence stars and compare with RSG parallax measurements analysing the parallax uncertainties of both groups. We then investigate the variability of the convection-related surface structure as a source for parallax measurement uncertainty.
Methods. We use state-of-the-art three-dimensional radiative hydrodynamics simulations of convection with CO5BOLD and the post-processing radiative transfer code OPTIM3D to compute intensity maps in the Gaia photometric system. We calculate the variabiltiy, as a function of time, of the intensity-weighted mean (or the photo-center) from the synthetic maps. We then select the RSG stars in the cluster and compare their uncertainty on parallaxes to the predictions of photocentre displacements.
Results. The synthetic maps of RSG show extremely irregular and temporal variable surfaces due to convection-related dynamics. Consequentially, the position of the photo-center varies during Gaia measurements between 0.033 and 0.130 AU (1 to 5 of the corresponding simulation stellar radius). We argue that the variability of the convection-related surface structures accounts for a substantial part of the Gaia EDR3 parallax error of the RSG sample of Per.
Conclusions. We suggest that the variation of the uncertainty on Gaia parallax could be exploited quantitatively using appropriate RHD simulations to extract, in a unique way, important information about the stellar dynamics and parameters of RSG stars.
Key Words.:
stars: atmospheres – stars: RSG – astrometry – parallaxes – hydrodynamics – convection1 Introduction
Red supergiants (RSG) are cool massive stars in a late phase of their evolution when the stellar envelope becomes fully convective. They are brightest stars in the universe at infrared light. They can be easily detected as individual stellar objects in galaxies far beyond the Local Group, where they provide unique information about chemical composition and galaxy evolution through the quantitative spectral analysis of their infrared spectra (Gazak et al., 2015). In super star clusters (SSC), although small in numbers, they dominate the infrared SEDs (Gazak et al., 2014) allowing for accurate determination of chemical composition of galaxies out to 20 Mpc (Davies et al., 2017; Lardo et al., 2015). At the same time, RSG are the direct progenitors of type II supernovae and as such crucial components of galaxies (Davies & Beasor, 2018). RSG also play a key role in formation channels for gravitational wave sources through common envelope evolution (e.g. Belczynski et al., 2016; Klencki et al., 2021). It is thus imperative to investigate the physical properties of these important sources of astrophysical information in as much detail as possible.
A crucial step is the determination of RSG luminosities based on the accurate measurement of distances. For Milky Way RSG the use of Gaia parallaxes seems ideal for this purpose. Gaia (Gaia Collaboration et al., 2016) is an astrometric, photometric, and spectroscopic space mission performing a whole sky survey including a large part of the Milky Way. The most recent release (Gaia Early Data Release 3, Gaia Collaboration et al., 2021) provides parallaxes of unprecedented accuracy.
However, the situation is not as simple. It is complicated by the
intrinsic variability of RSGs, which to a large extend is caused by
convection related processes in the envelope and at the
surface. In the context of Gaia astrometric measurements, this
convection-related variability, can be considered as a source of ”noise” that
needs to be quantified to better characterize any resulting error on
the parallax determination. Most importantly, the motion of convective
cells leads to the surface brightness distribution
over the stellar surface. These dynamical processes can thus manifest themselves as an apparent change of the position of the star as the photo-center (defined as the intensity weighted geometric mean) moves across the stellar surface. This, in turn, can affect the measurement of parallaxes. The first observational evidence for this effect came from measurements with the Hipparcos satellite, where acceptable fits to the Betelgeuse and Antares (two RSG proto-types) astrometric data could not be found van Leeuwen (2007) and some supplementary noise had to be added to yield acceptable solutions. Harper et al. (2008) conjectured that photo-center motions might be the cause and Chiavassa et al. (2011b), before the Gaia launch, proposed that large-scale convective motions in the photo-center should account for a substantial part of the Hipparcos cosmic noise. More recently, the convection signature in astrometric data of Asymptotic Giant Branch (AGB) stars had been also shown by Chiavassa et al. (2018) and later confirmed by
interferometric images
(Chiavassa et al., 2020).
However, while the photo-center variability appears as a
stumbling block for those primarily interested in obtaining accurate astrometry, it also provides a unique opportunity.
Information about stellar properties, such as the fundamental
parameters and convection properties can be extracted from the
standard deviations of Gaia parallax measurements by using
appropriate radiation-hydrodynamics (RHD) simulations of stellar convection.
The purpose of the work presented here is to demonstrate the feasibility of this. We focus on the nearby young cluster Per, for which accurate parallaxes are measured for its bright blue main sequence stars and which also contains a relatively large number of RSG with Gaia EDR3 parallaxes. We will compare parallax standard deviations of both groups and explore the effect of convection-related surface structures on the photo-center to estimate its impact on the Gaia astrometric measurements.
2 Gaia EDR3 cluster Per data: parallaxes and measurement uncertainty
The nearby young and well-studied cluster Per has a relatively large population of RSGs (Currie et al., 2010, and references therein). Davies & Beasor (2019) have used Gaia DR2 data to determine a distance of d = 2.250.15 kpc. With the improvements obtained by Gaia EDR3 we can now repeat the distance determination and concentrate on a comparison of main sequence stars and RSG parallaxes.
In a first step, we focus on bright main sequence stars with Gaia EDR3 magnitude 10.8 mag and effective wavenumber 1.5 . Following Davies & Beasor (2019) we use Gaia EDR3 proper motions as a criterium for cluster membership. We regard all objects with
| (1) |
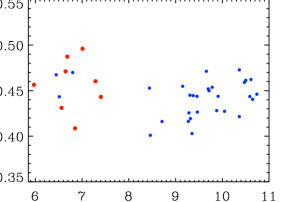
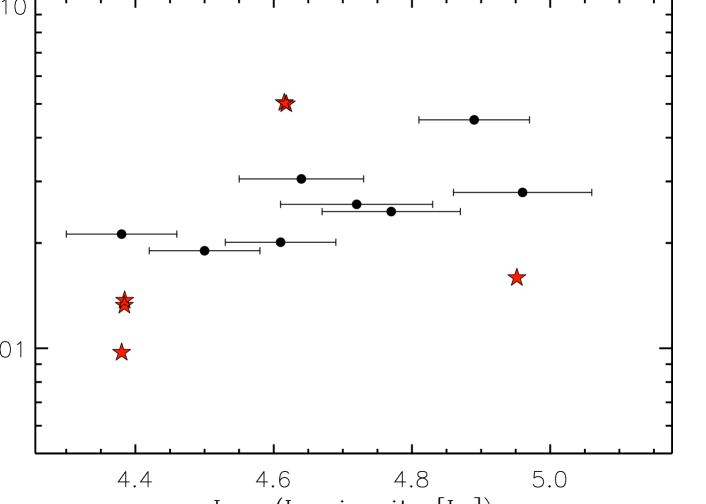
as cluster members. Here, pα and pδ are the Gaia EDR3 proper motions in right ascension and declination, respectively, measured in mas yr-1. p = -0.64 mas yr-1 and p = -1.17 mas yr-1 are the central values for the sample. = 0.303 mas yr-1 and = 0.222 mas yr-1 define the borderline for membership. Fig. 1 shows parallaxes () of the sample selected in this way and their uncertainty (). We note that we have applied a zero-point correction to the parallaxes following Lindegren et al. (2021), see their equations A3, A4, A5 and Table 9. The zero-point correction magnitude dependence is the reason for the restriction to mag of our sample. The data for Fig. 1 are given in Table 2. The mean value of the parallaxes of is = 0.4420.004 mas corresponding to a distance of d = 2.2600.020 kpc.
In the second step we select RSG stars in the Per cluster with proper motions in the same domain as the blue stars selected in previous step. We identify eight objects. Their parallaxes, G-Band magnitudes and luminosities are also given in Table A1. We have also applied the parallax zero point correction to these objects. The luminosities are taken from Davies & Beasor (2018), but have been corrected for the new distance to Per obtained from the blue objects.
We include the RSG in Fig. 1 and find good agreement with respect to parallaxes. The RSG mean value is slightly higher, = 0.4570.010 mas, but agrees within the error margins. However, the measurement uncertainties for the RSG sample are notably higher than those of the blue star sample, even though it can be noted that 6 blue points have also higher values ( mas). These objects may be binary systems with an impact on the parallax measurement and this will be explored in Gaia DR3 release. In the following, we argue that the high uncertainties measurement for the RSG is the result of the photo-center variability induced by RSG dynamics.
|
3 Radiation-hydrodynamics simulations to explain the Gaia measurement uncertainty
We use the RHD code CO5BOLD (Freytag et al., 2012) to compute simulations for RSG stars (Table 1). The code solves the coupled non-linear equations of compressible hydrodynamics and non-local radiative energy transfer in the presence of a fixed external spherically symmetric gravitational field in a three-dimensional cartesian grid. Solar abundances are assumed.
We followed the approach by Chiavassa et al. (2018) and computed intensity maps in the Gaia photometric system (Riello et al., 2021), using the radiative transfer OPTIM3D-code (Chiavassa et al., 2009) for all the snapshots from the RHD simulations. This code takes into account the Doppler shifts caused by the convective motions. The radiative transfer is computed in detail using pre-tabulated extinction coefficients from MARCS stellar atmosphere code (Gustafsson et al., 2008) and for a solar composition (Asplund et al., 2009).
 |
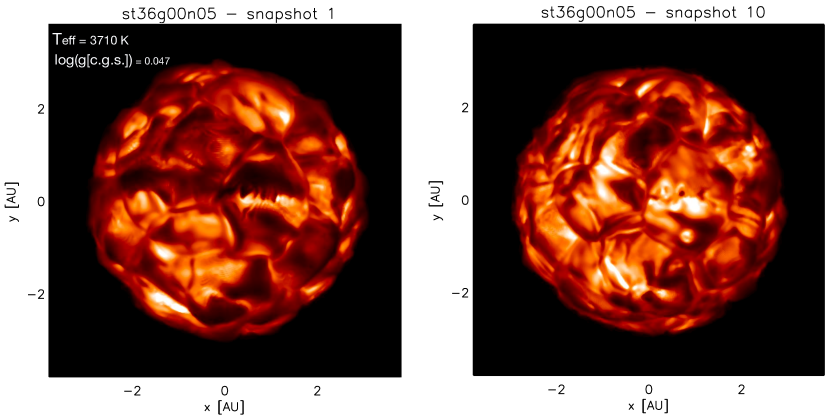 |
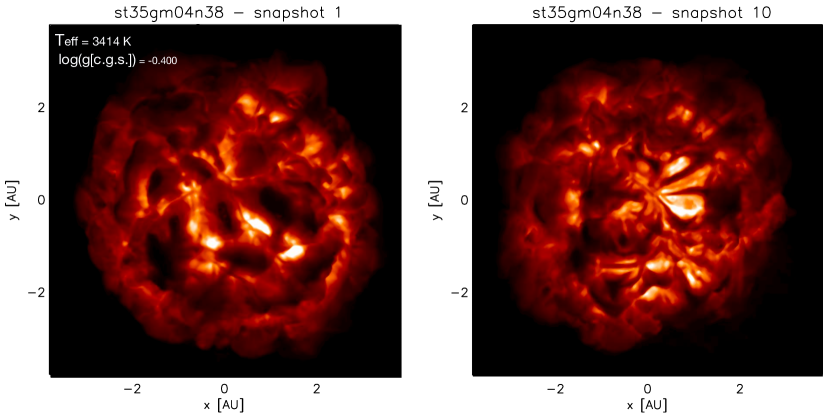
These simulations predict very large variations in velocity, density and temperature that produce strong shocks in their extended photosphere that can cause the gas to levitate and thus contribute to mass-loss (Höfner & Olofsson, 2018; Freytag et al., 2017; Chiavassa et al., 2011a). The stellar surface is characterised by complicated convection-related structures of sizes close to a third of the stellar radii that evolve on several months to years together with short-lived (weeks to months) small scale ones (Freytag et al., 2017; Chiavassa et al., 2011b). The resulting synthetic images in the photometric system are strongly affected by this in terms of intensity distribution (Fig. 2). As a consequence, the position of the photo-center is expected to change as a function of time during Gaia measurements, as already pointed out in Chiavassa et al. (2011b).
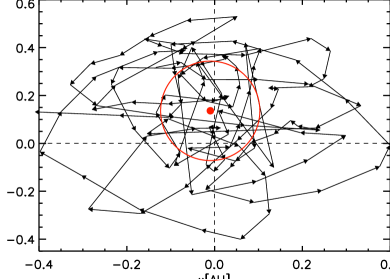
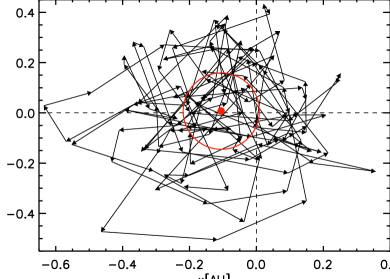
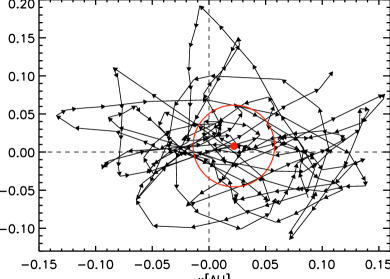
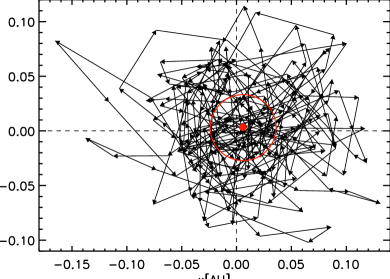
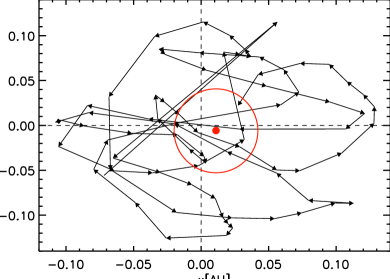
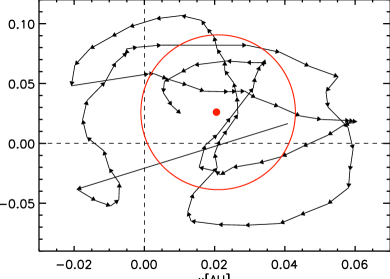
We calculated the position of the photo-center for each map (i.e., as a function of time) as the intensity-weighted mean of the positions of all emitting points tiling the visible stellar surface according to
| (2) | |||
| (3) |
where is the emerging intensity for the grid point with coordinates , of the simulation, and is the total number of grid points in the simulated box. In presence of surface brightness asymmetries the photo-center position will rarely coincide with the barycenter of the star and its position will change as the surface pattern changes with time. This is displayed in the photo-center excursion plots for each simulation in Fig. 4111The related videos are visible here: https://doi.org/10.5281/zenodo.6363011. The averages over time of photo-center position and its standard deviation are overplotted as the central red dot and the red circle, respectively. The coordinates of the red dot, and , are reported in Table 1 together with . and are mostly affected by short time scales corresponding to the small atmospheric structures but they are significant different from zero, revealing that the photo-centers typically do not coincide with the nominal center of the star (dashed lines in Fig. 4) because of the presence of convection-related surface structure evolving with time. On the other hand, varies between 0.033 and 0.130 AU (1 to 5 of the corresponding stellar radius). Moreover, correlate with the stellar surface gravity, that governs the size of granules which, in turn, controls the photometric variations.
| Simulation | |||||||||
|---|---|---|---|---|---|---|---|---|---|
| AU | K | (cgs) | yr | AU | AU | AU | |||
| st35gm04b1n001 | 5 | 4.61 | 2.77 | 3373 | 0.410 | 24.95 | 0.114 | 0.105 | 0.007 |
| st35gm04n38a𝑎aa𝑎aSimulation presented in Chiavassa et al. (2021) and Kravchenko et al. (2019) | 5 | 4.62 | 2.72 | 3414 | 0.400 | 11.45 | 0.113 | 0.010 | 0.136 |
| st35gm03n13b𝑏bb𝑏bSimulation presented in Chiavassa et al. (2011a) | 12 | 4.95 | 3.95 | 3430 | 0.354 | 9.24 | 0.036 | 0.022 | 0.008 |
| st36gm00n06b𝑏bb𝑏bSimulation presented in Chiavassa et al. (2011a) | 6 | 4.38 | 1.82 | 3660 | 0.009 | 7.23 | 0.022 | 0.021 | 0.026 |
| st36gm00n04b𝑏bb𝑏bSimulation presented in Chiavassa et al. (2011a) | 5 | 4.39 | 1.80 | 3663 | 0.023 | 22.92 | 0.030 | 0.006 | 0.003 |
| st36gm00n05b𝑏bb𝑏bSimulation presented in Chiavassa et al. (2011a) | 6 | 4.39 | 1.75 | 3710 | 0.047 | 3.75 | 0.031 | 0.011 | 0.006 |
The table shows the simulation name, the stellar mass ,
the average emitted luminosity , the average approximate
stellar radius , effective temperature ,
and surface gravity , and the time used for
the averaging. The last three columns are the standard deviation
() of the time-averaged values of the photo-center
displacement and its coordinates and .
222
4 Comparison to observations
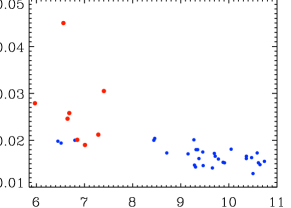
In this section we investigate if the parallax errors excess seen for the RSG stars in Per cluster can be explained by the resulting motion of the stellar photo-center revealed by the RHD simulations. For that, Figure 3 displays the comparison between Gaia parallax uncertainty and the standard deviations of the simulations from Table 1. While none of our simulations has been computed to exactly represent the stellar parameters of the observed stars, the RSGs are within the predictions of the 3D simulations and the general agreement is good. This attests that convection-related variability accounts for a substantial part of the parallax error in Gaia measurements.
One limitation of this analysis is the restriction of the 3D grid in stellar parameters. For a better comparison, one would need extended simulations and observations with known luminosities, masses, and radii and spatially resolved observations to unveil the presence of convection-related surface structures (e.g., Chiavassa et al., 2020). The latter is unfortunately not possible for Per, which is too far in distance, however, the evidence for the effects of photo-center variability is prominent.
Given the fact that can explain Gaia measurement uncertainties of the parallaxes, we suggest that parallax variations from Gaia measurements could be exploited quantitatively using appropriate RHD simulations to extract, in a unique way, the fundamental properties of these RSG stars such as the surface gravity that controls the size of the granules and the photometric variations.
 |
5 Summary and conclusions
We used Gaia EDR3 measurements of parallaxes and proper motions of blue main sequence stars and determined the distance of the Per cluster. The mean value of the parallaxes of is = 0.4420.004 mas corresponding to a distance of d = 2.2600.020 kpc. We then selected a subset of RSG stars, with proper motions in the same domain as the blue stars, and find pronounced evidence that the measured Gaia uncertainty of parallaxes is higher than those of the blue star sample.
With the aim of explaining the high uncertainties, we used the snapshots from a grid of RHD simulations of RSG stars to compute intensity maps in the Gaia photometric system. The synthetic maps show extremely irregular surfaces due to convection-related dynamics. The largest structures evolve on timescales of months/years, while the small ones on timescales of weeks/month. Consequentially, the position of the photo-center is expected to change as a function of time during Gaia measurements. We calculated the standard deviation () of the photo-center excursion for each simulation and found that varies between 0.033 and 0.130 AU (1 to 5 of the corresponding stellar radius) depending on the simulation.
We then compared the measurement of Gaia uncertainty on parallax of the RSG sample to the extracted from the simulations. The general agreement is good. The predictions of the 3D simulations enclose the measured RSG observed uncertainty, albeit these simulations have not been computed to exactly represent the properties of those stars. This suggests that stellar dynamics, quantified through the mean photo-center noise, accounts for a substantial part of the parallax uncertainty for these RSG stars. We suggest that the variation of the uncertainty on Gaia parallax could be exploited quantitatively using appropriate RHD simulations to extract, in a unique way, important information about the stellar dynamics and parameters of RSG stars.
Acknowledgements.
This work is funded by the Deutsche Forschungsgemeinschaft (DFG, German Research Fundation) under Germany’s Excellent Cluster Strategy EXC-2094 390783311. AC acknowledges support from the French National Research Agency (ANR) funded project PEPPER (ANR-20-CE31-0002). BF acknowledges funding from the European Research Council (ERC) under the European Union’s Horizon 2020 research and innovation programme Grant agreement No. 883867, project EXWINGS) and the Swedish Research Council (Vetenskapsrådet, grant number 2019-04059). This work was granted access to the HPC resources of Observatoire de la Côte d’Azur Mésocentre SIGAMM and Swedish National Infrastructure for Computing (SNIC) at UPPMAX.References
- Asplund et al. (2009) Asplund, M., Grevesse, N., Sauval, A. J., & Scott, P. 2009, ARA&A, 47, 481
- Belczynski et al. (2016) Belczynski, K., Holz, D. E., Bulik, T., & O’Shaughnessy, R. 2016, Nature, 534, 512
- Chiavassa et al. (2011a) Chiavassa, A., Freytag, B., Masseron, T., & Plez, B. 2011a, A&A, 535, A22
- Chiavassa et al. (2018) Chiavassa, A., Freytag, B., & Schultheis, M. 2018, A&A, 617, L1
- Chiavassa et al. (2020) Chiavassa, A., Kravchenko, K., Millour, F., et al. 2020, A&A, 640, A23
- Chiavassa et al. (2021) Chiavassa, A., Kravchenko, K., Montargès, M., et al. 2021, arXiv e-prints, arXiv:2112.10695
- Chiavassa et al. (2011b) Chiavassa, A., Pasquato, E., Jorissen, A., et al. 2011b, A&A, 528, A120
- Chiavassa et al. (2009) Chiavassa, A., Plez, B., Josselin, E., & Freytag, B. 2009, A&A, 506, 1351
- Currie et al. (2010) Currie, T., Hernandez, J., Irwin, J., et al. 2010, ApJS, 186, 191
- Davies & Beasor (2018) Davies, B. & Beasor, E. R. 2018, MNRAS, 474, 2116
- Davies & Beasor (2019) Davies, B. & Beasor, E. R. 2019, MNRAS, 486, L10
- Davies et al. (2017) Davies, B., Kudritzki, R.-P., Lardo, C., et al. 2017, ApJ, 847, 112
- Freytag et al. (2017) Freytag, B., Liljegren, S., & Höfner, S. 2017, A&A, 600, A137
- Freytag et al. (2012) Freytag, B., Steffen, M., Ludwig, H. G., et al. 2012, Journal of Computational Physics, 231, 919
- Gaia Collaboration et al. (2021) Gaia Collaboration, Brown, A. G. A., Vallenari, A., et al. 2021, A&A, 649, A1
- Gaia Collaboration et al. (2016) Gaia Collaboration, Prusti, T., de Bruijne, J. H. J., et al. 2016, A&A, 595, A1
- Gazak et al. (2014) Gazak, J. Z., Davies, B., Bastian, N., et al. 2014, ApJ, 787, 142
- Gazak et al. (2015) Gazak, J. Z., Kudritzki, R., Evans, C., et al. 2015, ApJ, 805, 182
- Gustafsson et al. (2008) Gustafsson, B., Edvardsson, B., Eriksson, K., et al. 2008, A&A, 486, 951
- Harper et al. (2008) Harper, G. M., Brown, A., & Guinan, E. F. 2008, AJ, 135, 1430
- Höfner & Olofsson (2018) Höfner, S. & Olofsson, H. 2018, A&A Rev., 26, 1
- Klencki et al. (2021) Klencki, J., Nelemans, G., Istrate, A. G., & Chruslinska, M. 2021, A&A, 645, A54
- Kravchenko et al. (2019) Kravchenko, K., Chiavassa, A., Van Eck, S., et al. 2019, A&A, 632, A28
- Lardo et al. (2015) Lardo, C., Davies, B., Kudritzki, R. P., et al. 2015, ApJ, 812, 160
- Lindegren et al. (2021) Lindegren, L., Bastian, U., Biermann, M., et al. 2021, A&A, 649, A4
- Riello et al. (2021) Riello, M., De Angeli, F., Evans, D. W., et al. 2021, A&A, 649, A3
- van Leeuwen (2007) van Leeuwen, F. 2007, A&A, 474, 653
Appendix A Parallaxes table of the observed stars
| a𝑎aa𝑎aGaia EDR3 (Gaia Collaboration et al. 2021) | a𝑎aa𝑎aGaia EDR3 (Gaia Collaboration et al. 2021) | b𝑏bb𝑏bDavies & Beasor (2018) | Name | |||
|---|---|---|---|---|---|---|
| 0.4564 | 0.0279 | 5.970 | 0.005 | 4.96 | 0.10 | SU Per |
| 0.4311 | 0.0450 | 6.562 | 0.007 | 4.89 | 0.08 | RS Per |
| 0.4711 | 0.0246 | 6.648 | 0.004 | 4.77 | 0.10 | AD Per |
| 0.4873 | 0.0258 | 6.684 | 0.004 | 4.72 | 0.11 | V441 Per |
| 0.4431 | 0.0305 | 7.402 | 0.006 | 4.64 | 0.09 | BU Per |
| 0.4087 | 0.0201 | 6.850 | 0.004 | 4.61 | 0.08 | FZ Per |
| 0.4960 | 0.0190 | 7.010 | 0.003 | 4.50 | 0.08 | V439 Per |
| 0.4603 | 0.0212 | 7.287 | 0.003 | 4.38 | 0.08 | V403 Per |
| 0.4265 | 0.0146 | 9.466 | 0.002 | Cl* NGC 869 W 304 | ||
| 0.4728 | 0.0166 | 10.364 | 0.002 | Cl* NGC 869 W 300 | ||
| 0.4436 | 0.0173 | 10.588 | 0.002 | NSV 776 | ||
| 0.4713 | 0.0141 | 9.658 | 0.002 | Cl* NGC 869 W 288 | ||
| 0.4537 | 0.0160 | 9.782 | 0.003 | BD+56 515 | ||
| 0.4461 | 0.0155 | 10.739 | 0.003 | BD+56 517 | ||
| 0.4256 | 0.0147 | 9.286 | 0.003 | BD+56 518 | ||
| 0.4519 | 0.0172 | 9.698 | 0.003 | BD+56 519 | ||
| 0.4548 | 0.0171 | 9.152 | 0.003 | V* V614 Per | ||
| 0.4528 | 0.0200 | 8.441 | 0.003 | BD+56 521 | ||
| 0.4446 | 0.0161 | 9.378 | 0.005 | BD+56 523 | ||
| 0.4450 | 0.0143 | 9.307 | 0.003 | Cl* NGC 869 HG 1085 | ||
| 0.4281 | 0.0153 | 9.880 | 0.003 | BD+56 526 | ||
| 0.4613 | 0.0129 | 10.502 | 0.003 | BD+56 528 | ||
| 0.4194 | 0.0180 | 9.318 | 0.003 | BD+56 529 | ||
| 0.4438 | 0.0152 | 9.909 | 0.003 | Cl* NGC 869 LAV 1092 | ||
| 0.4215 | 0.0161 | 10.363 | 0.003 | Cl* NGC 869 LAV 1101 | ||
| 0.4405 | 0.0148 | 10.647 | 0.003 | BD+56 533 | ||
| 0.4622 | 0.0152 | 10.614 | 0.003 | HD 14162 | ||
| 0.4433 | 0.0194 | 6.514 | 0.003 | HD 14210 | ||
| 0.4273 | 0.0181 | 10.047 | 0.003 | BD+56 548 | ||
| 0.4010 | 0.0204 | 8.459 | 0.003 | HD 14321 | ||
| 0.4162 | 0.0173 | 8.710 | 0.003 | HD 14357 | ||
| 0.4699 | 0.0200 | 6.800 | 0.003 | BD+56 563 | ||
| 0.4438 | 0.0175 | 9.458 | 0.003 | Cl* NGC 884 W 222 | ||
| 0.4029 | 0.0180 | 9.351 | 0.003 | Gaia DR2 458454640368346624 | ||
| 0.4591 | 0.0163 | 10.472 | 0.005 | Gaia DR2 458406124415716224 | ||
| 0.4163 | 0.0201 | 9.273 | 0.003 | Cl* NGC 884 W 168 | ||
| 0.4674 | 0.0198 | 6.447 | 0.003 | 2MASS J02220081+5707320 | ||
| 0.4499 | 0.0166 | 9.716 | 0.005 | BD+56 571 |
Appendix B Photo-center position for the different RHD simulations
|
|
|