Towards Intersectionality in Machine Learning: Including More Identities, Handling Underrepresentation, and Performing Evaluation
Abstract.
Research in machine learning fairness has historically considered a single binary demographic attribute; however, the reality is of course far more complicated. In this work, we grapple with questions that arise along three stages of the machine learning pipeline when incorporating intersectionality as multiple demographic attributes: (1) which demographic attributes to include as dataset labels, (2) how to handle the progressively smaller size of subgroups during model training, and (3) how to move beyond existing evaluation metrics when benchmarking model fairness for more subgroups. For each question, we provide thorough empirical evaluation on tabular datasets derived from the US Census, and present constructive recommendations for the machine learning community. First, we advocate for supplementing domain knowledge with empirical validation when choosing which demographic attribute labels to train on, while always evaluating on the full set of demographic attributes. Second, we warn against using data imbalance techniques without considering their normative implications and suggest an alternative using the structure in the data. Third, we introduce new evaluation metrics which are more appropriate for the intersectional setting. Overall, we provide substantive suggestions on three necessary (albeit not sufficient!) considerations when incorporating intersectionality into machine learning.
1. Introduction
As machine learning is being adopted in an increasing number of applications, there is a growing awareness and concern that people of different demographic groups may be treated unfairly (Hutchinson and Mitchell, 2018). Measuring and mitigating these effects often require assigning individuals to demographic groups, and this is frequently done along one axis of identity at a time, e.g., gender or race (Friedler et al., 2019). However, when drawing boundaries and selecting demographic groups, it is important to recognize the intersectional harms that result from interacting systems of oppression. Crenshaw (1989) first coined the term “intersectionality” by showing that Black women experience discrimination beyond being either Black or women. Intersectionality broadly refers to how different identities along different axes interact to produce unique forms of discrimination and societal effects (Collins and Bilge, 2020; Carastathis, 2008; Crenshaw, 1989).111There are complex nuances to this conceptualization that are out of scope of this work (Nash, 2008). There is a long history of considering intersectional harms in fields outside of computer science (Collective, 1977; King, 1988; bell hooks, 1981; Spelman, 1988; Collins, 1990; McCall, 2005; Nash, 2008; Shields, 2008; Collins and Bilge, 2020; Makkonen, 2002; Grillo, 1995), and an urgent need to do so in machine learning fairness as well. For example, Kearns et al. (2018a) perform experiments that show the algorithmic harms intersectional subgroups may experience due to heterogeneity within a particular demographic group, e.g., Female. In other words, although a classifier may be fair with respect to gender, as well as race, it can be unfair with respect to the intersection of the groups, missing that, for example, Black Female and White Female may differ in substantial and meaningful ways (Kasy and Abebe, 2021).
In this work, we focus on the algorithmic effects of discrimination against demographic subgroups (rather than individuals). Specifically, we conduct empirical studies of five fairness algorithms (Jiang and Nachum, 2020; Kearns et al., 2018b; Agarwal et al., 2018; Foulds et al., 2018; Yang et al., 2020) across a suite of five tabular datasets derived from the US Census with target variables like income and travel time to work (Ding et al., 2021). We do so under the framework of the canonical machine learning fairness setting: supervised binary classification of a target label of social importance, which balances accuracy and one mathematical notion of fairness among a finite set of discretely defined demographic groups, which may result from a conjunction of identities.222We acknowledge that the group identity delineations themselves are unstable and fraught with problems of operationalization (McCall, 2005; Hirschman et al., 2000).
We echo the calls of prior work to consider multiple axes of identities (Kearns et al., 2018a; Foulds et al., 2018), but in this work, focus on the next steps after someone has decided to consider intersectionality in their machine learning pipeline. In doing so, three core challenges emerge. First, in the dataset stage, we need to select which identity labels to consider. This is difficult because considering too many would be computationally intractable but considering too few may miss intersectional harms. Second, in the model training stage, we need to consider how to technically handle the progressively smaller number of individuals in each group that will result from adding additional identities and axes. Finally, in the evaluation stage, we need to decide how we will perform fairness evaluation as the number of groups increases. There are seemingly straightforward ways to address each of these three questions. For example, one might consider as many axes of identity as they have access to in the data; handle smaller groups by drawing from machine learning techniques for imbalanced data such as generating synthetic examples of underrepresented groups (Ramaswamy et al., 2021; Sattigeri et al., 2019; Sharmanska et al., 2020); and evaluate on more subgroups by generalizing existing fairness definitions, such as equal opportunity or demographic parity, through extrapolation (Foulds et al., 2018; Kearns et al., 2018b). However, by treating intersectionality as simply an extension of the binary group setting to a multi-group one, these straightforward approaches fail to critically engage with the substantive differences that intersectionality brings.
Our contributions in this work are in meaningfully engaging with these three problems that arise along different stages of the machine learning pipeline: dataset selection, model training, and model evaluation. These come after the decision to consider intersectionality, and our concrete suggestions are as follows:
-
(1)
Selecting which identities to include (Sec. 4): due to the tenuous nature of operationalizing demographic categories we will need to supplement domain knowledge with empirical results in order to understand which identities to include in model training. This applies not only to multiple axes, but also individual axes. For example, when considering the racial group Asian Pacific Islander, there are many potential granularities of identities to include, such as breaking the group up into its constituent ones of Hmong, Cambodian, etc. We show that, in a way that is hard to know a priori, different algorithms benefit from training on different levels of granularity. However, evaluation should generally be performed on as many demographic groups as are known.333There are concerns regarding noisy measurements of small groups that are out of scope for our work; we refer the reader to Foulds et al. (2019).
-
(2)
Handling progressively smaller groups (Sec. 5): the more identities we consider, the smaller each group is likely to be. Normative concerns unrelated to the technical efficacy of data imbalance techniques can be enough to constrain or even disqualify their use; for example, harmful historical parallels connected to generating synthetic facial images can raise concerns. We suggest a new path, hypothesizing that structure within intersectional data can be carefully exploited in very specific circumstances, such as by learning about statistical patterns in an underrepresented Black Female group from groups it might share characteristics with, like Black Male.
-
(3)
Evaluating a large number of groups (Sec. 6): commonly used pairwise comparisons for fairness evaluation can obscure important information when extrapolated and applied to a greater number of subgroups. This precipitates a call for additional kinds of evaluation that measure considerations such as the reification of existing hierarchies amongst subgroups. For the algorithms and datasets we consider, we demonstrate that the ranking amongst subgroups for positive label base rates of the dataset is highly correlated with the rankings of true positive rates of the model predictions, even when training with fairness constraints.
These considerations are not unique to intersectionality, as they are liable to arise in any multi-attribute setting, but considering intersectionality sharply precipitates their importance. We also note that despite the language we employ, we do not suggest that fairness can be treated as a purely algorithmic problem that neglects the sociotechnical frame (Green and Hu, 2018; Birhane, 2021; Green and Viljoen, 2020; Selbst et al., 2019). Like the limitation noted by recent work (Ding et al., 2021), our contributions are limited to the realm of intersectional algorithmic fairness, and not data-driven insights into societal intersectionality. Intersectionality is frequently considered through qualitative rather than quantitative approaches (Atewologun, 2018) because of the flattening effect the latter has in treating groups as a monolith, so to an extent, quantitative studies will always be limited in this aspect.
2. Related Work
The canonical machine learning fairness paradigm frequently assumes binary attributes along a single axis (Friedler et al., 2019). For example, for the many algorithms that only work in this contrived setup, IBM’s AI Fairness 360 tool (Bellamy et al., 2018) formulates the binary attribute as White and Non-White, a trend sometimes shared by the social sciences that may conceptualize of social categories as dichotomous, e.g., class as middle-class and poor, gender as men and women, and sexuality as heterosexual and homosexual (de Vries, 2014). To get a high-level look at how prevalent the problem of not considering intersectionality is, we look at a set of 26 popular machine learning fairness algorithm papers.444We use Semantic Scholar to keyword search for “fair”, “fairness”, and “bias” from 9 conferences: NeurIPS, ICML, ICLR, FAccT, CVPR, ECCV, ICCV, ACL, EMNLP. We retained all papers with 75 or more citations, and of these 58 papers, further narrowed down to the 26 that proposed fairness algorithms. Of these 26, only 16 can operate in a setting beyond binary attributes, and of those, only 7 report empirical results on multiple axes of identity.
Algorithmic fairness methods have begun to consider intersectional attributes beyond just one axis of identity (Tan and Celis, 2019; Ángel Alexander Cabrera et al., 2019; Steed and Caliskan, 2021; Kirk et al., 2021). Kearns et al. (2018b) and Yang et al. (2020) offer learning methods for intersectional fairness, but weigh the fairness of each group by their frequency and thus downweigh underrepresented groups, which arguably should be the focus of intersectional fairness. Hebert-Johnson et al. (2018) learn a predictor for numerous overlapping demographic subgroups with a focus on calibration, and Foulds et al. (2018) propose an intersectional fairness regularizer that targets statistical parity. Morina et al. (2019) propose a post-processing approach that generalizes that of Hardt et al. (2016), and Kim et al. (2019) similarly propose a post-processing approach as well as auditing procedure. Friedler et al. (2019) compare existing fairness methods, and consider intersectional sensitive attributes by encoding one axis of identity as race-sex.555One way of incorporating intersectional identities is by encoding them as, e.g., race-sex, such that {Black, White} {Female, Male} can be considered as a single axis of identity with four values of {Black Female, Black Male, White Female, White Male}.
Perhaps the most well-known of these works (Kearns et al., 2018b; Hebert-Johnson et al., 2018) never use the word “intersectionality”, instead opting for the terms “fairness gerrymandering” and “computationally-identifiable masses.” Both works make important and impressive technical progress in generalizing algorithms for the intersectional setting, but by not explicitly naming “intersectionality”, do not invoke the history, context, and literature that it brings.
3. Setup
Throughout our work, we provide experiments and empirical results to substantiate the claims we make. In this section, we give an overview of the datasets, training objective, and algorithms that we perform such studies on. When faced with a choice to make about our experimental setup, e.g., which fairness metric to optimize for, we simplistically opt for the most straightforward choice that is most aligned with prior work in the space. This is because the goal of our work is not for exhaustivity in showing these issues will arise in every fairness setting, but rather, that they do manifest in a generically adapted fairness setting with common algorithms trained on actual datasets.666Code is located at https://github.com/princetonvisualai/intersectionality
Datasets: We use the newly proposed tabular datasets derived from US Census data by Ding et al. (2021). We do this because of both the reasons delineated by Ding et al. (2021), such as the community’s over-reliance on the Adult Income dataset (Dua and Graff, 2017), and also the richer data features available to us. For each dataset, we are able to query for additional demographic features for each individual, such as marital status and granular race labels, as needed.
We use the five datasets offered by the paper: ACSIncome, ACSPublicCoverage, ACSMobility, ACSEmployment, and ACSTravelTime. We pick the California 2018 slice of these datasets to strike a balance between a computationally feasible size, and also having sufficient data points. This choice is somewhat arbitrary because, as we noted, we are not trying to make any data-driven societal insights, but merely demonstrate that particular phenomena may manifest in algorithms trained on actual datasets. We assume the positive label of each dataset is the desirable one, even though this is not always clear, e.g., the positive label in ACSTravelTime corresponds to an individual traveling more than 20 minutes to get to work. However, we could conceive of a perhaps contrived setting in which getting predicted to have a longer travel time entails receiving some kind of travel stipend. Again, for the same reason as our selection of data slice, we do not place much weight into what would, in an application-based design, typically be very value-laden choices.
For all of our experiments, we perform five trials of each run, using random seeds and different training/validation/test splits for each, as recommended by Friedler et al. (2019), to give 95% confidence intervals.
Training Objective: We train all algorithms to achieve a balance between measures of accuracy and group fairness.
Our measure of accuracy is soft accuracy. Prior works have shown fairness metrics to be extremely sensitive to the classification threshold used (Chen and Wu, 2020); hence we do not binarize the outputs, acknowledging that binarization may need to be done at application time to make direct predictions. For all individuals, let be the label for individual , and be the probabilistic prediction for individual . Soft accuracy is defined to be .
Picking a fairness metric is highly non-trivial, as context about the downstream effects of the algorithm is needed. However, for the scope of our work since we consider the positive labels to be more desirable, we choose a metric analogous to equal opportunity (Hardt et al., 2016), i.e., equalizing the true positive rate (TPR).777We focus on equal opportunity, but our flavor of analysis applies to other algorithmic fairness notions, such as demographic parity, equalized odds, etc. Our measure of fairness is thus max TPR difference. To generalize the equal opportunity measure to more than two groups, we adopt a method similar to prior work (Foulds et al., 2018; Kearns et al., 2018b; Yang et al., 2020). If we define to be the average for all individuals of group with label , then our measure is the maximum pairwise difference between any two groups. Most proposed fairness algorithms are able to optimize for this metric, and we are trying to capture the canonical way the community has been targeting intersectionality. We will go on to investigate the sufficiency of metrics like this in Sec. 6, and propose constructive suggestions there.
For hyperparameter tuning we optimize for the geometric mean of soft accuracy and (1 - max TPR difference) to account for values with different scales.
Algorithms: Our experiments are performed on one baseline and five fairness algorithms. Our baseline is a 3 layer fully connected neural network with 30 neurons in each hidden layer and a sigmoid activation trained to predict from an individual’s features and demographic attributes. The first two fairness algorithms are general ones we extend to the intersectional setting by coding attributes as, e.g., race-sex: RWT (Jiang and Nachum, 2020) is a reweighting schema and RDC (Agarwal et al., 2018) reduces to a sequence of cost-sensitive classifications. The latter three are intersectional methods: LOS (Foulds et al., 2018) has an extra intersectional fairness loss term, GRP (Yang et al., 2020) is a probabilistic combination of models, and GRY (Kearns et al., 2018b, a) produces cost-sensitive classifications from a 2-player zero-sum game. Details and hyperparameter search spaces are in Appendix A.
4. Selecting which identities to include
The first of three core challenges in incorporating intersectionality that we address in this work is considering which identities to include (Mitchell et al., 2021).888We take as a given that identities should be included during training, i.e., fairness through awareness (Dwork et al., 2012; Dwork et al., 2018). The foundation of this problem is that categorizing people into discrete, socially constructed groups, while tenuous, is often necessary for machine learning systems to make sense of socially relevant distinctions (Edlagan and Vaghul, 2016; Hanna et al., 2020; Jacobs and Wallach, 2021). However, this flattening of individuals is often at the expense of ignoring different amounts of heterogeneity within each group. Homogeneity here would entail that each member of a group is best treated identically to all other members of that group by a machine learning model; heterogeneity involves a break from this assumption.999Because we have scoped our work to be on algorithmic harms, our investigation will be focused on heterogeneity’s role in the context of model predictions. Thus, we will not perform what might be considered a more model-agnostic approach of unsupervised learning on the dataset itself. In other words, one conception of a heterogeneous group is when, within that group, “statistical patterns that apply to the majority might be invalid within a minority [sub]group” (Hardt, 2014). While heterogeneity will exist in any categorization of people, our focus is on the differing amounts of within-group heterogeneity that exists across groups. A variety of machine learning approaches overlook this fact by assuming a version of constant within-group heterogeneity, whether that be through known variances across groups for a variational Bayesian approach to one-shot learning (Fei-Fei et al., 2003), or the homoscedasticity assumption (i.e., that all groups have the same variance) for methods like linear regression and linear discriminant analysis. Violations of the homoscedasticity assumption are well-studied by statistical tests (Glass et al., 1972; Lix et al., 1996), but less understood in the context of training machine learning models.101010Differing heterogeneity is related to “second moment” statistical discrimination in economics: marginalized groups, for structural reasons like not being given sufficient opportunity to demonstrate ability, have a higher perceived variance and are discriminated against by risk-averse employers (Aigner and Cain, 1977; England, 1992; Dickinson and Oaxaca, 2009).
The solution is not as trivial as simply adding in as many axes and granular identities as we have access to, which is also what often leads to outcries of how intersectionality might take us to the extreme of sub-dividing until each group is an individual person. To demonstrate how we should consider which identities to include, we perform representative case studies on two racial groups. In Sec. 4.1 we investigate the granularity of constituent identities within Asian Pacific Islander to include as labels (e.g., Hmong, Japanese, Cambodian, Asian Indian) in order to empirically explore the tension between adding more identities and reaching a point of intractability because there are too many groups. In Sec. 4.2 we look into another heterogeneous racial group, Other, because how we go about including this category remains an important and relevant consideration so long as we are utilizing discrete categories.
One might ask why our case studies look into multiple groups within the same axis, rather than along different ones. Different levels of heterogeneity within groups often come about due to additional axes of identity that are unaccounted for, e.g., gender differences within a racial group. However, we argue that heterogeneity along the same axis is also relevant, and an investigation of this will help us understand how to handle the intersectional case. We note that while socially the concepts of heterogeneity either due to additional axes or along the same axis are very different, technically they may warrant similar approaches. When along the same axis, the groups with higher heterogeneity are sometimes those that have been unified not because they share a particular trait, but rather because they share a hardship that has motivated them to pursue change as a more unified group, e.g., coalitional identities like Disability (Adams et al., 2015; Whittaker et al., 2019). Another group likely to have high heterogeneity is Other, the residual group that comes with discrete categories. For example, if gender categories are Male, Female, and Other, this latter group may encompass people who identify as non-binary, intersex, and other gender identities that may differ greatly from each other.
4.1. Case study: heterogeneity within Asian Pacific Islander
To investigate the granularity of identities to include, we consider “Asian Pacific Islander”, or API. This racial grouping came about in the late 1960s, inspired by the Black Civil Rights Movement, as part of an initiative to unify disparate groups (on Gender-Based Violence, [n. d.]). This aggregate category was on the US Census in 1990 and 2000, though a 1997 mandate separated it into “Asian” and “Native Hawaiian and Other Pacific Islander.” However, these two groups are frequently still clustered together, despite the very different forms of discrimination and stereotyping that each faces.
To understand the difference that label granularity of API makes, we perform a series of experiments where each algorithm is provided the same set of data, but with demographic features, , along three different sets of granularity: “Asian” and “Native Hawaiian and Other Pacific Islander” are considered one aggregate group (1 group), “Asian” and “Native Hawaiian and Other Pacific Islander” are separated (2 groups), each group is further broken down into even more granular labels, such as Hmong, Cambodian, Asian Indian, etc (¿ 10 groups). We preprocess the datasets to only include individuals with racial groups White, Black, and the granular groups within API with at least 300 individuals, 30 negative labels, and 30 positive labels. This is so as to not add too many variables for this particular case study.
On the two datasets of ACSIncome and ACSTravelTime, we train and perform inference for each of our algorithms under the three granularity scenarios. We use as our evaluation metric the max TPR difference, and always measure this between the most granular constituent groups we have, i.e., the scenario with ¿ 10 groups. In other words, an algorithm considering API to be one aggregate group would be trained with these labels, and perform predictions with them. However, when evaluating in this setting, the more granular labels of ¿ 10 groups are used.
Intuitively, one might posit that it is always best to use the most granular labels of ¿ 10 groups when training, since these are the labels for which evaluation will be performed. However, that intuition breaks down when we consider empirical results in Fig. 1. Across both datasets for each algorithm, it is not always the case that training with the most granular labels results in the lowest max TPR difference for these very same groups. In fact, in the ACSTravelTime dataset, we actually see that GRY outperforms all other algorithms with a max TPR difference of when it considers API at the granularity of 2 groups. Possible reasons include that models may overfit when groups are small, or that for some datasets, certain groups are sufficiently homogeneous that they benefit from being treated as the same. It is not always clear a priori which grouping is best for training, and this will require a combination of contextual understanding of the historical and societal reason behind the groupings in a particular domain as well as empirical validation to understand what works best in a particular setting. While in this case study our experimental scenarios were different granularities along a singular axis of identity, similar experiments can be performed where each scenario is the inclusion of a different combination of axes of identity.
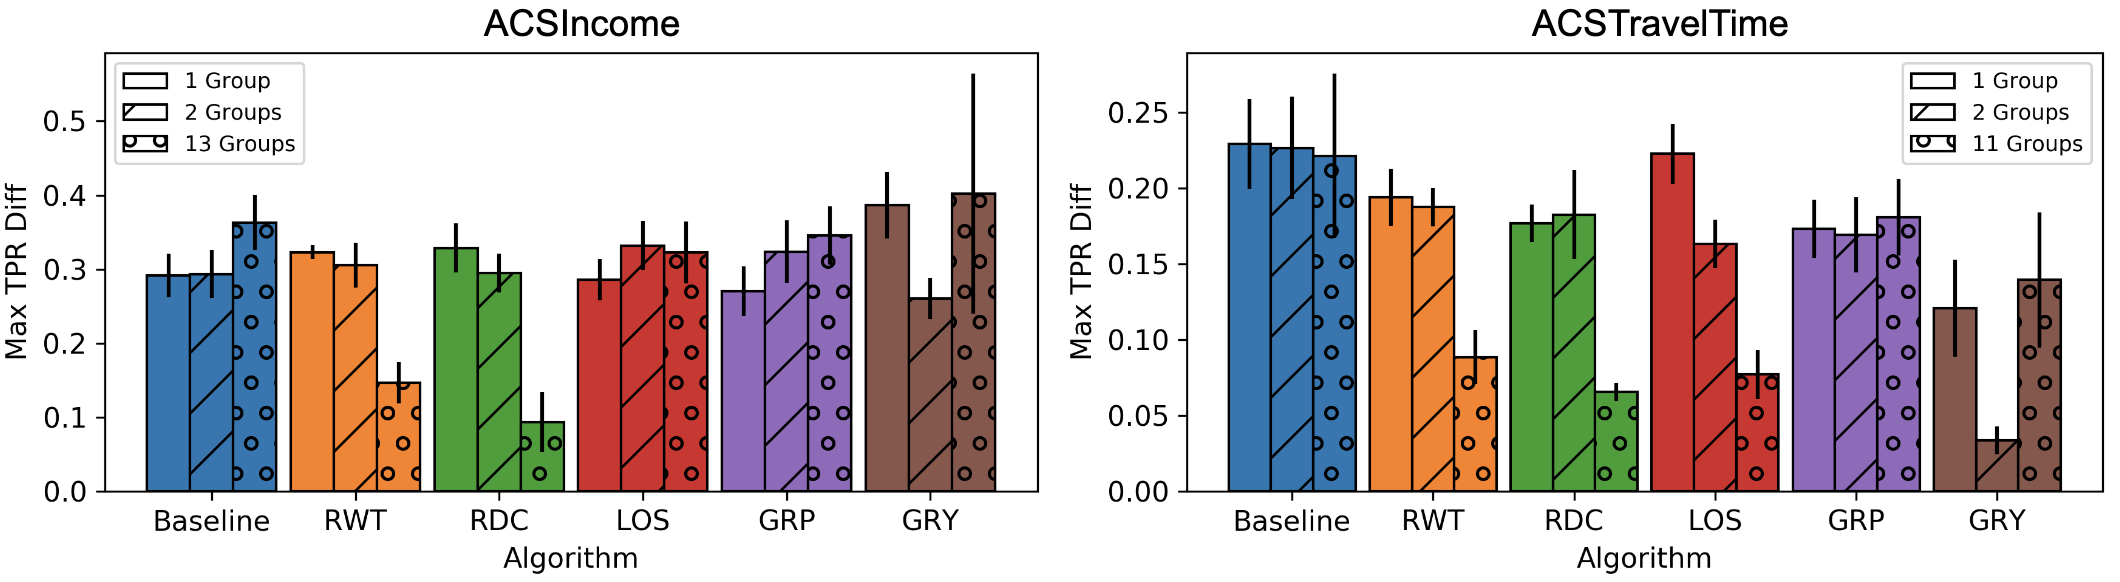
Two graphs with the same setup on two different dataests of ACSIncome and ACSTravelTime. X-axis has six algorithms: Baseline, RWT, RDC, LOS, GRP, and GRY. Y-axis is the max TPR difference. Results are shown for each algorithm on 1 group, 2 groups, and more than 10 groups. Both graphs show conflicting results in terms of which granularity of group results in the most fair algorithm.
4.2. Case study: heterogeneity within Other
Considering how to handle the individuals that fall outside the delineated identities is an important consequence that comes with expanding beyond binary attributes or single axes of identity. For example, multi-racial and non-binary individuals are often forced to pick a category that does not apply to them, or simply choose the catch-all Other, both of which have associated harms (Hamidi et al., 2018; McLemore, 2015; Ansara, 2012; Scheuerman et al., 2021; Bowker and Star, 2000; Scheuerman et al., 2019). The Other racial category appeared in the US Census in 1910, and in 2010 was the third-largest racial category (Ashok, 2016). Given that this group is defined by not belonging to any of the named racial groups, we might wonder if there is a larger amount of heterogeneity amongst the people who check this box. However, for race specifically, prior work has found that Other is not simply a leftover residual group, but rather a “socially real phenomenon” (Brown et al., 2007). For example, Brown et al. (2007) found that in the 2000 United States census, the Other racial group became a proxy for Hispanic people, where 97% of people who checked “Other” for race also checked “Hispanic” for origin. Drawing from this, one might imagine that when training a model on a dataset exhibiting this characteristic, it could make sense to treat Other as its own group, or split up Other into those that are Hispanic or not.
In the quantitative social sciences, there are three common ways in which racial groups like Other and Multiracial are approached: treating it as its own group (Separate), redistributing each individual to another group they are similar to (Liebler and Halpern-Manners, 2008) (Redistribute), or simply ignoring this group (Frohard-Dourlent et al., 2016) (Ignore). We empirically test these three approaches to understand the different accuracies they result in for the Other group. To implement Redistribute, we simplistically pick a strategy of re-assigning each individual in Other to the racial group of its nearest L2 distance neighbor in the feature space. While results from this method of redistribution may not generalize to other methods, we show this as one demonstrative example. The reason we might believe this strategy could be helpful is if individuals in the Other group have distributions such that being grouped with another group would lead to more accurate predictions.
Similar to the case study on API, we train our model across three different scenarios while keeping the evaluation consistent. In Fig. 2 we see that for ACSEmployment, the Separate scenario of treating Other as its own distinct group does frequently perform best—not necessarily unexpected given our prior domain knowledge. However, in Fig. 2 for ACSIncome it is no longer always the case that treating Other as its own group performs better, e.g., Redistribute outperforms Separate for the RWT and RDC algorithms. This furthers our finding that contextual knowledge, e.g., about Other sometimes being a racial group in its own right, is not entirely sufficient in helping us know a priori how best to handle a group.
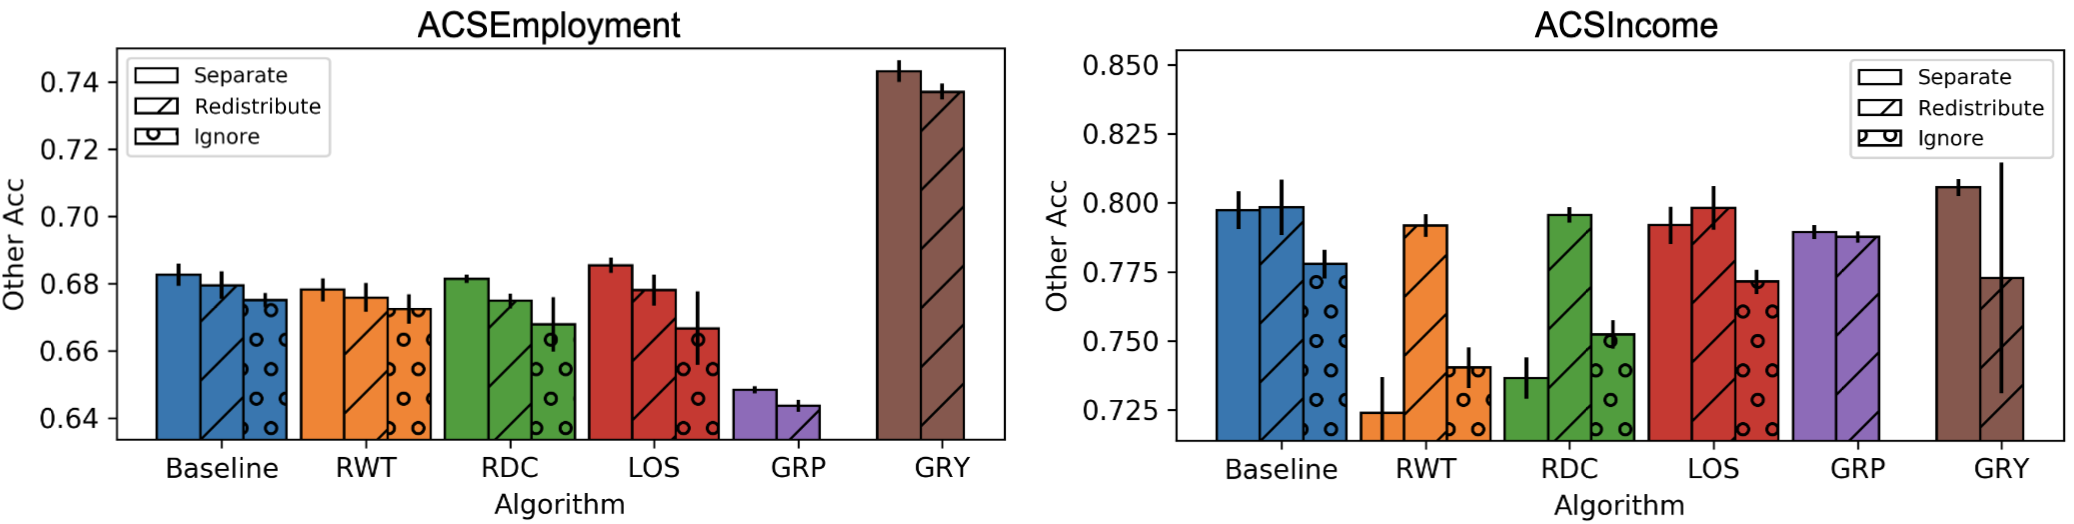
Two graphs with the same setup on two different datasets of ACSEmployment and ACSIncome. X-axis has six algorithms: Baseline, RWT, RDC, LOS, GRP, and GRY. Y-axis has the AUC for the Other racial group. Results are shown for each algorithm on Separate, Redistribute, and Ignore. Left graph for ACSEmployment shows Separate to be the best condition for most algorithms. Right graph for ACSIncome shows different conditions to perform well, such as Redistribute over Separate for RWT and RDC.
4.3. Constructive Suggestions
Overall, our case studies show it is rarely clear a priori which identities should be included due to differences in performance on even the same task across algorithms. Ultimately, it will take a combination of contextual understanding of the application and empirical experiments to make the decision on what works best for a particular application. When Crenshaw (1989) first introduced intersectionality, she was considering it in the context of how race discrimination law and sex discrimination law failed to capture the discrimination experienced by Black women. Thus, the relevant axes for her to consider were race (Black and White) and sex (Female and Male). Guided by this kind of contextual knowledge, practitioners can incorporate empirical findings to select the relevant set of identities to include.
When training predictive models, including all available identity labels may not always be best. Computational tractability comes into play, as do similarities and differences between groups. For example, if group A and B have similar distributions, but group B has a small number of labels, it may benefit this group to join with group A, lest there not be sufficient samples to train a predictive model. The exception is for post-processing approaches, where it may be more likely to be beneficial to include more identities. This is because these approaches generally involve learning only one or two group-specific parameters, e.g., classification threshold or probability of flipping a binary prediction (Hardt et al., 2016; Pleiss et al., 2017; Kamiran et al., 2012), and are thus less susceptible to overfitting.
Another suggestion regarding which identities to include is on how to handle the individuals that fall outside the delineated identities. Experiments guided by contextual knowledge show us how to proceed. However, we advise extreme caution when considering any kind of recategorization due to serious normative implications. Benthall and Haynes (2019) proposed using unsupervised clustering to discover “race-like” categories, and Hanna et al. (2020) levied a critique against such a mechanism. Use of unsupervised recategorization without human oversight can lead to inherently harmful actions, such as recategorizing someone who identifies as Non-Binary to a gendered grouping they do not belong to. However, supplementing recategorization with domain expertise, such as with the Other racial group, may be considered more permissible. As another option, Hancock (2007) has proposed fuzzy set theory to better capture the categorization of people into socially constructed categories, and Mary et al. (2019) provides technical guidance on this.
In contrast, for evaluation, one should generally perform analyses at the most fine-grained level possible. In fact, in many cases if a dataset does not contain sufficient axes or identities according to a domain expert’s understanding of the kinds of intersectional power dynamics that may be at play, one should consider collecting more demographic labels, keeping privacy concerns in mind (Jo and Gebru, 2020). For smaller groups where one might argue evaluations would be noisy (Foulds et al., 2019), error bars could convey uncertainty, and evaluations on the larger group could also be included.
5. Handling progressively smaller groups
Now that we have discussed which identities to include, we consider the next inevitable challenge that comes with incorporating more identities: the presence of ever smaller numbers of individuals in each group. Machine learning has long tackled such long tail problems, but there are a few critical distinctions. One notable technical one is the long tail that machine learning concerns itself with is typically in the label, whereas in intersectionality it is within the label. In other words, it is not that there are too few examples of chairs, but rather a small set of the many chairs are wooden and look different from the others. Although this difference is important to keep in mind, it is rather the normative distinctions we will discuss that may impact the transferrability of existing data imbalance techniques to tasks with intersectionality concerns. However, this also gives rise to a possible new, underexplored approach that leverages the structure of intersectional data. We first walk through a set of traditional dataset imbalance techniques in machine learning in Sec. 5.1, and then present the kind of structure that may provide such a new avenue in Sec. 5.2.
5.1. Dataset imbalance techniques in machine learning
A common machine learning technique for dealing with imbalanced classes is simply reweighting or resampling (Kubat and Matwin, 1997; Japkowicz, 2000). These entail simply increasing the attention paid to individuals of a particular group. Reweighting can also be done in an adaptive and learned way (Ren et al., 2018; Jiang and Nachum, 2020). This might pose a normative problem because now we leave up to the model’s learning parameters which individuals will be over- or under-valued.
Further techniques to tackle class imbalance move from changing the importance of existing training samples to generating new synthetic examples. Techniques like SMOTE (Chawla et al., 2011) generate synthetic examples in the feature space, and there is no immediately clear intuition on the normative concern of injecting this kind of directed noise to an abstract space of features. There is also a vast literature discussing counterfactuals, a type of synthetic example steeped in causality, and which have long been used to detect forms of discrimination (Chiappa and Isaac, 2019; Li et al., 2017). Their permissibility of use, however, for addressing class imbalance has been contested because of the infeasibility of manipulating demographic categories (Holland, 2008; Sen and Wasow, 2016; Kasirzadeh and Smart, 2021) and inaccurate conceptualizations of causality of demographic categories (Kohler-Hausmann, 2019; Hu and Kohler-Hausmann, 2020).
When we move from the data space of abstract features to one like images of faces, manipulations often feel viscerally wrong, e.g., Figure 1 of (Yucer et al., 2020). Recent work has proposed leveraging Generative Adversarial Networks (GANs) to create synthetic examples to help train models, especially for facial datasets (Ramaswamy et al., 2021; Sattigeri et al., 2019; Sharmanska et al., 2020),111111We leave out of scope the concerns with facial recognition itself, pointing to works like (Stark, 2019; Goldenfein, 2019; Petty, 2020) but some of these visual results can feel akin to the harmful performance of blackface. This poses a set of questions, such as if such generations were to actually help train a model, and at the cost of less privacy concerns that might result from seeking to explicitly, and perhaps exploitatively, collect more data of underrepresented groups, is there anything to be gained from it? If we consider the normative concern to be the harmful visibility of these images because of their historical context, might we consider the generation of these images permissible, so long as they are only to be consumed by a machine learning model? These remain open questions.
One field in which synthetic examples are being widely adopted, and where results are relatively accepted as indicative of real-world gains largely due to work on transfer learning (e.g., Sim2Real (Höfer et al., 2020)), is reinforcement learning for robotics (Kober et al., 2013). Simulation can often provide a safer alternative to training in the real world, and serve as a source for more data. However, because the data needs of certain fairness applications, like in tabular domains, are lower than that of reinforcement learning applications, which may use image data, the use of simulation for fairness applications may better serve a different purpose. For example, modeled after OpenAI’s Gym (Brockman et al., 2016) (a simulation testbed for reinforcement learning), FairGym has been proposed to explore long-term impacts of fairness problems (D’Amour et al., 2020). Thus, like Schelling (1971) did to study segregation, the purpose of simulations for problems with intersectional concerns may be more akin to that of simulations as testbeds and tools for understanding sociotechical systems such as in modeling recommender systems (Chaney et al., 2018; Lucherini et al., 2021; Ciampaglia et al., 2018; Geschke et al., 2018; Jiang et al., 2019) and online information diffusion (Garimella et al., 2017; Goel et al., 2016; Törnberg, 2018), rather than as a source for more data.
5.2. Structure in data
One avenue that exists in intersectionality for handling progressively smaller subgroups is leveraging the structure of the dataset. Drawing on our previous notion of homo- and heterogeneity, we consider that when two different groups are similar, there may be predictive patterns we can learn about one from the other. We deviate slightly from our previous notion by ignoring changes in base rate to focus only on changes in the mapping of the input distribution to output distribution.121212We ignore base rate differences because these are easier to account for using post-processing approaches that learn a minimal number of parameters. Thus, in this section, we use ROC AUC as our evaluation metric because it is base rate agnostic, allowing us to focus on what we call “predictivity” differences. One major concern that the methods in the previous Sec. 5.1 aimed to address is that underrepresentation can be a problem if the minority group is differently predictive from the majority group (Larrazabal et al., 2020), but does not contain sufficient samples to train a robust model on. Structure in the data has the potential to help us alleviate this concern if we can learn something about the predictivity of an underrepresented group, e.g., Black Female, from groups with more representation in the dataset and a shared identity, e.g., Black Male who share the attribute of Black. It remains important of course to consider how the context might impact the structure available to draw from. For example, Gay Female and Gay Male may not share predictivity, despite sharing the attribute of Gay (de Monteflores and Schultz, 1978; Herek, 2002).
Two kinds of predictivity difference are of relevance to us: between subgroups (i.e., each subgroup is differently predictive from each other) and an additional intersectional effect (i.e., the predictivity of one group cannot be learned from groups with which it shares identities). The presence of subgroup predictivity differences tells us we should be concerned with underrepresentation, and a lack of intersectional predictivity differences tells us we may be able to leverage structure in the data to alleviate this. We will perform two experiments, each aiming to discover one type of predictivity difference.
We study three datasets: ACSIncome, ACSMobility, and ACSTravelTime to understand the types of predictivity difference present in each. We consider the demographic attributes {Black, White} {Female, Male}. We focus on the group Black Female to center their experience, and because this group is the most underrepresented across these datasets and thus more likely to face underrepresentation. We perform these experiments using the Baseline model.
We first investigate subgroup predictivity differences. To do so, we train only on individuals from one of the four groups at a time, controlling for the number of training samples to be constant, and test on Black Female. For example, by comparing the AUC of Black Female when trained on samples of White Female as compared to when trained on samples of Black Female, we can understand whether there is a predictivity difference between the two. Our results across the three datasets are in Tbl. 1, where we can see that while for ACSIncome the model is able to achieve roughly the same AUC on Black Female no matter the group it was trained on, for ACSPublicCoverage and ACSTravelTime, Black Female has the highest AUC when a model is trained on members from the same group, rather than a different group. This indicates that in these two datasets, Black Female is differently predictive from other groups such that any model without sufficient samples of Black Female may not perform as well, and thus an underrepresentation of Black Female training samples may be of concern. This is not true in ACSIncome, since an underrepresented group like Black Female shares predictivity with other groups for which there are sufficient training samples.
| Dataset | Black Female | White Female | Black Male | White Male |
|---|---|---|---|---|
| ACSIncome | ||||
| ACSPublicCoverage | 741 | |||
| ACSTravelTime | 672 |
We are now faced with the finding that in ACSPublicCoverage and ACSTravelTime, the group Black Female is differently predictive such that a model trained without sufficient examples of this group will not perform as well. To address this concern, we can consider the known structure in intersectional data that can be leveraged. In other words, there may be something about the predictivity of Black Female that we can learn from Black Male or White Female. To understand the limit of this structure, and the extent to which there is an extra intersectional effect whereby there remains predictivity differences about Black Female that cannot be learned from the groups of Black and Female, we consider a different experiment. We operationalize the limit of what can be learned from the groups that share identities with Black Female, without training on any members from this group itself, by picking the ratio of White Female to Black Male training samples that results in the highest AUC performance on a validation set of Black Female. We perform this experiment for ACSPublicCoverage and ACSTravelTime, and in Fig. 3 (left) see that for ACSPublicCoverage, while Black Female has a unique subgroup predictivity, this difference can largely be learned from groups with shared characteristics, i.e., White Female and Black Male. On the other hand, in Fig. 3 (right) for ACSTravelTime, training only on groups that share characteristics with Black Female results in a AUC lower than what can be achieved when trained on the actual group tested upon. Although these results are somewhat noisy, they suggest that for this dataset and model, there may be an extra intersectional predictivity unique to Black Female.
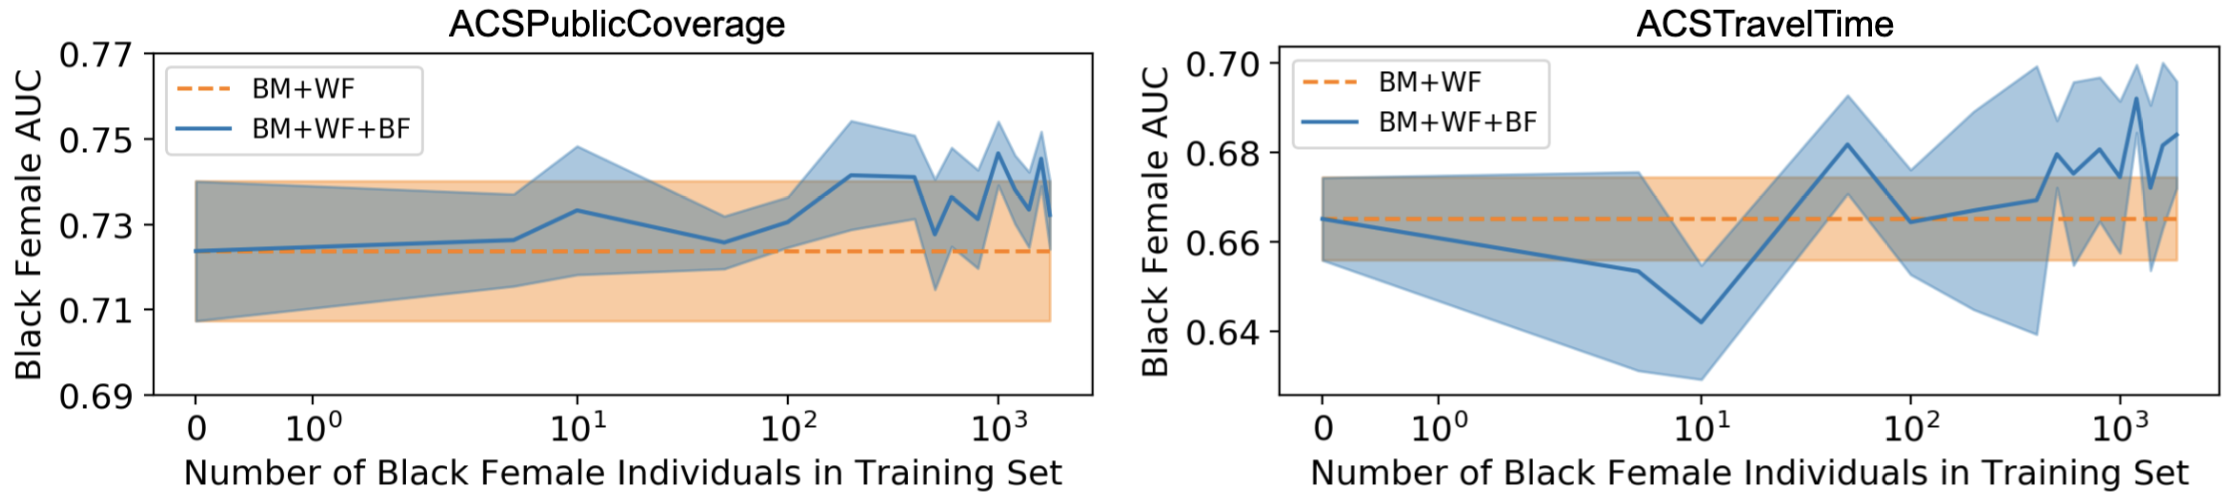
Two graphs for ACSPublicCoverage and ACSTravelTime datasets. X-axis is ”number of Black Female individuals in training set.” Y-axis is ”Black Female AUC.” Left graph shows two lines with overlapping confidence intervals. Right graph shows two lines with overlapping confidence intervals until the end, when the ”BM+WF+BF” line is slightly higher than ”BM+WF.”
Thus, our two experiments tell us the following: ACSIncome - no subgroup predictivity difference, ACSPublicCoverage - subgroup but not intersectional predictivity difference, and ACSTravelTime - both a subgroup and intersectional predictivity difference. Based on these results, ACSPublicCoverage appears eligible for leveraging dataset structure to alleviate an underrepresentation of the Black Female group. This means that algorithms need to incorporate additional axes of identities in a more structured way than just encoding the conjunction of attributes, e.g., race-sex. We emphasize that these results on predictivity do not make any claims about the societal causes of these effects.
5.3. Constructive Suggestions
In Sec. 5.1 we warn against transferring existing data imbalance methods to handle the progressively smaller groups that will arise in intersectionality without first giving careful consideration to normative concerns. In Sec. 5.2, we provide an initial exploration into a direction that leverages the structure in the data to learn about an underrepresented group from other groups it shares identities with. We recommend performing data analysis like we have shown to demonstrate whether this may be a suitable approach to proceed with for a particular algorithm and task.
However, this approach comes with significant caveats. Relying on it too much can counteract the purpose of intersectionality, and the unique effects that multiply marginalized groups experience. Prior work warns against treating intersectionality as a variable to be controlled for in an additive or multiplicative way (Simien, 2007; Hancock, 2007), and though our use of a multi-layer perceptron allows differences in predictivity to be captured in more complex ways than as a regression variable, we emphasize that mathematical structure in no way implies societal structure. For example, structure in the data does not preclude the idea that gender can only be understood in a racialized way, and vice versa (Simien, 2007).
6. Evaluating a large number of groups
Finally, we consider the problem of evaluation, and how extrapolating existing metrics is insufficient when the number of subgroups considered increases. In the binary attribute setting, fairness evaluation frequently takes the form of the difference between the groups for some performance measure derived from the confusion matrix. When more than two groups are considered, the evaluation metrics look similar in that they are generalized versions, rarely with changes to account for the incorporation of additional groups. They are commonly formulated in terms of the maximum difference (or ratio) of a performance metric either between one group to that of all (Guo and Caliskan, 2021; Kearns et al., 2018b; Yang et al., 2020), or between two groups (Foulds et al., 2018; Ghosh et al., 2021). We go over problems with both conceptualizations, and then offer suggestions for additional metrics to measure—notably, that it is important to consider the relative rankings of demographic groups.
6.1. Weaknesses of existing evaluation approaches
One-vs-all metrics will far more frequently measure minority groups to have the highest deviation, because inherently the majority group has the most influence over what the “all” is. In the other conceptualization via pairwise comparisons, only the values of two groups, usually the maximum and minimum, are being explicitly incorporated while the rest are ignored. The more groups there are as a result of incorporating more axes and identities, the more values are ignored. For example, when using max TPR difference in a setting with three demographic groups, we might imagine two different scenarios such that in one, the three groups’ TPRs are , and in another, they are . Both would report the same measurement of .7, despite coming from different distributions.
We term the family of evaluation metrics that encompasses both of these categories to be “max difference.” In line with existing work (Foulds et al., 2018; Kearns et al., 2018b; Yang et al., 2020), our max TPR difference defined in Sec. 3 is of this variety. However, there are significant problems with this formulation, even in the binary attribute setting. Because the mathematical notation for these fairness constraints is often formulated using parity (e.g., for groups and , ), an absolute value is sometimes applied to the difference, which would obscure whether an algorithm has over- or under-corrected.
| Algorithm | Max TPR Difference (%) | Average Group A Rank | Average Group B Rank |
|---|---|---|---|
| Baseline | 4.0 | 1.0 | |
| RWT | 3.0 | 1.6 | |
| RDC | 3.0 | 1.4 | |
| LOS | 3.6 | 1.0 | |
| GRP | 4.0 | 1.0 | |
| GRY | 4.0 | 1.0 |
To demonstrate further shortcomings, we first consider the ACSIncome dataset and the demographic groups of {Black, White} {Female, Male}. To get an idea of fairness concerns we miss by only considering a max difference metric like max TPR difference, we also calculate an additional metric that includes a notion of group rank. For Group A which has the lowest positive label base rate of the four groups, and Group B which has the highest, we report the ranking of their TPR (from 1 to 4 with 1 as the highest) relative to the other groups. In Tbl. 2 we see that across all algorithms, even if fairness is improved from the Baseline model, Group A’s ranking is consistently low while Group B’s is consistently high, and always higher than that of Group A’s. This is crucial to know because despite a fairness criteria of max difference below some being satisfied, the consistent ranking of one group below another compounds in a way to further systematic discrimination (Creel and Hellman, 2021). That there is a correlation between max TPR difference and group ranking in this scenario does not negate the importance of one metric or the other, as they each convey different information.
In our next experiment, we consider when there are many more than four subgroups and look at a new metric that measures the correlation between the rankings of a) base rates and b) TPRs after the fairness algorithm has been applied. This ranking correlation helps us understand to what extent the underlying social hierarchy is upheld.131313We note here a difference in what we are proposing from the syntactically similar space of fairness in rankings (Singh and Joachims, 2018; Zehlike et al., 2021) There, those being ranked are individuals, and the goal is to more closely align to a set of ground-truth rankings. Here, those being ranked are the aggregate evaluation metrics of demographic groups, and the goal is to surface alignment to existing rankings as a way of providing additional understanding about a model. The higher the correlation between these two sets of rankings, the more we are reifying a particular hierarchy of subgroups and entrenching existing disparities in the data. We use Kendall’s Tau (Kendall, 1938) as a measure of rank correlation, and combine the p-values obtained across runs of random seeds using Fisher’s combined probability test (Fisher, 1925).
Our results are in Fig. 4, and we only display the Kendall’s Tau value when it is statistically significant with . For the two graphs on the left, in Fig. 4(a) we hold the dataset constant and vary the axes of demographic attributes, and in Fig. 4(b) we hold the axes of demographic attributes constant and vary the dataset. We see that there are trends across algorithms (RWT and RDC are less likely to reify underlying rankings compared to GRP and GRY), demographic attributes (for ACSIncome, marital status x sex has predictive patterns more likely to reify underlying rankings), and dataset (for marital status x sex x disability, ACSMobility has predictive patterns less likely to reify underlying rankings).
In Fig. 4(c) we now take the setting from the first row of Fig. 4(a) and compare the two metrics of max TPR difference and our Kendall’s Tau ranking correlation. This shows two weaknesses with existing max difference metrics. The first, also demonstrated by Tbl. 2, is that additional information about how closely a model’s outputs adhere to underlying rankings provides an important and new perspective in understanding a model, as across five of the six algorithms, there is a statistically significant correlation in ranking. The second, is that across-algorithm comparisons can lead to conflicting conclusions, as each metric conveys a different algorithm to be more “fair.” Under max TPR difference, GRY is best, whereas for ranking correlation, it is RWT. These trade-offs need to be navigated by someone informed of the downstream application, and not implicitly ignored through the measuring of just one metric or another.141414Across both experiments from Tbl. 2 and Fig. 4, we are not comparing positive predictive value (PPV), but rather True Positive Rate (TPR), which is anchored in the labels as the ground truth. In other words, we are taking a rather conservative approach to fairness (Foulds et al., 2018), because even in a scenario where TPRs are equal, PPVs could still exactly correlate with base rates. That even under this more conservatively fair conception the existing inequalities are reified so strongly, signifies one can only imagine how much larger the inequalities would be when considering PPV.
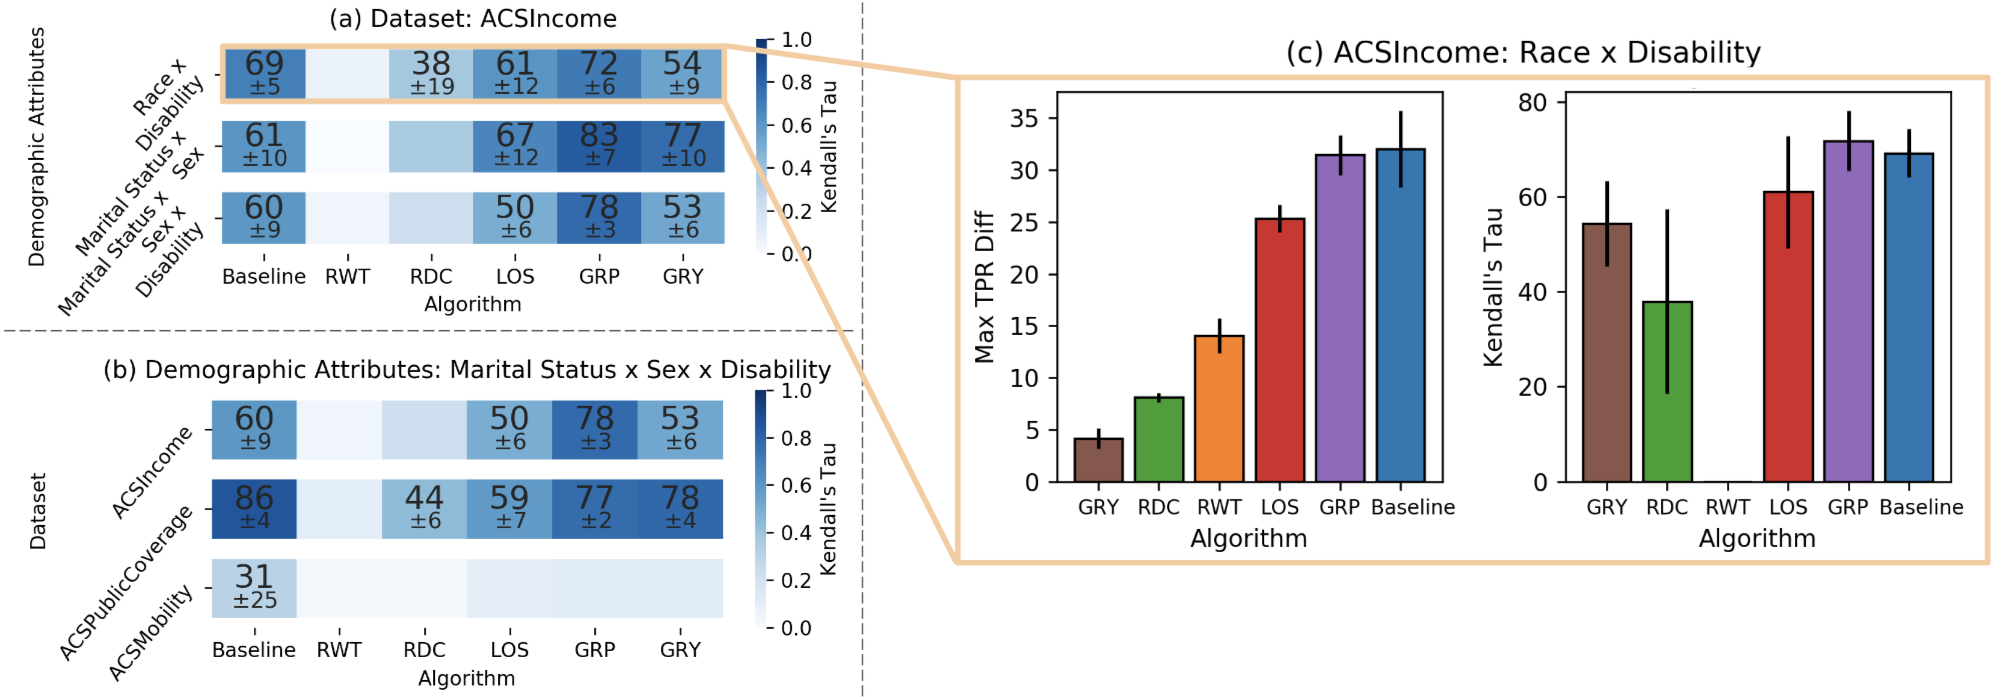
Two graphs on the left report the Kendall’s Tau value if it is statistically significant. The first holds dataset constant at ACSIncome and varies demographic attributes across: 1) race x disability, 2) marital status x sex, 3) marital status x sex x disability. The next holds demographic attributes constant at marital status x sex x disability and varies the dataset across ACSIncome, ACSPublicCoverage, and ACSMobility. On the right, a graph shows ACSIncome when demographic attributes are race x disability, and presents the max TPR difference and Kendall’s Tau value across six algorithms. The rankings amongst the algorithms between the two metrics are different.
The use of max difference metrics is emblematic of a larger trend in machine learning whereby all categories are generally treated the same. Although sometimes labels are treated differently, e.g., medical and self-driving car domains where FNs are more significant than FPs, this is a difference in the label rather than subgroup. It would make no difference to a model or evaluation metric if the labels for Black Female and White Male were swapped — a surprising statement when considering intersectionality and the importance of the history of oppressed groups. As machine learning fairness begins to consider intersectionality, we need to resist evaluation metrics that do not substantively incorporate additional considerations, and merely extrapolate from existing metrics. This is not to say that max difference isn’t useful, but rather that we should also consider others.
6.2. Constructive Suggestions
We offer suggestions on being more thoughtful with pairwise comparisons, as well as additional types of evaluation.151515Aggregating a set of input values into one summary output is akin to the economic framework of social choice theory. Social choice theory handles the aggregation of a set of individual’s inputs, which typically take the form of preferences, votes, welfare, etc. (Arrow, 1951). Each individual has an input utility value under each possible world state, and an aggregation rule is chosen over the inputs in order to pick the best world state. We could imagine leniently conceiving of each individual in the set to be a different pair of demographic subgroups, with its corresponding utility being the negative TPR difference between them. The different world states are then the set of all possible model predictions. Under this conception, max TPR difference would map to the egalitarian aggregation rule (Rawls, 1974), which maximizes the minimum utility of all individuals (i.e., minimizing the max pairwise TPR difference). Under a different, utilitarian aggregation rule (Mills, 1863; Moulin, 2004), we would instead maximize the sum of the utility values (i.e., minimize the sum of pairwise TPR differences). Ultimately we did not further explore this perspective because our focus is to expand out beyond this flavor of aggregation; however, one could imagine this to be a direction of exploration, e.g., by conceiving of individuals to be an entity other than a pair of demographic subgroups.
If pairwise comparisons are to be done, machine learning practitioners can learn from other disciplines. When social scientists leverage pairwise comparisons in studying intersectionality, they often do so with more deliberate thought put into the pairings, i.e., with a context-first rather than numbers-first approach (e.g., between the max and min). As noted by McCall (2005), “although a single social group is the focus of intensive study, it is often shown to be different and therefore of interest through an extended comparison with the more standard groups that have been the subject of previous studies.” The author gives examples like comparing “working-class women to working-class men (Freeman, 2000)” and “Latina domestic workers to an earlier generation of African American domestic workers (Hondagneu-Sotelo, 2007).” There has been work in machine learning that used a somewhat context-first approach in intersectional evaluations, but frequently default to anchoring comparisons to the most privileged group, e.g., white men (Steed and Caliskan, 2021; Tan and Celis, 2019), or the least privileged group (Tan and Celis, 2019). However, this can reify the norm of the privileged as default, a complaint that has been made about certain intersectionality frameworks (Carastathis, 2008). Johfre and Freese (2021) note that even if done out of convention, comparing relative to a dominant group can reify the notion that they are the norm. The paper puts forth concrete guidelines on how to better choose the reference category, and though not specific to intersectionality, can help us navigate how to be more deliberate with any pairwise comparisons that need to be performed. While we point to their work for details, this includes heuristics such as if some group is defined as the negation of another or if certain categories unfold from one singular group.
Reporting disaggregated analyses for all subgroups would of course alleviate many of these problems, and should be done before deployment (Barocas et al., 2021), but for iterating on model training can be unwieldy. Additional “summary statistics” that involve just adding one or two more bits of information, such as the metrics we show in Sec. 6.1 of the ranks of the groups with the highest and lowest base rate or the correlation between the rankings of the base rates and model TPRs, would greatly supplant just the pairwise difference. While each individual algorithm may seem fair, if each algorithm has group A’s TPR below group B’s, this can have significant compounding impacts on individuals from group A (Creel and Hellman, 2021).
7. Conclusion
In this work, we consider the problems that machine learning fairness will need to grapple with as it endeavours upon the process of incorporating intersectionality. We provide guidance on three practical concerns along the machine learning pipeline. For which identities to consider, we recommend evaluating on the most granular intersecting identities available in the dataset, but combining domain knowledge with experiments to understand which are best to include when training models. For how to handle the increasingly small groups, we caution against porting over existing machine learning techniques for imbalanced data due to their additional normative concerns, and offer a suggestion about leveraging structure that may be present between groups that share an identity. And finally for evaluation of a large number of subgroups, we both suggest how one could more thoughtfully conduct pairwise comparisons as well as present additional metrics to capture broader patterns of algorithms which existing metrics may obscure. These are just a few of the many steps that will need to be taken to incorporate intersectionality into machine learning, and we encourage the machine learning community to grapple with the complexities of intersectionality beyond just conceptualizing it as multi-attribute fairness.
8. Positionality Statement
All authors are computer scientists by training, and despite having worked on ML fairness, we do not have traditional social science backgrounds. Additionally, there are group identities we discuss that we don’t have lived experiences for.
Acknowledgements.
This material is based upon work supported by the National Science Foundation under Grant No. 1763642, Grant No. 2112562, and Graduate Research Fellowship to AW. Any opinions, findings, and conclusions or recommendations expressed in this material are those of the author(s) and do not necessarily reflect the views of the National Science Foundation. We thank Susan J. Brison, Chris Felton, Arvind Narayanan, Vivien Nguyen, and Dora Zhao for feedback.References
- (1)
- Adams et al. (2015) Rachel Adams, Benjamin Reiss, and David Serlin. 2015. Keywords for Disability Studies. NYU Press (2015).
- Agarwal et al. (2018) Alekh Agarwal, Alina Beygelzimer, Miroslav Dudík, John Langford, and Hanna Wallach. 2018. A Reductions Approach to Fair Classification. International Conference on Machine Learning (ICML) (2018).
- Aigner and Cain (1977) Dennis J. Aigner and Glen G. Cain. 1977. Statistical Theories of Discrimination in Labor Markets. Industrial and Labor Relations Review 30, 2 (1977).
- Ansara (2012) Y. Gavriel Ansara. 2012. Cisgenderism in medical settings: How collaborative partnerships can challenge structural violence. Out of the ordinary: LGBT lives (2012), 102–122.
- Arrow (1951) Kenneth Arrow. 1951. Social Choice and Individual Values. John Wiley & Sons (1951).
- Ashok (2016) Sowmiya Ashok. 2016. The Rise of the American ’Others’. The Atlantic (2016).
- Atewologun (2018) Doyin Atewologun. 2018. Intersectionality Theory and Practice. Oxford Research Encyclopedias (2018).
- Barocas et al. (2021) Solon Barocas, Anhong Guo, Ece Kamar, Jacquelyn Krones, Meredith Ringel Morris, Jennifer Wortman Vaughan, W. Duncan Wadsworth, and Hanna Wallach. 2021. Designing Disaggregated Evaluations of AI Systems: Choices, Considerations, and Tradeoffs. AAAI/ACM Conference on AI, Ethics, and Society (AIES) (2021).
- bell hooks (1981) bell hooks. 1981. Ain’t I a Woman? South End Press (1981).
- Bellamy et al. (2018) Rachel K. E. Bellamy, Kuntal Dey, Michael Hend, Samuel C. Hoffman, Stephanie Houde, Kalapriya Kannan, Pranay Lohia, Jacquelyn Martino, Sameep Mehta, Aleksandra Mojsilovic, Seema Nagar, Karthikeyan Natesan Ramamurthy, John Richards, Diptikalyan Saha, Prasanna Sattigeri, Moninder Singh, Kush R. Varshney, and Yunfeng Zhang. 2018. AI Fairness 360: An Extensible Toolkit for Detecting, Understanding, and Mitigating Unwanted Algorithmic Bias. arXiv:1810.01943 (2018).
- Benthall and Haynes (2019) Sebastian Benthall and Bruce D. Haynes. 2019. Racial categories in machine learning. Conference on Fairness, Accountability, and Transparency (FAccT) (2019).
- Birhane (2021) Abeba Birhane. 2021. Algorithmic injustice: a relational ethics approach. Patterns 2 (2021). Issue 2.
- Bowker and Star (2000) Geoffrey C. Bowker and Susan Leigh Star. 2000. Sorting Things Out: Classification and Consequences. MIT Press (2000).
- Brockman et al. (2016) Greg Brockman, Vicki Cheung, Ludwig Pettersson, Jonas Schneider, John Schulman, Jie Tang, and Wojciech Zaremba. 2016. OpenAI Gym. arXiv:arXiv:1606.01540
- Brown et al. (2007) J. Scott Brown, Steven Hitlin, and Glen H. Elder Jr. 2007. The importance of being “other”: A natural experiment about lived race over time. Social Science Research 36 (2007), 159–174. Issue 1.
- Carastathis (2008) Anna Carastathis. 2008. The invisibility of privilege: a critique of intersectional models of identity. Les Ateliers de l’Ethique 3, 2 (2008), 23–38.
- Chaney et al. (2018) Allison J.B. Chaney, Brandon M. Stewart, and Barbara E. Engelhardt. 2018. How Algorithmic Confounding in Recommendation Systems Increases Homogeneity and Decreases Utility. ACM Conference on Recommender Systems (RecSys) (2018).
- Chawla et al. (2011) Nitesh V. Chawla, Kevin W. Bowyer, Lawrence O. Hall, and W. Philip Kegelmeyer. 2011. SMOTE: Synthetic Minority Over-sampling Technique. Journal Of Artificial Intelligence Research 16 (2011), 321–357.
- Chen and Wu (2020) Mingliang Chen and Min Wu. 2020. Towards Threshold Invariant Fair Classification. Conference on Uncertainty in Artificial Intelligence (UAI) (2020).
- Chiappa and Isaac (2019) Silvia Chiappa and William S. Isaac. 2019. A Causal Bayesian Networks Viewpoint on Fairness. IFIP Advances in Information and Communication Technology book series (2019).
- Ciampaglia et al. (2018) Giovanni Luca Ciampaglia, Azadeh Nematzadeh, Filippo Menczer, and Alessandro Flammini. 2018. How algorithmic popularity bias hinders or promotes quality. Scientific Reports (2018).
- Collective (1977) Combahee River Collective. 1977. The Combahee River Collective Statement. (1977).
- Collins (1990) Patricia Hill Collins. 1990. Black Feminist Thought: Knowledge, Consciousness and the Politics of Empowerment. Hyman (1990).
- Collins and Bilge (2020) Patricia Hill Collins and Sirma Bilge. 2020. Intersectionality. John Wiley & Sons (2020).
- Creel and Hellman (2021) Kathleen Creel and Deborah Hellman. 2021. The Algorithmic Leviathan: Arbitrariness, Fairness, and Opportunity in Algorithmic Decision Making Systems. Conference on Fairness, Accountability, and Transparency (FAccT) (2021).
- Crenshaw (1989) Kimberle Crenshaw. 1989. Demarginalizing the Intersection of Race and Sex: A Black Feminist Critique of Antidiscrimination Doctrine, Feminist Theory and Antiracist Politics. University of Chicago Legal Forum (1989). Issue 1.
- D’Amour et al. (2020) Alexander D’Amour, Hansa Srinivasan, James Atwood, Pallavi Baljekar, David Sculley, and Yoni Halpern. 2020. Fairness is not static: deeper understanding of long term fairness via simulation studies. Conference on Fairness, Accountability, and Transparency (FAccT) (2020).
- de Monteflores and Schultz (1978) Carmen de Monteflores and Stephen J. Schultz. 1978. Coming Out: Similarities and Differences for Lesbians and Gay Men. Journal of Social Issues (1978).
- de Vries (2014) Kylan Mattias de Vries. 2014. Transgender people of color at the center: Conceptualizing a new intersectional model. Ethnicities 15 (2014), 3–27.
- Dickinson and Oaxaca (2009) David L. Dickinson and Ronald L. Oaxaca. 2009. Statistical Discrimination in Labor Markets: An Experimental Analysis. Southern Economic Journal 26, 1 (2009).
- Ding et al. (2021) Frances Ding, Moritz Hardt, John Miller, and Ludwig Schmidt. 2021. Retiring Adult: New Datasets for Fair Machine Learning. Advances in Neural Information Processing Systems (NeurIPS) (2021).
- Dua and Graff (2017) Dheeru Dua and Casey Graff. 2017. UCI Machine Learning Repository. http://archive.ics.uci.edu/ml
- Dwork et al. (2012) Cynthia Dwork, Moritz Hardt, Toniann Pitassi, Omer Reingold, and Richard Zemel. 2012. Fairness through Awareness. Proceedings of the 3rd Innovations in Theoretical Computer Science Conference (2012).
- Dwork et al. (2018) Cynthia Dwork, Nicole Immorlica, Adam Tauman Kalai, and Max Leiserson. 2018. Decoupled classifiers for fair and efficient machine learning. Conference on Fairness, Accountability, and Transparency (FAccT) (2018).
- Edlagan and Vaghul (2016) Christian Edlagan and Kavya Vaghul. 2016. How data disaggregation matters for Asian Americans and Pacific Islanders. Washington Center for Equitable Growth (2016).
- England (1992) Paula England. 1992. Comparable Worth: Theories and Evidence. Aldine De Gruyter (1992).
- Fei-Fei et al. (2003) Li Fei-Fei, Rob Fergus, and Pietro Perona. 2003. A Bayesian Approach to Unsupervised One-Shot Learning of Object Categories. International Conference on Computer Vision (ICCV) (2003).
- Fisher (1925) Ronald A. Fisher. 1925. Statistical methods for research workers. Oliver & Boyd (1925).
- Foulds et al. (2019) James Foulds, Rashidul Islam, Kamrun Keya, and Shimei Pan. 2019. Bayesian Modeling of Intersectional Fairness: The Variance of Bias. arXiv:1811.07255 (2019).
- Foulds et al. (2018) James Foulds, Rashidul Islam, Kamrun Naher Keya, and Shimei Pan. 2018. An Intersectional Definition of Fairness. arXiv:1807.08362 (2018).
- Freeman (2000) Carla Freeman. 2000. High Tech and High Heels in the Global Economy: Women, Work, and Pink-Collar Identities in the Caribbean. Duke University Press (2000).
- Friedler et al. (2019) Sorelle A. Friedler, Carlos Scheidegger, Suresh Venkatasubramanian, Sonam Choudhary, Evan P. Hamilton, and Derek Roth. 2019. A comparative study of fairness-enhancing interventions in machine learning. Conference on Fairness, Accountability, and Transparency (FAccT) (2019).
- Frohard-Dourlent et al. (2016) Hélène Frohard-Dourlent, Sarah Dobson, Beth A. Clark, Marion Doull, and Elizabeth M. Saewyc. 2016. “I would have preferred more options”: accounting for non-binary youth in health research. Nursing Inquiry (2016).
- Garimella et al. (2017) Kiran Garimella, Aristides Gionis, Nikos Parotsidis, and Nikolaj Tatti. 2017. Balancing information exposure in social networks. Advances in Neural Information Processing Systems (NeurIPS) (2017).
- Geschke et al. (2018) Daniel Geschke, Jan Lorenz, and Peter Holtz. 2018. The triple-filter bubble: Using agent-based modelling to test a meta-theoretical framework for the emergence of filter bubbles and echo chambers. British Journal of Social Psychology (2018).
- Ghosh et al. (2021) Avijit Ghosh, Lea Genuit, and Mary Reagan. 2021. Characterizing Intersectional Group Fairness with Worst-Case Comparisons. Affinity Group Workshop on Diversity in Artificial Intelligence: Diversity, Belonging, Equity, and Inclusion (AIDBEI) at AAAI 2021 (2021).
- Glass et al. (1972) Gene V. Glass, Percy D. Peckham, and James R. Sanders. 1972. Consequences of Failure to Meet Assumptions Underlying the Fixed Effects Analysis of Variance and Covariance. Review of Educational Research 42 (1972).
- Goel et al. (2016) Sharad Goel, Ashton Anderson, Jake Hofman, and Duncan J. Watts. 2016. The Structural Virality of Online Diffusion. Management Science (2016).
- Goldenfein (2019) Jake Goldenfein. 2019. The Profiling Potential of Computer Vision and the Challenge of Computational Empiricism. Conference on Fairness, Accountability, and Transparency (FAccT) (2019).
- Green and Hu (2018) Ben Green and Lily Hu. 2018. The Myth in the Methodology: Towards a Recontextualization of Fairness in Machine Learning. Machine Learning: The Debates workshop at the 35th International Conference on Machine Learning (2018).
- Green and Viljoen (2020) Ben Green and Salomé Viljoen. 2020. Algorithmic Realism: Expanding the Boundaries of Algorithmic Thought. Conference on Fairness, Accountability, and Transparency (FAccT) (2020).
- Grillo (1995) Trina Grillo. 1995. Anti-Essentialism and Intersectionality: Tools to Dismantle the Master’s House. Berkeley Journal of Gender, Law & Justice 10 (1995).
- Guo and Caliskan (2021) Wei Guo and Aylin Caliskan. 2021. Detecting Emergent Intersectional Biases: Contextualized Word Embeddings Contain a Distribution of Human-like Biases. AAAI/ACM Conference on AI, Ethics, and Society (AIES) (2021).
- Hamidi et al. (2018) Foad Hamidi, Morgan Klaus Scheuerman, and Stacy M. Branham. 2018. Gender Recognition or Gender Reductionism? The Social Implications of Automatic Gender Recognition. ACM Conference on Human Factors in Computing Systems (CHI) (2018).
- Hancock (2007) Ange-Marie Hancock. 2007. When Multiplication Doesn’t Equal Quick Addition: Examining Intersectionality as a Research Paradigm. Perspectives on Politics (2007).
- Hanna et al. (2020) Alex Hanna, Emily Denton, Andrew Smart, and Jamila Smith-Loud. 2020. Towards a Critical Race Methodology in Algorithmic Fairness. ACM Conference on Fairness, Accountability, Transparency (FAccT) (2020).
- Hardt (2014) Moritz Hardt. 2014. How big data is unfair. Medium (2014).
- Hardt et al. (2016) Moritz Hardt, Eric Price, and Nathan Srebro. 2016. Equality of Opportunity in Supervised Learning. arXiv:1610.02413 (2016).
- Hebert-Johnson et al. (2018) Ursula Hebert-Johnson, Michael Kim, Omer Reingold, and Guy Rothblum. 2018. Multicalibration: Calibration for the (Computationally-Identifiable) Masses. International Conference on Machine Learning (ICML) (2018).
- Herek (2002) Gregory M. Herek. 2002. Gender Gaps in Public Opinion about Lesbians and Gay Men. Public Opinion Quarterly (2002).
- Hirschman et al. (2000) Charles Hirschman, Richard Alba, and Reynolds Farley. 2000. The Meaning and Measurement of Race in the U.S. Census: Glimpses into the Future. Demography 37, 3 (2000).
- Holland (2008) Paul W. Holland. 2008. Causation and Race. White Logic, White Methods: Racism and Methodology (2008).
- Hondagneu-Sotelo (2007) Pierrette Hondagneu-Sotelo. 2007. Domestica: Immigrant Workers Cleaning and Caring in the Shadows of Affluence. University of California Press (2007).
- Hu and Kohler-Hausmann (2020) Lily Hu and Issa Kohler-Hausmann. 2020. What’s Sex Got to Do With Fair Machine Learning? Conference on Fairness, Accountability, and Transparency (FAccT) (2020).
- Hutchinson and Mitchell (2018) Ben Hutchinson and Margaret Mitchell. 2018. 50 Years of Test (Un)fairness: Lessons for Machine Learning. CoRR abs/1811.10104 (2018). arXiv:1811.10104 http://arxiv.org/abs/1811.10104
- Höfer et al. (2020) Sebastian Höfer, Kostas Bekris, Ankur Handa, Juan Camilo Gamboa, Florian Golemo, and Melissa Mozifian. 2020. 2nd Workshop on Closing the Reality Gap in Sim2Real Transfer for Robotics. (2020). https://sim2real.github.io
- Jacobs and Wallach (2021) Abigail Z. Jacobs and Hanna Wallach. 2021. Measurement and Fairness. ACM Conference on Fairness, Accountability, Transparency (FAccT) (2021).
- Japkowicz (2000) Nathalie Japkowicz. 2000. The Class Imbalance Problem: Significance and Strategies. International Conference on Artificial Intelligence (IC-AI) (2000).
- Jiang and Nachum (2020) Heinrich Jiang and Ofir Nachum. 2020. Identifying and Correcting Label Bias in Machine Learning. Proceedings of the International Conference on Artificial Intelligence and Statistics (AISTATS) (2020).
- Jiang et al. (2019) Ray Jiang, Silvia Chiappa, Tor Lattimore, András György, and Pushmeet Kohli. 2019. Degenerate Feedback Loops in Recommender Systems. AAAI/ACM Conference on AI, Ethics, and Society (AIES) (2019).
- Jo and Gebru (2020) Eun Seo Jo and Timnit Gebru. 2020. Lessons from archives: strategies for collecting sociocultural data in machine learning. Conference on Fairness, Accountability, and Transparency (FAccT) (2020).
- Johfre and Freese (2021) Sasha Shen Johfre and Jeremy Freese. 2021. Reconsidering the Reference Category. Sociological Methodology (2021).
- Kamiran et al. (2012) Faisal Kamiran, Asim Karim, and Xiangliang Zhang. 2012. Decision Theory for Discrimination-Aware Classification. IEEE 12th International Conference on Data Mining (2012).
- Kasirzadeh and Smart (2021) Atoosa Kasirzadeh and Andrew Smart. 2021. The Use and Misuse of Counterfactuals in Ethical Machine Learning. Conference on Fairness, Accountability, and Transparency (FAccT) (2021).
- Kasy and Abebe (2021) Maximilian Kasy and Rediet Abebe. 2021. Fairness, Equality, and Power in Algorithmic Decision-Making. Conference on Fairness, Accountability, and Transparency (FAccT) (2021).
- Kearns et al. (2018a) Michael Kearns, Seth Neel, Aaron Roth, and Zhiwei Steven Wu. 2018a. An Empirical Study of Rich Subgroup Fairness for Machine Learning. arXiv:1808.08166 (2018).
- Kearns et al. (2018b) Michael Kearns, Seth Neel, Aaron Roth, and Zhiwei Steven Wu. 2018b. Preventing Fairness Gerrymandering: Auditing and Learning for Subgroup Fairness. International Conference on Machine Learning (ICML) (2018).
- Kendall (1938) M. G. Kendall. 1938. A New Measure of Rank Correlation. Biometrika 30 (1938).
- Kim et al. (2019) Michael P. Kim, Amirata Ghorbani, and James Zou. 2019. Multiaccuracy: Black-Box Post-Processing for Fairness in Classification. AAAI/ACM Conference on AI, Ethics, and Society (AIES) (2019).
- King (1988) Deborah K. King. 1988. Multiple Jeopardy, Multiple Consciousness: The Context of a Black Feminist Ideology. Signs 14 (1988).
- Kirk et al. (2021) Hannah Kirk, Yennie Jun, Haider Iqba, Elias Benussi, Filippo Volpin, Frederic A. Dreyer, Aleksandar Shtedritski, and Yuki M. Asano. 2021. How True is GPT-2? An Empirical Analysis of Intersectional Occupational Biases. arXiv: 2102.04130 (2021).
- Kober et al. (2013) Jens Kober, J. Andrew Bagnell, and Jan Peters. 2013. Reinforcement Learning in Robotics: A Survey. The International Journal of Robotics Research (2013).
- Kohler-Hausmann (2019) Issa Kohler-Hausmann. 2019. Eddie Murphy and the Dangers of Counterfactual Causal Thinking About Detecting Racial Discrimination. Northwestern University Law Review (2019).
- Kubat and Matwin (1997) Miroslav Kubat and Stan Matwin. 1997. Addressing the Curse of Imbalanced Training Sets: One-Sided Selection. International Conference on Machine Learning (ICML) (1997).
- Larrazabal et al. (2020) Agostina J. Larrazabal, Nicolás Nieto, Victoria Peterson, Diego H. Milone, and Enzo Ferrante. 2020. Gender imbalance in medical imaging datasets produces biased classifiers for computer-aided diagnosis. Proceedings of the National Academy of Sciences (PNAS) (2020).
- Li et al. (2017) Jiuyong Li, Jixue Liu, Lin Liu, Thuc Duy Le, Saisai Ma, and Yizhao Han. 2017. Discrimination detection by causal effect estimation. IEEE International Conference on Big Data (Big Data) (2017).
- Liebler and Halpern-Manners (2008) Carolyn A. Liebler and Andrew Halpern-Manners. 2008. A practical approach to using multiple-race response data: a bridging method for public-use microdata. Demography (2008).
- Lix et al. (1996) Lisa M. Lix, Joanne C. Keselman, and H. J. Keselman. 1996. Consequences of Assumption Violations Revisited: A Quantitative Review of Alternatives to the One-Way Analysis of Variance ”F” Test. Review of Educational Research 66 (1996).
- Lucherini et al. (2021) Eli Lucherini, Matthew Sun, Amy Winecoff, and Arvind Narayanan. 2021. T-RECS: A Simulation Tool to Study the Societal Impact of Recommender Systems. arXiv:2107.08959 (2021).
- Makkonen (2002) LL.M Timo Makkonen. 2002. Multiple, Compound and Intersectional Discrimination: Bringing the Experiences of the Most Marginalized to the Fore. Institute For Human Rights, Åbo Akademi University (2002).
- Mary et al. (2019) Jeremie Mary, Clément Calauzènes, and Noureddine El Karoui. 2019. Fairness-Aware Learning for Continuous Attributes and Treatments. International Conference on Machine Learning (ICML) (2019).
- McCall (2005) Leslie McCall. 2005. The Complexity of Intersectionality. The University of Chicago Press 30, 3 (2005).
- McLemore (2015) Kevin A. McLemore. 2015. Experiences with Misgendering: Identity Misclassification of Transgender Spectrum Individuals. Self and Identity (2015). Issue 1.
- Mills (1863) John Stuart Mills. 1863. Utilitarianism. Fraser’s Magazine (1863).
- Mitchell et al. (2021) Shira Mitchell, Eric Potash, Solon Barocas, Alexander D’Amour, and Kristian Lum. 2021. Prediction-Based Decisions and Fairness: A Catalogue of Choices, Assumptions, and Definitions. Annual Review of Statistics and Its Application (2021).
- Morina et al. (2019) Giulio Morina, Viktoriia Oliinyk, Julian Waton, Ines Marusic, and Konstantinos Georgatzis. 2019. Auditing and Achieving Intersectional Fairness in Classification Problems. arXiv:1911.01468 (2019).
- Moulin (2004) Hervé Moulin. 2004. Fair Division and Collective Welfare. MIT Press (2004).
- Nash (2008) Jennifer C. Nash. 2008. Re-Thinking Intersectionality. Feminist Review (2008).
- on Gender-Based Violence ([n. d.]) Asian Pacific Institute on Gender-Based Violence. [n. d.]. Census Data & API Identities. ([n. d.]).
- Petty (2020) Tawana Petty. 2020. Safe or Just Surveilled?: Tawana Petty on the Fight Against Facial Recognition Surveillance. Logic (2020).
- Pleiss et al. (2017) Geoff Pleiss, Manish Raghavan, Felix Wu, Jon Kleinberg, and Kilian Q. Weinberger. 2017. On Fairness and Calibration. Advances in Neural Information Processing Systems (NeurIPS) (2017).
- Ramaswamy et al. (2021) Vikram V. Ramaswamy, Sunnie S. Y. Kim, and Olga Russakovsky. 2021. Fair Attribute Classification through Latent Space De-biasing. Conference on Computer Vision and Pattern Recognition (CVPR) (2021).
- Rawls (1974) John Rawls. 1974. Some Reasons for the Maximin Criterion. The American Economic Review (1974).
- Ren et al. (2018) Mengye Ren, Wenyuan Zeng, Bin Yang, and Raquel Urtasun. 2018. Learning to Reweight Examples for Robust Deep Learning. International Conference on Machine Learning (ICML) (2018).
- Sattigeri et al. (2019) Prasanna Sattigeri, Samuel C. Hoffman, Vijil Chenthamarakshan, and Kush R. Varshney. 2019. Fairness GAN. IBM Journal of Research and Development (2019).
- Schelling (1971) Thomas C. Schelling. 1971. Dynamic models of segregation. The Journal of Mathematical Sociology (1971).
- Scheuerman et al. (2021) Morgan Klaus Scheuerman, Jialun Aaron Jiang, Katta Spiel, and Jed R. Brubaker. 2021. Revisiting Gendered Web Forms: An Evaluation of Gender Inputs with (Non-)Binary People. ACM Conference on Human Factors in Computing Systems (CHI) (2021).
- Scheuerman et al. (2019) Morgan Klaus Scheuerman, Jacob M Paul, and Jed R. Brubaker. 2019. How Computers See Gender: An Evaluation of Gender Classification in Commercial Facial Analysis Services. ACM Conference On Computer-Supported Cooperative Work And Social Computing (CSCW) (2019).
- Selbst et al. (2019) Andrew D. Selbst, danah boyd, Sorelle A. Friedler, Suresh Venkatasubramanian, and Janet Vertesi. 2019. Fairness and Abstraction in Sociotechnical Systems. Conference on Fairness, Accountability, and Transparency (FAccT) (2019).
- Sen and Wasow (2016) Maya Sen and Omar Wasow. 2016. Race as a Bundle of Sticks: Designs that Estimate Effects of Seemingly Immutable Characteristics. Annual Review of Political Science (2016).
- Sharmanska et al. (2020) Viktoriia Sharmanska, Lisa Anne Hendricks, Trevor Darrell, and Novi Quadrianto. 2020. Contrastive Examples for Addressing the Tyranny of the Majority. arXiv:2004.06524 (2020).
- Shields (2008) Stephanie A. Shields. 2008. Gender: An Intersectionality Perspective. Sex Roles 59 (2008), 301–311.
- Simien (2007) Evelyn M. Simien. 2007. Doing Intersectionality Research: From Conceptual Issues to Practical Examples. Politics and Gender (2007).
- Singh and Joachims (2018) Ashudeep Singh and Thorsten Joachims. 2018. Fairness of Exposure in Rankings. SIGKDD Conference on Knowledge Discovery and Data Mining (2018).
- Spelman (1988) Elizabeth Spelman. 1988. Inessential Woman: Problems of Exclusion in Feminist Thought. Beacon Press (1988).
- Stark (2019) Luke Stark. 2019. Facial Recognition is the Plutonium of AI. XRDS: Crossroads (2019).
- Steed and Caliskan (2021) Ryan Steed and Aylin Caliskan. 2021. Image Representations Learned With Unsupervised Pre-Training Contain Human-like Biases. Conference on Fairness, Accountability, and Transparency (FAccT) (2021).
- Tan and Celis (2019) Yi Chern Tan and L. Elisa Celis. 2019. Assessing Social and Intersectional Biases in Contextualized Word Representations. Advances in Neural Information Processing Systems (NeurIPS) (2019).
- Törnberg (2018) Petter Törnberg. 2018. Echo chambers and viral misinformation: Modeling fake news as complex contagion. PLOS ONE (2018).
- Whittaker et al. (2019) Meredith Whittaker, Meryl Alper, Cynthia L. Bennett, Sara Hendren, Liz Kaziunas, Mara Mills, Meredith Ringel Morris, Joy Rankin, Emily Rogers, Marcel Salas, and Sarah Myers West. 2019. Disability, Bias, and AI. AI Now (2019).
- Yang et al. (2020) Forest Yang, Moustapha Cisse, and Sanmi Koyejo. 2020. Fairness with Overlapping Groups. Advances in Neural Information Processing Systems (NeurIPS) (2020).
- Yucer et al. (2020) Seyma Yucer, Samet Akçay, Noura Al-Moubayed, and Toby P. Breckon. 2020. Exploring Racial Bias within Face Recognition via per-subject Adversarially-Enabled Data Augmentation. Fair, Data Efficient, and Trusted Computer Vision Workshop at CVPR (2020).
- Zehlike et al. (2021) Meike Zehlike, Ke Yang, and Julia Stoyanovich. 2021. Fairness in Ranking: A Survey. arXiv: 2103.14000 (2021).
- Ángel Alexander Cabrera et al. (2019) Ángel Alexander Cabrera, Will Epperson, Fred Hohman, Minsuk Kahng, Jamie Morgenstern, and Duen Horng Chau. 2019. FairVis: Visual Analytics for Discovering Intersectional Bias in Machine Learning. IEEE Conference on Visual Analytics Science and Technology (VAST) (2019).
Appendix A Algorithms and Hyperparameters
We describe additional details about the five algorithms we perform experiments on. For thee algorithms that we are able to do so, we use our baseline 3 layer neural network as the model architecture.
RWT (Jiang and Nachum, 2020): reweighting scheme on the training samples that learns group-specific weights between each group’s positive and negative instances. The algorithm lowers the weight on positive examples of a group if its TPR is higher than the overall rate, and increases the weight on the positive examples otherwise. In the original algorithm this is an iterative process whereby the entire classifier is retrained with each new set of weights. In extending this method to a neural network, we continue training the model at each iteration without retraining the whole model from scratch.
RDC (Agarwal et al., 2018): reduces optimizing for both accuracy and a fairness constraint to a sequence of cost-sensitive classifications, which can be solved to yield a randomized classifier. We adapted this to yield continuous outputs, by using the probabilities output by each classifier in the ensemble.
LOS (Foulds et al., 2018): weighted addition to loss of an extra intersectional fairness regularizing term that minimizes the maximum log ratio between the rate of positive classification of all groups. In order to modify this for our fairness criterion, we minimize the maximum ratio between the TPR of all groups.
GRP (Yang et al., 2020): GroupFair is probabilistic combinations of logistic regression models that ensure fairness for overlapping groups. This method contains two variations, weighted ERM and plugin, and we only use the latter due to the prohibitively long computational time required for the former. We combine the model’s continuous outputs rather than discrete ones.
GRY (Kearns
et al., 2018b, a): cost-sensitive classifications to obtain solutions to a 2-player zero-sum game between a learner (which learns the classifier) and an auditor (which ensures that the fairness criterion is met). The method produces a sequence of classifiers, all of which output hard outputs, and we use the average of these outputs. We use linear regression for the individual models.
Hyperparameters are all tuned on the validation set. The first split is 70-30 for training/validation and the test set. The training/validation is further split at 70-30 again to make the training and validation sets.
Baseline: batch size: 64, and hyperparameter tuning across epochs: [50, 100, 150] learning rate: [.001, .005]
RWT (Jiang and Nachum, 2020): batch size: 64, learning rate: .001, hyperparameter tuning across epochs: [100, 150] reweight learning rate (algorithm-specific hyperparameter): [.1, .2, .5, 1.]
RDC (Agarwal et al., 2018): hyperparameter tuning across batch size: [256, 512, 1024, 2048] epochs: number of iterations:[10, 20, 50]
LOS (Foulds et al., 2018): batch size: 1024, learning rate: .005, hyperparameter tuning across epochs: [200, 250, 300] weight on additional loss: [.01, .5, .1]
GRP (Yang et al., 2020): epochs: 10000, learning rate: .01, B: 50, hyperparameter tuning across : [0.001, 0.003, 0.01, 0.03, 0.1]