Thermodynamic and electrical transport properties of UTe2 under uniaxial stress
Abstract
Despite intense experimental efforts, the nature of the unconventional superconducting order parameter of UTe2 remains elusive. This puzzle stems from different reported numbers of superconducting transitions at ambient pressure, as well as a complex pressure-temperature phase diagram. To bring new insights into the superconducting properties of UTe2, we measured the heat capacity and electrical resistivity of single crystals under compressive uniaxial stress applied along different crystallographic directions. We find that the critical temperature of the single observed bulk superconducting transition decreases with along [100] and [110] but increases with along [001]. Aside from its effect on , we notice that -axis stress leads to a significant piezoresistivity, which we associate with the shift of the zero-pressure resistivity peak at to lower temperatures under stress. Finally, we show that an in-plane shear stress does not induce any observable splitting of the superconducting transition over a stress range of . This result suggests that the superconducting order parameter of UTe2 may be single-component at ambient pressure.
The recently discovered uranium-based unconventional superconductor UTe2 has attracted a lot of attention as a promising candidate for spin-triplet pairing and topological superconductivity [ran2019]. Yet, despite intense experimental efforts (see Ref. [aoki2022]), the nature of the superconducting order parameter (OP) of UTe2 remains elusive. Among its numerous peculiarities, there is growing evidence that UTe2 hosts different superconducting phases as a function of applied hydrostatic pressure [braithwaite2019, thomas2020, aoki2020, ran2020, ran2021] and magnetic field [ran2019_2, knebel2019, aoki2020, ran2020, ran2021]. However, the number of superconducting transitions at ambient pressure and zero magnetic field seems to depend on sample details and is thus still debated [aoki2022].
At zero field and ambient pressure, several studies suggested that UTe2 is a chiral superconductor based on the observation of chiral surface states [jiao2020, bae2021], a gap structure with point nodes [metz2019], and a broken time reversal symmetry (TRS) in the superconducting state [hayes2021, wei2022]. Due to the presence of two distinct thermodynamic superconducting anomalies in some samples [hayes2021], UTe2 is proposed to possess two superconducting OPs. Additionally, the trainability of the polar Kerr signal with magnetic field along the crystallographic axis suggests that the product of these two superconducting OPs transforms as the irreducible representation (irreps) of the orthorhombic point group D2h [hayes2021, wei2022]. Importantly, because this point group has no multi-dimensional irreps, a description in terms of a two-component gap necessarily requires near-degenerate superconducting instabilities.
While some samples display two features in the specific heat across the superconducting transition, UTe2 crystals that display an optimal superconducting transition temperature and large residual resistivity ratios host a single thermodynamic superconducting transition, as manifested by a single jump in the specific heat [cairns2020, rosa2021]. On the one hand, this could be an indication that the two OPs condense at very close temperatures that cannot be resolved in the specific heat. On the other hand, there has been no report of broken TRS in the superconducting phase of these samples showing a single transition. As a result, the nature of the superconducting OP is still unclear.
In samples with a single superconducting transition (i.e. one jump in the specific heat), pressure splits it into two thermodynamic transitions that have opposite pressure dependence above [braithwaite2019]. For samples with two peaks in the specific heat at ambient pressure, four peaks are observed above [thomas2020]. Moreover, upon further increasing the pressure, an antiferromagnetic phase emerges [braithwaite2019, thomas2020], which contrasts with the ferromagnetic fluctuations expected at ambient pressure [sundar2019, ran2019]. The connection between this pressure-induced change in magnetic fluctuations and the pressure-induced splitting of the superconducting transitions remains unclear [ishizuka2021].
Uniaxial stress has proved to be a powerful tool to study multi-component superconductors. This technique has been used extensively to study the phase diagram and the OP of [li2020, grinenko2021]. While this material was initially thought to display spin-triplet pairing [ishida1998], recent NMR data performed under strain demonstrated it to be actually a singlet superconductor [pustogow2019].
Here we investigate the nature of the superconducting OP of UTe2 by measuring the low temperature ac heat capacity and the electrical resistivity of single crystals under uniaxial stress , and respectively applied along the [100], [110] and [001] crystallographic directions (details in the Methods section of Supplemental Materials). Our unstressed samples display a single transition according to the specific heat. We report that the value extracted from calorimetry decreases with compressive and but increases with compressive . Most importantly, we show that a symmetry-breaking in-plane shear stress does not induce any observable splitting of the superconducting transition. We discuss different scenarios to explain these results, including one in which the superconducting OP of UTe2 is single-component and another one in which the two components belong to different symmetry channels from those proposed previously [hayes2021, wei2022]. Aside from its effect on , -axis stress induces a significant piezoresistivity, presumably caused by the reduction of the energy scale corresponding to the feature observed at , which has been attributed to the of onset short-range magnetic correlations or anisotropic Kondo coherence [willa2021, kang2021, eo2021].
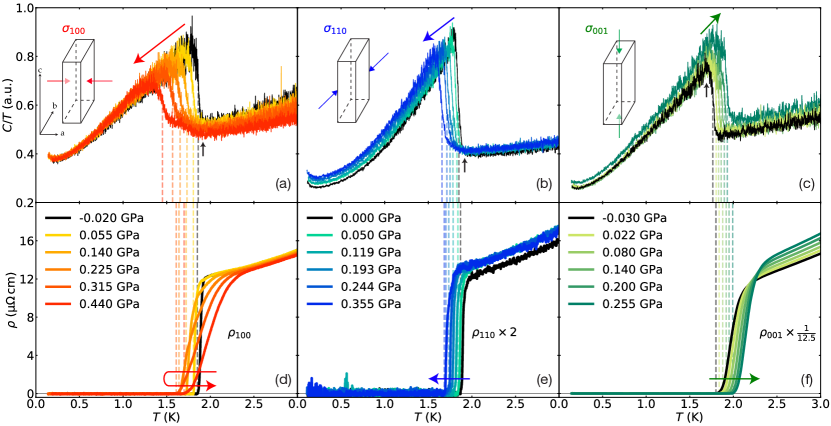
The ac calorimetry data displayed in Figs. 1 (a) - (c) show the temperature dependence of the heat capacity plotted as of three samples at the indicated , and uniaxial stress values. Note that in our convention positive means compressive strain, whereas negative means tensile. The curves at the lowest stress show a single and sharp transition at the thermodynamic superconducting critical temperature , defined as the average temperature of the sharp rise in that occurs when most of the sample becomes superconducting (dashed vertical lines). A single superconducting transition is in agreement with the characterization data of the unstressed samples (S.M. Fig. 2) and with the results of Refs. [cairns2020, rosa2021].
Figures 1 (d) - (f) show the temperature evolution of the electrical resistivity , and with current along the applied stress direction. These measurements were carried out simultaneously with ac calorimetry. For all stress and current directions, the resistivity at the lowest stress value displays a sharp transition to the superconducting state at a resistive critical temperature (below which ) that is in good agreement with the one extracted from heat capacity. The small difference between them (less than ) is easily explained by different definitions of and .
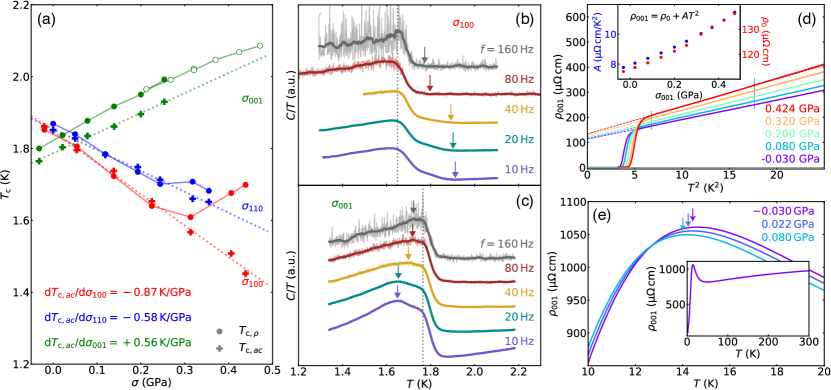
We observe two main effects upon application of compressive uniaxial stress. First, changes monotonically upon applying stress along all directions. For and , decreases with increasing stress, while increases with increasing . The evolution of and with , and is summarized in the stress versus temperature phase diagram shown in Fig. 2 (a). As expected for bulk superconductivity, the stress evolution of tracks that of for most stress values; the difference between and for will be discussed later.
Using Erhenfest’s relation, we find that the opposite trend of with (and ) as compared to is in agreement with a previous thermal expansion study [thomas2021] that reported a negative jump at in the linear thermal expansion coefficient along (and ), but a positive jump for the coefficient along the direction. These results suggest that the superconducting state observed at ambient pressure is favored by a smaller -axis length and larger -axis length. Because a U-U dimer (shortest U-U distance) in the crystal structure of UTe2 is along the axis, and uranium chains run along the axis, our results support previous theoretical arguments that the -axis dimer is key to the formation of the superconducting state in UTe2 [shishidou2021, miao2020].
The second effect of applied uniaxial stress is the appearance of a foot above for and and a shoulder below for [see Figs. 1 (a) - (b) and Fig. 1 (c), respectively]. As the number of superconducting transitions in UTe2 remains a central question [rosa2021, hayes2021], the origin of these features must be understood. It is clear from Figs. 1 (a) - (b) that the foot above for all and values coincides with the onset temperature of the superconducting anomaly of the lowest stress curve. For , the shoulder for all stress values extends above the temperature of the jump at of the lowest stress curve, as shown in Fig. 1 (c). The most likely explanation for these features is thus an inhomogeneous stress in the samples, especially in regions of the samples that extend underneath the mounting plates of the stress cell.
To test the possibility of inhomogeneous stress, we measured heat capacity at different excitation frequencies . As increases, ac calorimetry probes an increasingly smaller, more homogeneously stressed volume of the sample [li2020]. The results for and , which are the stress directions that cause the largest effects, are respectively shown in Figs. 2 (b) and (c). At the lowest excitation frequency (), the foot and shoulder features are clearly visible. As frequency increases, the position of the main heat capacity jump at remains essentially unchanged. In comparison, the shoulder and foot onset temperatures seem to progressively merge with , as expected when probing a more homogeneously stressed part of the sample. This shows that stress inhomogeneity is responsible for these two artifacts and that there is a single heat capacity jump related to bulk superconductivity at the indicated stress levels.
Our main finding is the absence of splitting of the superconducting transition for applied stress along [100], [110] and [001], as seen in Figs. 1 (a) - (c). This is especially meaningful for which, unlike and , breaks the orthorhombic symmetry of the crystal to monoclinic by lowering the point group symmetry from D2h to C2h. By expressing the stress tensor of into the basis of the main crystallographic axes, one finds , where is the in-plane shear stress and stress along the [010] direction. Because the resulting shear strain transforms as the irrep of D2h, it is expected to split the transition temperatures of the two proposed nearly-degenerate OPs [hayes2021], since their product also transforms as . The difference between the two nearly-degenerate superconducting transition temperatures is expected to follow (to leading order in the applied strain):
where is the unstressed splitting of the superconducting transition temperatures ( in our case, since a single transition is observed in the unstressed samples) and is a coupling constant (see S. M. section E for details of the calculations).
The fact that we do not observe any noticeable splitting of the superconducting transition upon application of [see Fig. 1 (b)] may be explained by different scenarios. One possibility is that the OP is different from the one proposed previously, either because there is only a single superconducting OP or because the nearly-degenerate OPs belong to symmetry channels that would not allow for a coupling that is linear in . Another possible explanation for the absence of detectable splitting of the superconducting transition induced by would be a value too small to cause any appreciable splitting for . Using the elastic tensor obtained from density functional theory (DFT) detailed in S.M. section D, we find that at that stress level, the induced would not lead to a greater than for ). In this regard, we note that, as detailed in Ref. [rosa2021], the presence of two superconducting anomalies in some unstrained samples could be related to a lower sample quality.
If UTe2 hosts a single superconducting OP, regardless of its symmetry, one expects to evolve quadratically with shear strain . From Fig. 2 (a), we see that evolves linearly with , like and , but with a different slope. This implies that the response is dominated by the symmetry-preserving stress along the main axes, and , rather than the symmetry-breaking stress . Symmetry considerations imply that should show a linear dependence on and .
From Fig. 2 (a), we determine and . Their sum gives , which upon comparison with both prior hydrostatic pressure studies [braithwaite2019, thomas2020] () and thermal expansion and specific heat () using Erhenfest’s relation [thomas2021] suggests that the evolution of under applied is smaller than that of the two other axes. Using the DFT elastic tensor shown in S.M. section D, we find that the evolution of with and cannot be explained in terms of strain along a single direction through Poisson expansion. This suggests that there is no dominant strain direction controlling in UTe2. It would be interesting to apply higher -axis stress, which seems to be tuning the system in a different direction than hydrostatic pressure [braithwaite2019, thomas2020].
Under hydrostatic pressure, the superconducting transition splits into two above , leading to a slight slope change of the lower and an initial enhancement of the higher . The latter undergoes a drastic suppression for [braithwaite2019, thomas2020] due to the emergence of a magnetic ground state. Here, the absence of splitting of the superconducting transition and the linear evolution of with uniaxial stress approaching () or exceeding this value ( and ) suggests that higher stress levels would be required to drive the system to a regime with a different ground state. However, for , starts to increase with increasing stress, in contrast to the behavior of [see Fig. 2 (a)]. In addition, the resistive superconducting transition shows substantial broadening upon application of whereas its width barely increases with and , as shown in Figs. 1 (d) - (f). This behavior was verified in another sample with applied (see S.M. Fig. 3).
For hydrostatic pressures just above , the emerging superconducting transition that splits from the main curve displays a positive as well as both an initially small signature in heat capacity and a significant broadening in resistivity [braithwaite2019, thomas2020]. A similar scenario could then take place under applied , based on the analogous resistive behavior. In this case, a stress value of could be just enough to drive the system towards the regime in which a split superconducting transition emerges. This would mean that shorter U-U distance in the chains along the axis could be a key ingredient for the enhancement of the second superconducting phase observed at high pressures. Alternatively, this effect may also be caused by the presence of filamentary or surface superconductivity. The application of higher stress would be useful to distinguish between the two scenarios, since only in the first one the higher-temperature transition observed in resistivity would be manifested in the heat capacity.
Finally, we turn to the pronounced piezoresistivity observed above for stress and current along the axis [see Fig. 1 (f)]. This effect was not observed for stress applied along the other crystal directions [Figs. 1 (d) and (e)]. By fitting the normal-state over the extended temperature range shown in Fig. 2 (d) to , we observe an enhancement, upon increasing compressive , of both the coefficient associated with electron-electron scattering and the residual resistivity . The observed enhancement of over a stress range of about is non-trivial () but smaller that the approximately factor of two increase in with applied hydrostatic pressure of [braithwaite2019] and much smaller than the increase in at a metamagnetic transition near for magnetic fields applied close to the axis at atmospheric pressure [knafo2021]. These comparisons suggest that at , the system is still away from any possible quantum critical point. Additionally, we find that the peak in around that was previously reported in Ref. [eo2021], shifts towards lower temperatures as increases, as displayed in Fig. 2 (e). This peak has been attributed to either a Kondo energy scale [kang2021] or to the onset of short-range magnetic correlations [willa2021]. The large low temperature -axis piezoresistivity could therefore be caused by the decrease of the energy scale associated with the peak in at with .
In conclusion, our combined low temperature ac calorimetry and electrical transport measurements under uniaxial stress show that the single thermodynamic superconducting transition at in UTe2 has opposite evolution under applied compressive stress () and (). This result is consistent with conclusions from previous thermal expansion studies and suggests that superconductivity in UTe2 is favored by a smaller -axis length and larger -axis length. Additionally, we observe a relatively large piezeoresistivity above for current and stress applied along the -axis, suggesting that aside from enhancing superconductivity, is responsible for a decrease in a different and yet unidentified normal-state energy scale [willa2021, kang2021, eo2021]. Applying higher values could be interesting to determine if the system can be tuned towards a different ground state. For , we observe a difference between the and values, similar to what is observed under hydrostatic pressure exceeding , where the signatures of a second superconducting phase become unambiguous [braithwaite2019, thomas2020]. Our results suggest that a stress level could be just enough to drive the system towards this regime. Finally, through the application of a symmetry breaking shear stress, , we fail to observe clear signatures for two split superconducting transitions, as one would have expected for the case of two nearly-degenerate superconducting OPs whose product transforms as . This implies either that the coupling between shear strain and the superconducting OPs is very small or that the superconducting OP of UTe2 is different from the one proposed previously. In the latter scenario, TRS breaking might be explained by the condensation of a sub-leading superconducting instability near dislocations and other lattice defects, similarly to what has been recently proposed to explain TRS breaking in Sr2RuO4 [willa2021_2]. To disentangle these different scenarios, it would be interesting to perform Kerr effect measurements as in Ref. [hayes2021] on crystals showing a single superconducting transition.
The development of ac calorimetry under uniaxial stress was supported by the Laboratory Directed Research and Development program. The remaining experimental work and crystal synthesis at Los Alamos were supported by the U.S. Department of Energy (DOE), Office of Basic Energy Sciences, Division of Materials Science and Engineering project "Quantum Fluctuations in Narrow Band Systems". JXZ (density functional theory calculations) was supported by Quantum Science Center, a U.S. DOE Office of Science National Quantum Information Science Research Center, and in part by Center for Integrated Nanotechnologies, a U.S. DOE Office of Basic Energies Science user facility, in partnership with the LANL Institutional Computing Program for computational resources. CS and AH (crystal synthesis) acknowledge support from UK EPSRC grant EP/P013686/1. RMF (phenomenological modeling) was supported by the U.S. DOE, Office of Science, Basic Energy Sciences, Materials Science and Engineering Division, under award no. DE-SC0020045.
References
- Ran et al. [2019a] S. Ran, C. Eckberg, Q.-P. Ding, Y. Furukawa, T. Metz, S. R. Saha, I.-L. Liu, M. Zic, H. Kim, J. Paglione, and N. P. Butch, Science 365, 684 (2019a).
- Aoki et al. [2022] D. Aoki, J.-P. Brison, J. Flouquet, K. Ishida, G. Knebel, Y. Tokunaga, and Y. Yanase, Journal of Physics: Condensed Matter (2022).
- Braithwaite et al. [2019] D. Braithwaite, M. Vališka, G. Knebel, G. Lapertot, J.-P. Brison, A. Pourret, M. E. Zhitomirsky, J. Flouquet, F. Honda, and D. Aoki, Communications Physics 2, 147 (2019).
- Thomas et al. [2020] S. M. Thomas, F. B. Santos, M. H. Christensen, T. Asaba, F. Ronning, J. D. Thompson, E. D. Bauer, R. M. Fernandes, G. Fabbris, and P. F. S. Rosa, Science Advances 6, eabc8709 (2020).
- Aoki et al. [2020] D. Aoki, F. Honda, G. Knebel, D. Braithwaite, A. Nakamura, D. Li, Y. Homma, Y. Shimizu, Y. J. Sato, J.-P. Brison, and J. Flouquet, J. Phys. Soc. Jpn. 89, 053705 (2020).
- Ran et al. [2020] S. Ran, H. Kim, I.-L. Liu, S. R. Saha, I. Hayes, T. Metz, Y. S. Eo, J. Paglione, and N. P. Butch, Phys. Rev. B 101, 140503 (2020).
- Ran et al. [2021] S. Ran, S. R. Saha, I.-L. Liu, D. Graf, J. Paglione, and N. P. Butch, npj Quantum Mater. 6, 75 (2021).
- Ran et al. [2019b] S. Ran, I.-L. Liu, Y. S. Eo, D. J. Campbell, P. M. Neves, W. T. Fuhrman, S. R. Saha, C. Eckberg, H. Kim, D. Graf, F. Balakirev, J. Singleton, J. Paglione, and N. P. Butch, Nature Physics 15, 1250 (2019b).
- Knebel et al. [2019] G. Knebel, W. Knafo, A. Pourret, Q. Niu, M. Vališka, D. Braithwaite, G. Lapertot, M. Nardone, A. Zitouni, S. Mishra, I. Sheikin, G. Seyfarth, J.-P. Brison, D. Aoki, and J. Flouquet, J. Phys. Soc. Jpn. 88, 063707 (2019).
- Jiao et al. [2020] L. Jiao, S. Howard, S. Ran, Z. Wang, J. O. Rodriguez, M. Sigrist, Z. Wang, N. P. Butch, and V. Madhavan, Nature 579, 523 (2020).
- Bae et al. [2021] S. Bae, H. Kim, Y. S. Eo, S. Ran, I.-l. Liu, W. T. Fuhrman, J. Paglione, N. P. Butch, and S. M. Anlage, Nature Communications 12, 2644 (2021).
- Metz et al. [2019] T. Metz, S. Bae, S. Ran, I.-L. Liu, Y. S. Eo, W. T. Fuhrman, D. F. Agterberg, S. M. Anlage, N. P. Butch, and J. Paglione, Physical Review B 100, 220504 (2019).
- Hayes et al. [2021] I. M. Hayes, D. S. Wei, T. Metz, J. Zhang, Y. S. Eo, S. Ran, S. R. Saha, J. Collini, N. P. Butch, D. F. Agterberg, A. Kapitulnik, and J. Paglione, Science 373, 797 (2021).
- Wei et al. [2022] D. S. Wei, D. Saykin, O. Y. Miller, S. Ran, S. R. Saha, D. F. Agterberg, J. Schmalian, N. P. Butch, J. Paglione, and A. Kapitulnik, Physical Review B 105, 024521 (2022).
- Cairns et al. [2020] L. P. Cairns, C. R. Stevens, C. D. O’Neill, and A. Huxley, Journal of Physics: Condensed Matter 32, 415602 (2020).
- Rosa et al. [2021] P. F. S. Rosa, A. Weiland, S. S. Fender, B. L. Scott, F. Ronning, J. D. Thompson, E. D. Bauer, and S. M. Thomas, arxiv (2021), arXiv:2110.06200 [cond-mat.supr-con] .
- Sundar et al. [2019] S. Sundar, S. Gheidi, K. Akintola, A. M. CÎté, S. R. Dunsiger, S. Ran, N. P. Butch, S. R. Saha, J. Paglione, and J. E. Sonier, Physical Review B 100, 140502 (2019).
- Ishizuka and Yanase [2021] J. Ishizuka and Y. Yanase, Phys. Rev. B 103, 094504 (2021).
- Li et al. [2020] Y.-S. Li, R. Borth, C. W. Hicks, A. P. Mackenzie, and M. Nicklas, Review of Scientific Instruments 91, 103903 (2020).
- Grinenko et al. [2021] V. Grinenko, S. Ghosh, R. Sarkar, J.-C. Orain, A. Nikitin, M. Elender, D. Das, Z. Guguchia, F. BrÃŒckner, M. E. Barber, J. Park, N. Kikugawa, D. A. Sokolov, J. S. Bobowski, T. Miyoshi, Y. Maeno, A. P. Mackenzie, H. Luetkens, C. W. Hicks, and H.-H. Klauss, Nat. Phys. 17, 748 (2021).
- Ishida et al. [1998] K. Ishida, H. Mukuda, Y. Kitaoka, K. Asayama, Z. Q. Mao, Y. Mori, and Y. Maeno, Nature 396, 658 (1998).
- Pustogow et al. [2019] A. Pustogow, Y. Luo, A. Chronister, Y.-S. Su, D. A. Sokolov, F. Jerzembeck, A. P. Mackenzie, C. W. Hicks, N. Kikugawa, S. Raghu, E. D. Bauer, and S. E. Brown, Nature 574, 72 (2019).
- Willa et al. [2021a] K. Willa, F. Hardy, D. Aoki, D. Li, P. Wiecki, G. Lapertot, and C. Meingast, Phys. Rev. B 104, 205107 (2021a).
- Kang et al. [2021] B. Kang, S. Choi, and H. Kim, arXiv:2111.08800 [cond-mat] (2021).
- Eo et al. [2021] Y. S. Eo, S. R. Saha, H. Kim, S. Ran, J. A. Horn, H. Hodovanets, J. Collini, W. T. Fuhrman, A. H. Nevidomskyy, N. P. Butch, M. S. Fuhrer, and J. Paglione, arxiv (2021), arXiv:2101.03102 [cond-mat.str-el] .
- Thomas et al. [2021] S. M. Thomas, C. Stevens, F. B. Santos, S. S. Fender, E. D. Bauer, F. Ronning, J. D. Thompson, A. Huxley, and P. F. S. Rosa, Phys. Rev. B 104, 224501 (2021).
- Shishidou et al. [2021] T. Shishidou, H. G. Suh, P. M. R. Brydon, M. Weinert, and D. F. Agterberg, Physical Review B 103, 104504 (2021).
- Miao et al. [2020] L. Miao, S. Liu, Y. Xu, E. C. Kotta, C.-J. Kang, S. Ran, J. Paglione, G. Kotliar, N. P. Butch, J. D. Denlinger, and L. A. Wray, Physical Review Letters 124, 076401 (2020).
- Knafo et al. [2021] W. Knafo, M. Nardone, M. Vališka, A. Zitouni, G. Lapertot, D. Aoki, G. Knebel, and D. Braithwaite, Communications Physics 4, 40 (2021).
- Willa et al. [2021b] R. Willa, M. Hecker, R. M. Fernandes, and J. Schmalian, Physical Review B 104, 024511 (2021b).