Sreekrishnan et al.Architectural Partitioning and Deployment Modeling on Hybrid Clouds
BITS Pilani K.K.Birla Goa Campus, Goa India-403726. Email: santonus@goa.bits-pilani.ac.in
Architectural Partitioning and Deployment Modeling on Hybrid Clouds
Abstract
The hybrid cloud idea is increasingly gaining momentum because it brings distinct advantages as a hosting platform for complex software systems. However, there are several challenges that need to be surmounted before hybrid hosting can become pervasive and penetrative. One main problem is to architecturally partition workloads across permutations of feasible cloud and non-cloud deployment choices to yield the best-fit hosting combination. Another is to predict the effort estimate to deliver such an advantageous hybrid deployment.
In this paper, we describe a heuristic solution to address the said obstacles and converge on the ideal hybrid cloud deployment architecture, based on properties and characteristics of workloads that are sought to be hosted. We next propose a model to represent such a hybrid cloud deployment, and demonstrate a method to estimate the effort required to implement and sustain that deployment. We also validate our model through dozens of case studies spanning several industry verticals and record results pertaining to how the industrial grouping of a software system can impact the aforementioned hybrid deployment model.
keywords:
Hybrid cloud; CLIC; Architectural Partitioning; Workload; Hybrid Deployment Complexity1 Introduction
Cloud Computing [17], specifically Infrastructure as a service (IaaS), is a paradigm that supplies on-demand compute capability with consumptive billing [7]. The on-demand capability consists of a set of infrastructure units over which software systems can be deployed; it can be, for example, a data center comprising of several virtual servers, physical servers, firewalls, load balancers, and storage drives exclusive dedicated for the software system. The deployment choice can also be a public cloud service such as Amazon EC2 [1] that sells on-demand compute capability on an open market. However, a public cloud customer has little control over the hardware and software infrastructure of the compute resource that is provided. A private cloud (e.g. Nebula [9, 14]) on the other hand, is typically smaller in scale and confined within an organization. Compared to a public cloud, private cloud users have more control over the cloud infrastructure.
Hybrid Cloud [23] combines a set of public clouds, private clouds, as well as high-performing bare-metal infrastructure. It provides the benefit of compute on demand like a public cloud; it also provides better overall control over the compute infrastructure and offers superior performance like a private cloud. Consider a large global enterprise with hundreds of applications developed over several years hosted on geographically scattered infrastructure. Such a deployment can become deficient due to adhoc mix-and-match of hardware and software resources over a period of time. If these applications can be transformed and redeployed on a hybrid cloud, the enterprise can realize efficiency and cost savings that arise out of best fitment of workloads with the underpinning infrastructure. This has been observed and highlighted in a recent Gartner survey [8], which predicted that the adoption of hybrid cloud as the preferred hosting model among enterprises will triple from 2015 to 2017. However, the complexities involved in adopting hybrid cloud into mainstream businesses are manyfold. One important issue is to achieve a judicious allocation of workloads across different infrastructure platforms, since inefficient partitioning of workloads across the heterogeneous systems constituting the hybrid cloud can result in violation of the system’s Service Level Agreements (SLAs). According to a Technology Business Research (TBR) market survey report [15], there is a 32% gap between expected and actual evolution of cloud-hosted workloads to hybrid environments across enterprises. This means that while the public and private cloud markets have come of age, hybrid cloud maturity has not yet kept expected pace due to various reasons.
In this paper, we propose a heuristic-driven methodology, developed from several real-life cloud based deployments for customers across industries, to achieve an advantageous partitioning of workloads across a hybrid cloud. We further propose a model to represent this partitioned deployment and demonstrate how the complexity of such a deployment can be estimated in terms of the required implementation effort.
This paper is organized as follows. Section 2 elaborates the problem description. In Section 3, we first describe a construct called the Cloud Line of Isolation and Control (CLIC) that we use as a basic architecture partitioning mechanism. We then formulate a model in Section 3.2 and Section 3.3 that measures hybrid complexity and predicts deployment effort of classes of workloads that are sought to be deployed. Section 3.2.1 presents results on how industrial characteristics affect hybrid complexity. Section 4 validates our proposed hybrid deployment model using case studies from four industries where we applied this technique to determine the contours of the hybrid deployment. Section 5 describes the related work in this area. Finally we conclude the paper and highlight future research directions.
2 Problem Description
While hybrid cloud offers benefits of deployment cost reduction, superior performance, and improved security, a confluence of heterogeneous compute platforms is seldom perfect; there are several impediments to surmount before opportunities can be exploited.
One major problem confronting evolution to hybrid environments is that complex business workloads that need to be deployed on hybrid clouds must be carefully partitioned. The partitioning technique must identify the appropriate platform on which each workload must be deployed; else the deployment will not correspond to minimalist complexity that will satisfy requirements, and hence will be inefficient and expensive. Hence the analysis and placement decision of workloads must be taken apriori. This paper is devoted to addressing this problem space. We will elaborate on this problem next.
2.1 Partitioning of Software Systems for Hybrid Environments: Major Challenges
As alluded to earlier, hybrid environments are composed of multiple cloud and traditional data centers; the cloud is typically multi-vendor and heterogeneous, comprising of private, public and community (”shared private”) deployments. While the deployment of future IT systems will turn increasingly hybrid [8], the challenge is to arrive at a topology that results in the least cost of ownership. There are many permutations of hybrid deployment architectures available that offer varying degrees of control, isolation, security and performance. One or more of these permutations is likely to offer the most advantageous fitment depending on the characteristics of various categories of component workloads.
The problem thus, is to design a deployment strategy for the service provider that apportions different workloads of a business system across a hybrid infrastructure that satisfies various non-functional requirements related to performance, security and availability, at the minimum cost of ownership. A cloud deployment, at a high level, comprises of the cloud stack (which we refer to as the “managing environment”), and the application workloads that run on target virtual machines (which we call the “managed environment”). In this paper we focus on the complexity and effort in constructing the managing environment.
An additional problem is to model the effort required to implement such a hybrid cloud based deployment, which can then be used as a prediction tool for techno-commercial decisions spanning architecture and business.
3 Building a Hybrid Deployment Model: A Structured Approach to Hybrid Partitioning
Software systems have different requirements on isolation and control. Some workload components need heavy isolation and require high architectural control compared to others.
The desire for isolation translates to tolerance for other co-located tenants. The degree of required isolation is a function of regulatory compliance requirements, performance guarantees, and security. For instance, it is a common perception that security is more compromised if sensitive workloads are hosted off-premise, which translates to a preference for storing sensitive data close to the client’s office, i.e. a requirement for stronger isolation
Architectural control, on the other hand, reflects the ability to customize the construction of the cloud management system. It may be noted that the term architectural control in the context of traditional software architecture [2] implies a set of constraints that an architect imposes on a design so as to ensure that the architectural decisions are met. In this context, the degree of required architectural control depends on the quantum of bespoke modifications that need to be incorporated into the cloud infrastructure. It could arise out of the need to exercise code level control on the cloud managing stack, the necessity to handle frequent change requests, or the need to perform heavy duty integration with complex tools like sophisticated authentication systems, service monitoring and management tools.
Note that the stipulation for a heavy isolation does not imply the necessity of high architectural control, and vice versa. Therefore, we can treat them as orthogonal entities.
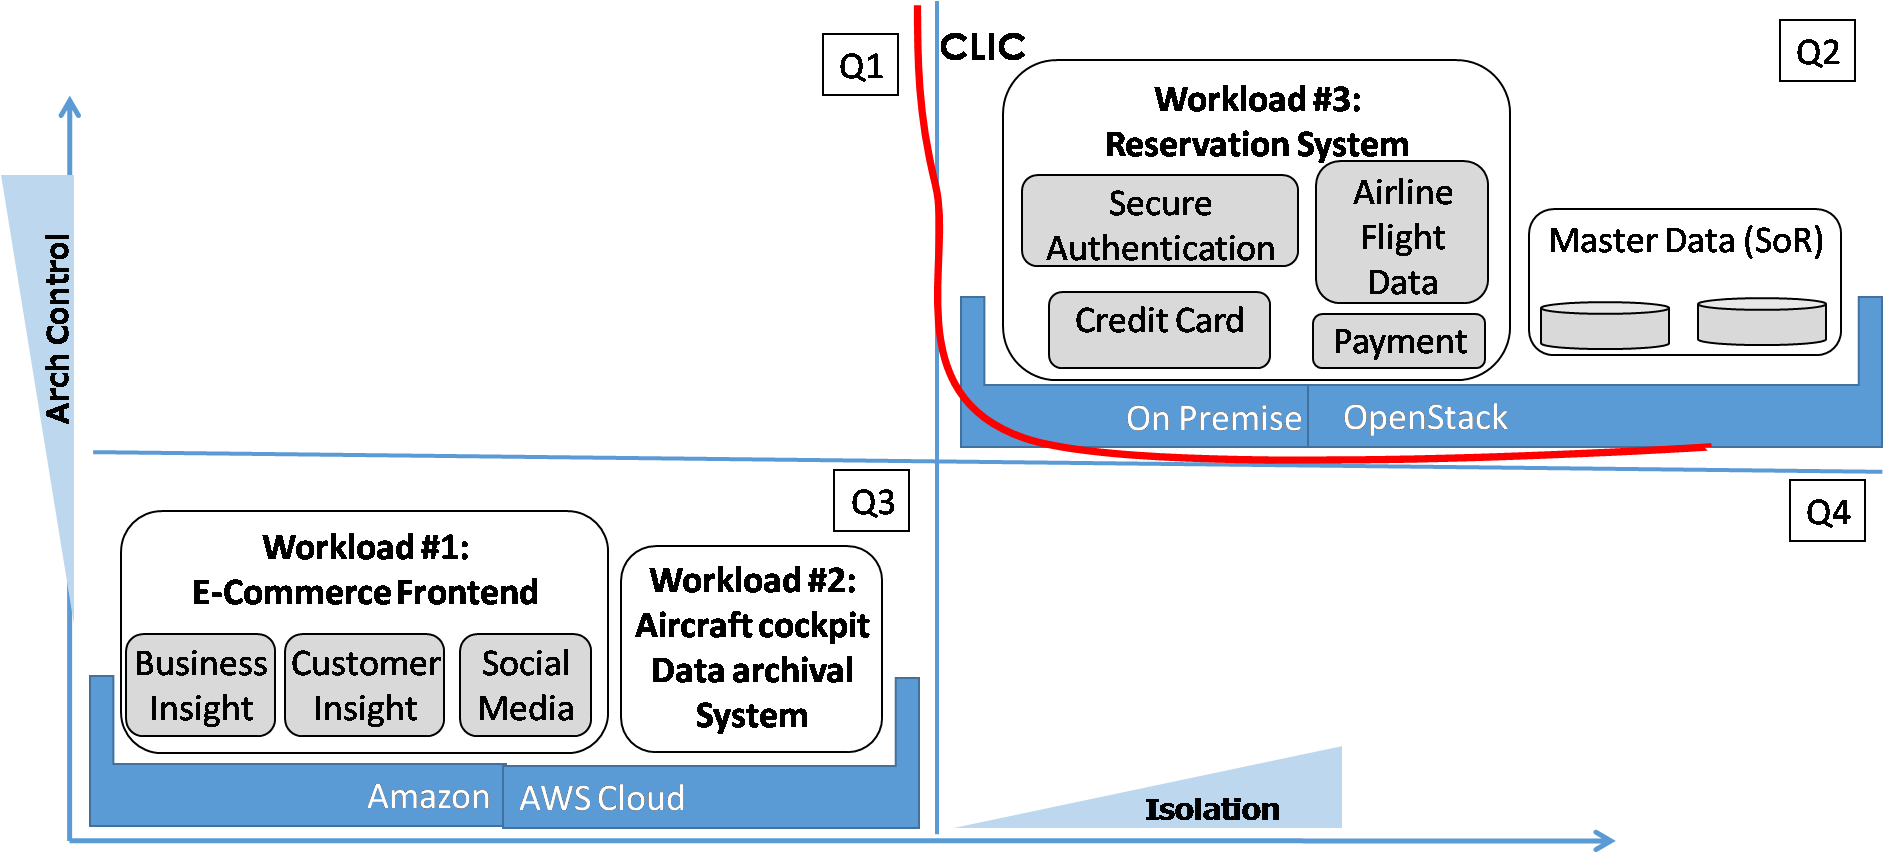
3.1 Cloud Line of Isolation & Control
In this section, we define the Cloud Line of Isolation and Control (CLIC) of a software system (comprising of a set of workloads) as the boundary that separates those workload components that demand strong isolation and control, from those that have relatively relaxed requirements.
Before explaining the CLIC and the motivation behind introducing it,
we need to explain the cloud deployment graph depicted in
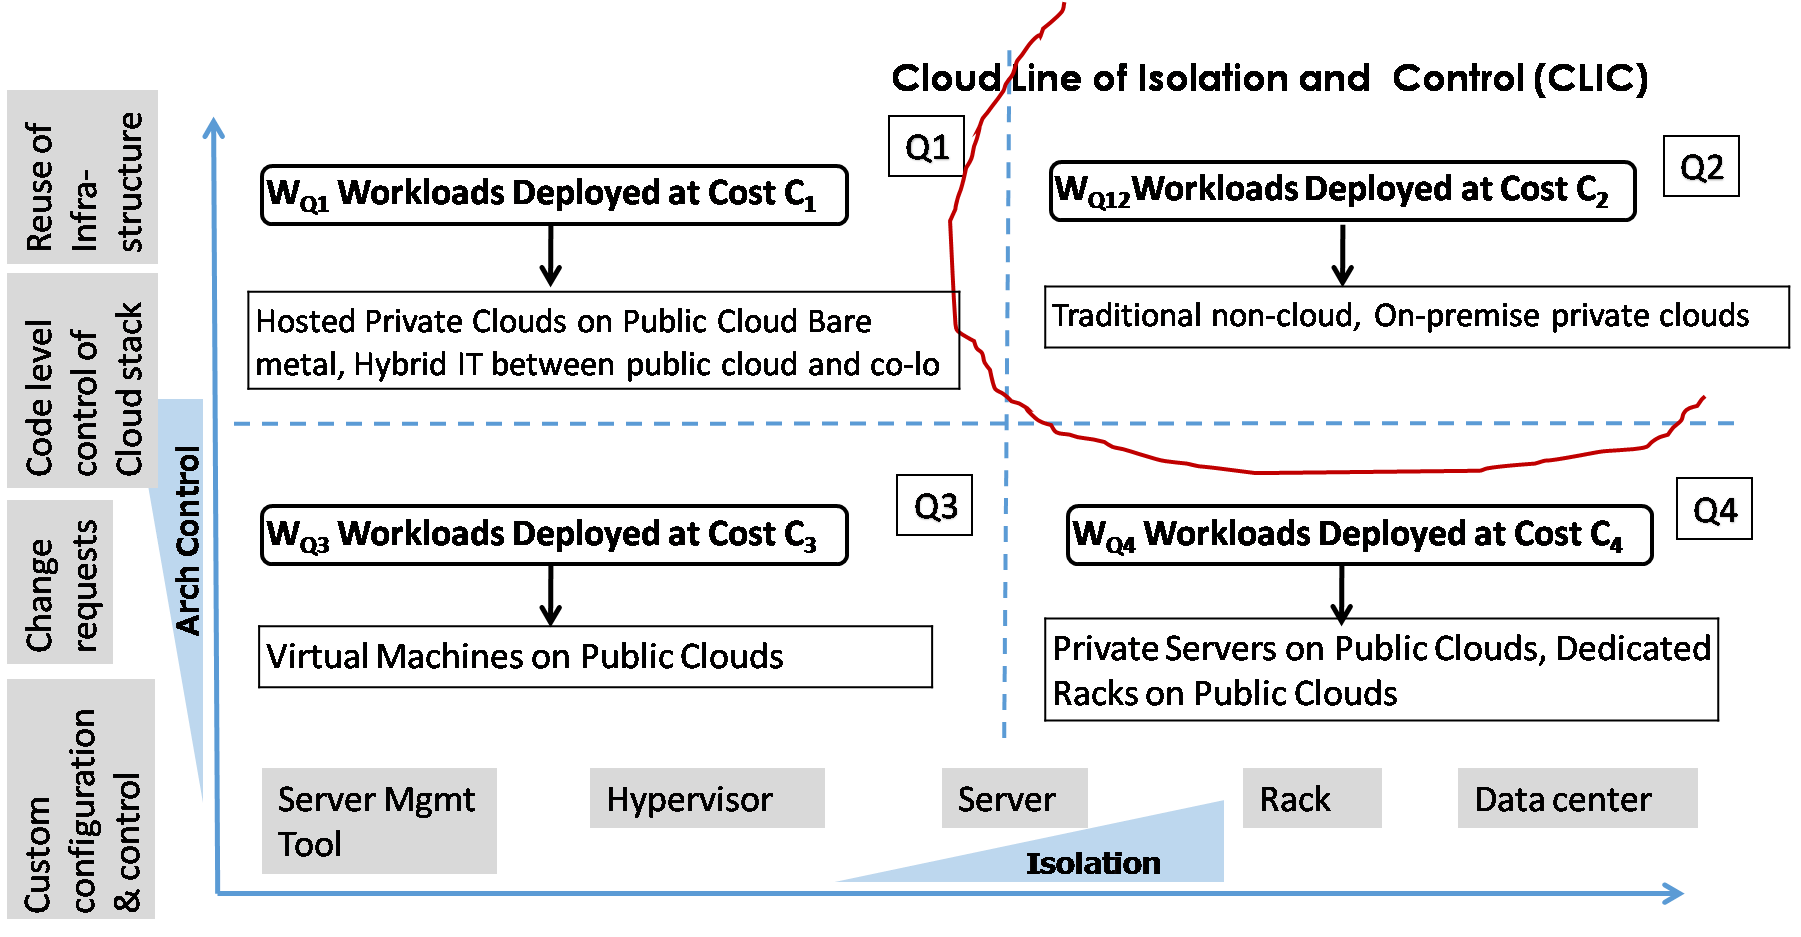
Figure 1. This graph plots the following variables:
The X-axis traces the degree of isolation required by the software
systems that are to be deployed. Assume that a set of infrastructure
resource elements are hosting virtual machines for
clients . Let each infrastructure resource element
host virtual machines to . Let these virtual
machines run a set of workloads. If all these virtual machines are
owned by the same client , the workloads hosted on these machines
are said to be isolated. If is a physical server, the isolation is
at the host level; if is a rack, it is a stringent rack level
isolation; if implies a data center, then the isolation is even
harder because the hosting facility itself needs to be dedicated for
the client in question. However, if no such tenancy requirements
exist, there is a little isolation demand on the hosted workload. Note
that the question of isolation triggers the larger “shared versus
dedicated” question and not the “on-premise versus off-premise”
question.
The Y-axis grades the degree of architectural control, which is the quantum of customization needed to build the cloud. The need for architectural control can range from merely changing certain configuration parameters of a standard cloud like AWS, to introducing deep code-level changes inside the cloud stack.
The set of feasible deployment models pertaining to each region is the third aspect, examples of which are covered inside the boxes attached to each quadrant.
The workloads of a client are first plotted on this cloud deployment graph based on their requirements on isolation and architectural control. Next, the CLIC line is used to help segment the graph into quadrants, thus separating those workloads with high isolation and architectural control requirements from the rest. The CLIC helps to quickly visualize a feasible high level approach to designing the workload deployment architecture. The workload components to the left of the CLIC are further trisected into three subcategories based on their isolation and control requirements.
3.1.1 Deployment Options
As can be seen from Figure 1, there are various feasible deployment options on both sides of the CLIC (see the text boxes embedded in the four quadrants) that are an assemblage of clouds and traditional non-cloud based infrastructure. To explain this, we take a quick tour of the graph.
We start with Quadrant #3, the most relaxed in terms of desire for architectural control, and demand for isolation. Public virtual instances on multiple public clouds are generally sufficient to host these workload components. VMs that host these portions of the overall workload are provisioned on physical servers that are shared with multiple customers. The cloud provider manages the hypervisor; hence clients do not have control over the environment other than on their virtual instances.
Quadrant #4 is harder in terms of isolation needs, but architectural control continues to be relinquished to a large extent. An example hosting route is via private virtual machines on a public cloud, where there is isolation at the server level. A private VM is deployed on a single-tenant physical server. No other customer instance gets provisioned on that same physical server, thereby assuring that this VM does not share resources with other clients. The virtualization is controlled by the provider; the customer whose instances are provisioned on the dedicated server will not be able to exert control on the managing environment.
Next is Quadrant #1, the region where workloads have low isolation requirements, but the client is not ready to relinquish architectural control. A deployment architecture that satisfies this is hosted private clouds. Such private clouds are owned, managed, and operated by external providers. An example of a hosted private cloud provider is IBM Bluebox [10]. Several single-tenant hosted options exist: off-premise private clouds, private clouds deployed on-premise, or private clouds deployed in a collocation space attached to the data center that houses a public cloud where other workload components of the system reside.
Finally, we arrive at Quadrant #2, the most stringent of the four zones. It falls on the right side of the CLIC, and this usually calls for on-premise private clouds or traditional IT hosting. However, depending on the degree of required isolation, one option is to use physical servers on demand in a public cloud. These are single-tenant bare metal servers on multi-tenant public clouds completely dedicated to a customer; no part of the server resources will be shared with other customers. Hypervisors do not come attached with the physical servers, but the client has the option to virtualize purchased servers and also to stand up a private cloud on top of the bare metal servers, which provides a high degree of architectural control over the deployment.
3.2 Modeling the Hybrid Complexity Of Workloads
We now introduce the degree of hybrid complexity of the best-fit deployment of a software system based on workload characteristics. Encapsulating the complexity of the ideal hybrid deployment of a software system in the form of a single metric is important due to two reasons: it becomes possible to represent a deployment's complexity quantitatively, which can constitute an input for architectural and business decisions; further it allows comparing the relative hybrid deployment intricacies of two or more software systems and hence helps in estimating the implementation effort and steady state delivery effort post service commencement. We will use the symbol to refer to the aforementioned degree of hybrid complexity.
3.2.1 Empirical Study
| # | Client’s IT Environment | Quadrant (in our proposed model) | # of Client Deals Analyzed | Average (Person Months) | Remarks |
|---|---|---|---|---|---|
| 1 | All workloads deployed on hosted private clouds (OpenStack atop IBM SoftLayer Cloud bare metal or VMware vRealize Cloud atop IBM SoftLayer Cloud bare metal) | 1 | 14 | 50 | Much more complex than #3 or #4, but savings accrued from cloud driven automation developed by leveraging available architectural control |
| 2 | All workloads deployed on-premise on non-Cloud environments (core banking on main frames or industrial backend software on high performance physical servers) | 2 | 15 | 120 | The environment not being software defined, could not exploit cloud-like efficiencies, so labor to run the data center was high. ’Toughest’ of the quadrants. |
| 3 | All workloads deployed on public clouds (Amazon AWS, Microsoft Azure or IBM SoftLayer) | 3 | 20 | 22 | Retail cloud hosting with no architectural control and minimum isolation. Most relaxed in terms of requirements |
| 4 | All workloads deployed on private VMs on public clouds (Amazon AWS dedicated instances or IBM SoftLayer private instances) | 4 | 11 | 45 | Infrastructure cost is high even though the hosting is similar to #3 |
In order to characterize hybrid complexity, we observed 60 client cloud deployments across different industries where the IT infrastructure was hosted on environments where the architecture was singular and not hybrid. We then categorized these deals into 4 sets based on the quadrants of Figure 1 in which they resided. For each of the four categories, we calculated the average cost () to build and run the cloud managing environment. The deployment cost comprises of:
-
1.
the cost of the BoM (Bill of Material) or the ’raw materials’ to deploy the solution; in this case the hardware infrastructure and software/middleware licensing costs to implement the cloud stack
-
2.
the cost of the effort required to implement the overall hybrid cloud stack
-
3.
the cost of managing the cloud stack during steady state operations for a one-year period, and
-
4.
the cost of automating the process of making the target environment manageable. For example, suppose that a particular business system for a given industry sector, demands improved dependability, through the infrastructure monitoring tool Nagios111https://www.nagios.org post provisioning. In such a case, the cloud stack needs to ensure that every VM has the Nagios agent running as a part of the deployment and sustenance exercise. Similarly, the service provider may also needs to take care of patching, ticketing, anti-virus etc. Also, if provisioning needs to trigger an approval workflow, the cloud stack needs to have that implemented.
All costs (including infrastructure charges) are depicted in units of person months of labor for ease of comparative calculations. This cost will enjoy a return on investment in the form of savings that will accrue in managing the target infrastructure due to introduction of cloud efficiency and associated automation.
Note that we are considering the cloud stack, which is the managing environment and not the managed environment, while computing the cost. So, in the case of public clouds (row #3 and row #4 of Table 1), the semantics of associated effort is slightly different from that for private clouds. For the former, the effort is a combination of the labor required to provision the target infrastructure via the public cloud provider's portal, develop any custom integration, and resolve cloud specific steady state issues. Thus, row #3 of Table 1 does not include any BoM cost in column #5 since the managing environment is built by the provider; row #4, however, includes a BoM component that is equivalent to the differential between dedicated and shared virtual instances on the deployed public cloud.
The result of our observations is a measure of how much each Quadrant of Figure 1 contributes to the overall complexity of a hybrid deployment. The cost depicted in column 5 of Table 1 reveals a 2:5:1:2 ratio across the four quadrants :::.
This ratio essentially implies that the deployment cost of a workload is the least in Quadrant #3; costs nearly double when deployed to Quadrant #4; and costs five times more when deployed to Quadrant #2.
We also performed another set of studies to observe the movement of deployment cost () as a function of the number of workloads in a given Quadrant. For this purpose, we collected 90 cloud deployment solutions as follows:
-
•
The chosen client cloud solutions were equally distributed across 6 industries, thus deployments each from finance, healthcare, retail, airline, telecom, and manufacturing.
-
•
They were chosen such that for solution () in each of the 6 industries, the number of workloads to be deployed in Quadrant #1 was .
-
•
We then recorded the observed person month effort (we call it ) to deploy the Quadrant #1 cloud and sustain it for one year.
We normalized this cost as follows:
-
–
In order to obtain the effort that is only due to the deployment environment, the work to perform any customization was excluded. This corresponds to the cost of automation, the last component of listed earlier in this section.
-
–
The service provider who is responsible for the deployment can have its own assets (tools, methodology, tacit or documented knowledge, skilled personnel) which can significantly impact the deployment and sustenance effort. We quantified this as a unitary metric called “asset leverage factor” (smaller means that the service provider has better assets to reduce the deployment effort) and divided the observed effort with this leverage factor. We did so, in order to obtain the effort number that is only dependent only on the quadrant and the nature of the industry, without any influence of the skill that the service provider possesses. The notion of this factor will be described later in this paper.
-
–
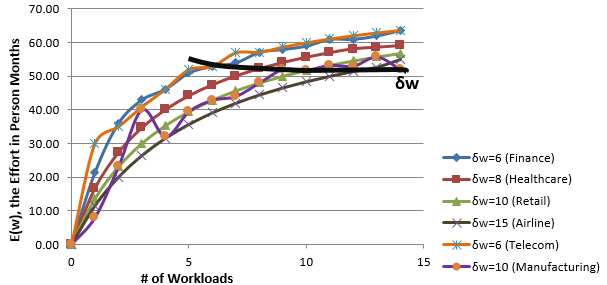
The results of our experiment are summarized in Table 2 and graphically plotted in Figure 2. The X-axis of Figure 2 marks the number of workloads to be deployed on the Quadrant #1 cloud for the chosen deals. The normalized effort estimate to deploy the hosting cloud and to sustain it for one year (in person months) forms the Y-axis. As can be seen, the effort estimate tends to an industry-dependent plateau beyond a particular number of workloads, . 222Though we focus on Q1 here, we also repeated this experiment for other quadrants and obtained similar results. We don’t include such details for brevity. This value of was recorded as the ”CLIC Constant” or for that industry. The CLIC Constant () thus decides the rate of growth of the hybrid complexity inside any quadrant of the cloud deployment graph depicted in Figure 1. As the number of workload components in a quadrant increases beyond the threshold dictated by , the effort needed to deploy and sustain the portion of the hybrid cloud deployment associated with that quadrant asymptotes to the maxima for that quadrant
Practitioners can repeat this experiment for other industries and decipher the respective based on the dominant shape of the curve for the industry in question.
To understand the implications of , let us look at the graph plots for the health care and airline industries in Figure 2. As can be seen, the for the health care industry is observed as being less than that for the airline industry. This messages the fact that the cloud stack for the health care is generally more complex to build than that for the latter, all other aspects (such as the number of workloads, their inter-quadrant distribution and custom integration requirements) remaining the same. Similarly, the for the finance industry is lesser than the for the retail industry. This means that even with a smaller number of workloads on either side of the CLIC line, the hybrid complexity of a banking solution can potentially be higher than a retail solution that has a relatively larger number of workloads scattered across the four quadrants of Figure 1.
The results from the analysis performed in this section gives rise to the following four properties that we will use to build a model for measuring hybrid complexity in the next section:
-
1.
The contribution of each side of the CLIC (Figure 1) to the hybrid complexity of the software system in question is approximately equal.
-
2.
The deployment costs (and hence the complexity) has a 2:5:1:2 ratio across the four quadrants :::.
-
3.
The rate of growth of deployment costs (and hence the complexity) asymptotes to a certain value as the number of workload components in the associated quadrant increase beyond the threshold dictated by .
-
4.
The aforementioned rate of growth and threshold depends on the industry or the sector that the workload belongs to, which can be empirically determined.
3.2.2 Hybrid Complexity
We now build a model to quantify hybrid complexity.
In Figure 1, let be the number of workload components in quadrants #1 to #4 respectively. The number of workload components to the right of CLIC = and the number of workload components to the left of CLIC =
.
This inter-quadrant distribution of aims to minimize the total deployment and management cost
where is the deployment cost of the workloads in Quadrant #i as labeled in Figure 1. We define the degree of hybrid complexity of the ideal deployment architecture (one that optimizes cost ) as follows:
where is the CLIC Constant introduced in the previous section, which depends on the class of
the workload such as its industrial grouping. The of any software system lies between 0 and 1. The larger the value of , the more hybrid is the deployment architecture of workload and more complex is the ensuing deployment. Recall that our empirical study placed the relative costs across the four quadrants in the ratio . This was used to arrive at the constants in the denominators of Equation 1; for example, the constant in the denominator of the third term is because it should asymptote to or as the number of workloads in Quadrant #3 increase beyond the threshold dictated by . Similarly, the constant in the denominator of the fourth term is because it should tend to or as the number of workloads in Quadrant #4 increase beyond .
The assignment of workloads along the four quadrants of Figure 1 does not necessarily remain constant; it could change as the attributes of the workload reshape over time. It is possible that the demands on isolation and control are service-driven or business-driven dynamically. For instance, consider a workload pertaining to incident ticket management. As the number of tickets of high severity decrease below a threshold for a certain period of time, one may decide to relinquish some notches from the existing level of architectural control. Consequently, this workload may be moved to a public cloud from a private cloud. An example of a business-driven scenario is the willingness to relax isolation requirements on a system during time intervals when commercial activity wanes, for example, during the first quarter of the year for retail vendors. In short, workloads could move from one quadrant of Figure 1 to another as a function of time. Thus Equation 1 can be more generally expressed as follows:
We will demonstrate the application of both Equation 1 and Equation 2 using case studies in Section 4.
A note on the CLIC Constant before we end this subsection. One aspect that has to be taken into account while determining is that industries often intersect. An e-commerce vendor might generate revenue via the financing route. Customers would potentially be allowed to purchase on credit and maintain running accounts on which interest is levied. Such a retail enterprise, thus, has workloads both in the retail sector and in the finance sector. The value of , thus, needs to be chosen accordingly to the workload category rather than the industrial classification of the enterprise. The retail and financial workload deployments in this example would thus be treated as separate hybrid environments with different associated s. The Government is another sector than commonly spans industries. Government IT needs to serve departments touching the breadth of the economic spectrum ranging from finance and health, to telecom and manufacturing. The value of , thus, has to be chosen appropriately based on the workload's industrial grouping rather than the enterprise's official industry classification.
3.3 Predicting Hybrid Deployment & Sustenance Effort
Deploying and sustaining a hybrid cloud is a complex and time-consuming activity. Consequently, the approach to estimate the hybrid cloud deployment and management effort has largely been ad-hoc. We have observed that the hybrid complexity measure can play a significant role in improving the estimation of deployment and management effort. We attempt to model the deployment and management effort of a set of workloads constituting a software system as:
in Equation 3, in effect, is influenced by the following:
-
1.
A constant , referred to as the complexity-to-effort constant, whose value is dependent on the hybrid cloud deployment service provider, and is determined based on prior experience, given the available level of skill and expertise of the service provider.
-
2.
An asset leverage factor (), whose value depends on the quality of internally available assets and tools that can be used to assist the service provider to automate the deployment. The smaller the value of , the more sophisticated is the assistant toolset to automate the hybrid cloud deployment in question.
-
3.
A custom work complexity factor (), whose value depends on custom work that needs to be implemented around the hybrid deployment. This includes, for example, bespoke workflows to integrate the hybrid deployment with service management tools, or custom code development to fuse hybrid cloud authentication with pre-existing access directories. Lesser the amount of required custom work, nearer is to 1.
is a necessary, but not solely sufficient component to calculate as shown in Equation 3. However, is the sole provider-independent component in the equation. The rest are either service provider-specific ( and ) or depend on custom requirements of the hybrid cloud that is being implemented ().
To calculate for the service provider applicable to our case, we randomly chose a set of hybrid cloud solutions deployed over the past one year in the organization. For each deployment, we computed its using Equation 1, and observed the actual effort expended to setup and sustain the solution for one year. We then estimated the asset maturity within the organization for the industry in question () and the custom effort required for the chosen deal (). Next we determined the value of for the deployment. We computed the overall for the service provider as the cumulative moving average of across the set of deployments. The result of the calculation is shown in Table 3.
It is prudent to periodically fine-tune the value of as past deployment data accumulates, so that currency is maintained on the epoch over which the cumulative moving average is being captured. This is because the value of is a function of time and can change as internal teams and organizational processes mature. Similarly, it is necessary to re-calibrate on a timely basis since it can change as industry-specific reusable assets get built.
3.4 Methodology to Converge on the Effort Estimate of Hybrid Deployments
We end this section by summarizing the methodology that we propose to converge on the effort estimate of the ideal hybrid deployment of a software system:
-
1.
Demarcate the set of workloads that require high levels of isolation and high levels of control; in other words, draw the CLIC contour that determines the layout of the four quadrants in the cloud deployment graph. Count the number of workloads to the right hand side of the CLIC and compute .
-
2.
For the workloads to the left hand side of the CLIC, further assess and separate them based on isolation and control requirements, into , and .
-
3.
Identify the industrial grouping of the workload that empirically determines the rate of growth of hybrid complexity as a function of the number of workloads, and ascertain the applicable (see Figure 2).
-
4.
Apply the values determined above to Equation 2 and deduce the hybrid complexity () of deploying this software system on the best-fit cloud topology.
-
5.
Apply the determined above to Equation 3 to predict the effort estimate needed to deploy and sustain the associated hybrid cloud environment.
Discovering (and the associated ) to deploy and run a software system on the best-fit hybrid cloud brings the following benefits:
-
1.
It provides a high level view of the relative work and cost estimate to deploy these workloads, and manage them during steady state operations. This in turn, yields a measure of the TCO (total cost of ownership) of the hybrid deployment in question.
-
2.
It can function as a tool to compare the relative hybrid deployment intricacies of two or more software systems.
-
3.
Designing a hybrid deployment is generally dependent on numerous variables, such as performance SLAs, adherence to a set of regulatory compliance requirements, degree of tolerance to workload collocation, as well as the perception of diminished security in off-premise systems. encapsulates all of these complexities latent in a hybrid deployment in the form of a single number. The ability to quantify the complexity in this manner allows for easier business and architectural decisions.
4 Evaluating the Hybrid Deployment Model: Application to Industrial Case Studies
In this section, we will evaluate the hybrid deployment model that we constructed above. We took three real life client examples from four industries (for a total of twelve client deals) where we had designed hybrid cloud deployment topologies. None of these client solutions were part of the data set that was leveraged to construct our model. We applied our model to predict the hybrid cloud deployment effort in each case and also observed the actual work effort that was incurred. The results and the ensuing variance are presented at the end of this section in Table 4. For ease of presentation, we chose and expanded one client example from each industry for a total of four case studies in this section, but the results for all twelve deals that we observed are presented in Table 4.
Our first case study is a software system from the retail industry, the second from financial services, the third from the health care sector, and the fourth from the airline industry. In each case, we show how we performed a workload analysis, drew the CLIC line that helped derive the hybrid deployment architecture, derived the hybrid deployment complexity , and observed predicted and actual . We also present our observations regarding the CLIC constant .
In order to explain the deployment scenario, we consider an architecture reference model of the industry associated with each example. A reference model for an industry provides sufficient information about the functional entities and their relationships in the given industry context, while remaining abstract so that it does not delve into non-essential details of specific systems belonging to the industry.
4.1 Retail Sector
Let us consider a typical online retail system. We have considered a simplified version of the reference model described in [5] and depicted that in Figure 3. Retail software can typically be classified into two main categories [5]:
-
1.
Front-end transactions before potential end-customers populate an item into the shopping cart. This includes the e-commerce portal, operations on the retailer's catalogue, and analytics to derive purchase recommendations. We call these ”above the shopping cart” processing.
-
2.
Back-end processing after an item has been added to the shopping cart. This includes order management, billing, and fulfillment. We call these ”below the shopping cart” processing.
Processing ”above the shopping cart” has to be production-grade, but action ”below the shopping cart” is mission critical. The former includes the stage when customers browse and search the retailer's catalogue, evaluate personalized recommendations, and manage accounts. The latter commences after the customer checks out the purchase, and encompasses payment and delivery.
Big retailers are reluctant to move ”below the cart” processing off-premise to a public cloud because this portion is built in a highly redundant fashion with clustered dedicated components without single points of failure. It is difficult to realize such deployment architectures on many public clouds, but possible on private clouds where the retailer can exercise high degree of architectural control. For example, a clustering solution that needs a dedicated network link to carry heartbeats is hard to implement on a multi-tenant cloud. Or if workloads are sensitive to regulation -– Payment Card Industry (PCI) compliance in this case -– it is easier to host them on a private cloud over which the retailer can impose high levels of isolation. Retail systems also maintain personal data such as customer credit card information and shipping addresses, which are sought to be stored as close to on-premise as possible.
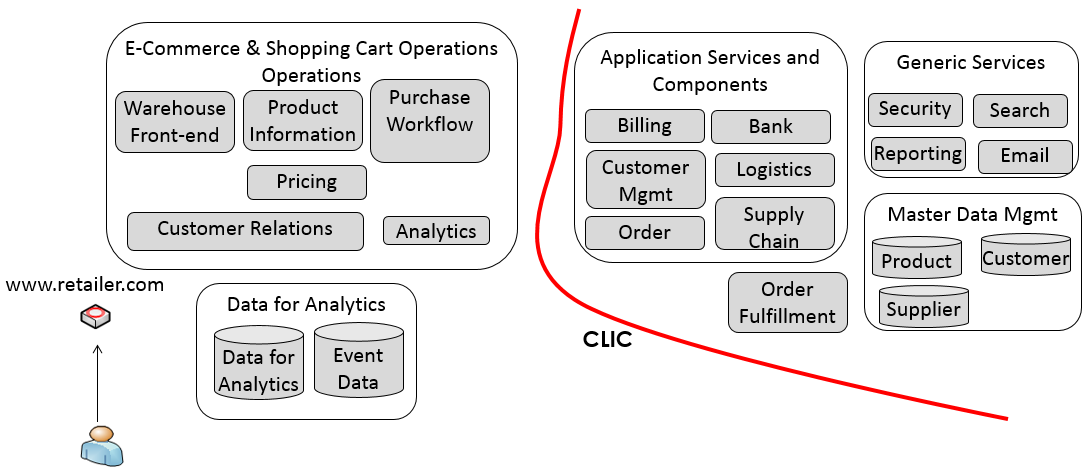
Most retailers are, however, eager to move functionality existing ”above the cart” to public clouds. In addition to being less mission critical, these functions tend to be more customer focused. For instance, a typical retail business provides users a personalized shopping experience, typically by leveraging social media and mobile devices. Such system components are comfortable living off-premise. Additionally, modern retail systems have a set of constituents that generate data-driven insights such as sales forecasts, type and timing of promotions, and pricing strategies. These systems also thrive on public cloud based infrastructure, where they heavily use MapReduce algorithms and leverage a service oriented design where application services are exposed and consumed via published APIs.
Figure 4 depicts a deployment of our retailer case study. The workloads generally conform to, but is a subset of the reference model shown in Figure 3. Workloads to the right of the CLIC (the ones that fall in Quadrant #2 of the diagram depicted in Figure 1) comprise mainly of ”below the shopping cart” software). The deployment options for these workloads are permutations of what is articulated in the box superimposed on Quadrant #2 of Figure 1. In the context of this customer, the choice was a combination of the following:
-
1.
A traditional non-cloud infrastructure to hold legacy backend retail applications running on mainframes. These were the applications that enabled financial transactions and billing.
-
2.
An OpenStack cloud region [18] deployed on-premise on the client's data center to host order fulfillment applications deployed atop an Oracle Real Application Cluster (RAC) for high availability and redundancy.
Workloads to the left of the CLIC in Figure 4 are spread across Quadrants #1, and #3. The main workload in this category was the e-commerce frontend and a recommendations engine built around a Hadoop Big Data framework. On the basis of the waxing and waning of commercial activity over the past several years, this retailer concluded that during the busy months of the year they needed architectural control at the hypervisor layer to stitch together a high availability (HA) model that provided a low Mean Time to Recover (MTTR) and high Mean Time to Failure (MTTF). This was realized by deploying a dedicated OpenStack cloud region on top of virtualized bare metal servers on the IBM SoftLayer Public Cloud [11] as depicted in Figure 4.
During the lean months of the year (primarily the first quarter from January to March), however, availability requirements could be relaxed, and consequently, hypervisor-level control was not needed. During this period, following Equation 2, workloads residing in Quadrant #1 of Figure 1, can be allowed to move down to Quadrant #3. This resulted in a simplified hosting model of wherein the workloads could be hosted on public cloud virtual instances on Amazon Web Services (AWS) [4]. This scenario is shown in Figure 5. Note that there is inter-quadrant movement in this case, but not across the CLIC line.
Development and test workloads reside in Quadrant #3 throughout the year, hosted on AWS virtual machines [5]. The customer, thus, had four kinds of workloads as depicted in Figure 3, spread across three quadrants. We applied Equation 2 to measure the hybrid deployment complexity of this software system as a function of time. Note that we empirically observed for retail workloads as in the industry plot in Figure 2.
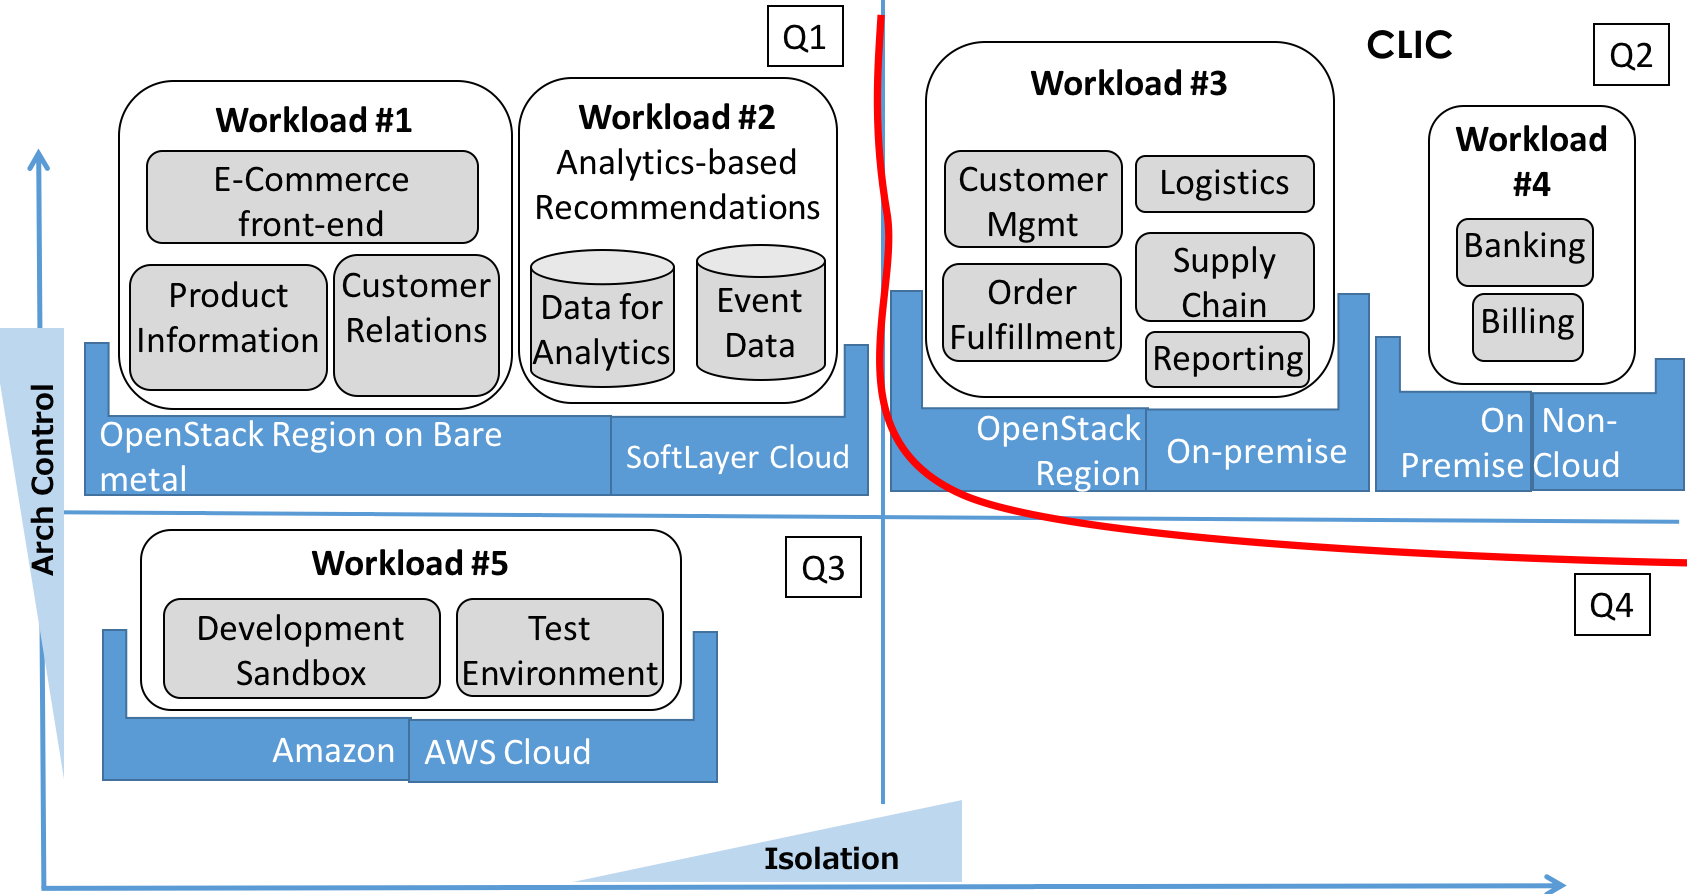
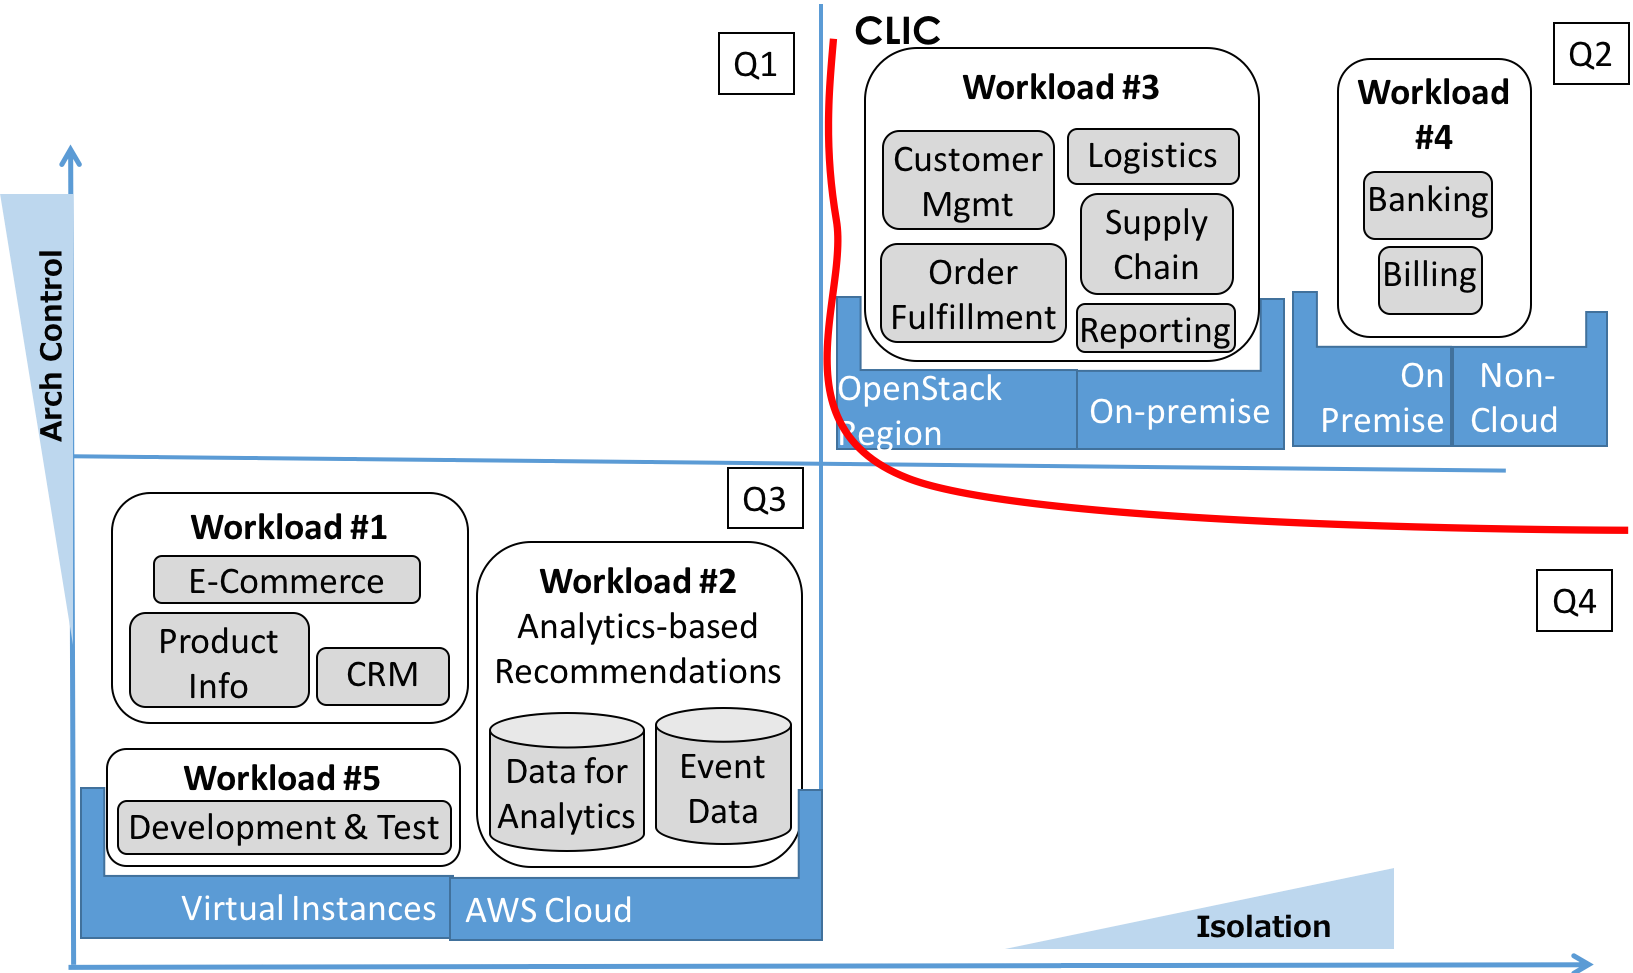
For the partitioned deployment of Figure 4, we get, .
For the partitioned deployment of Figure 5, we get, .
These numbers quantify the hybrid deployment complexity that we predict for this retail business. Note that if there are no workloads in Quadrant for a hybrid deployment, the corresponding term in Equation 1 (and Equation 2) becomes 0. Table 4 translates the calculated hybrid complexity to cost in terms of person month effort estimates; it also provides conclusions pertaining to the complexity of this retail case study relative to other case studies that we discuss in this paper.
4.2 Banking Sector
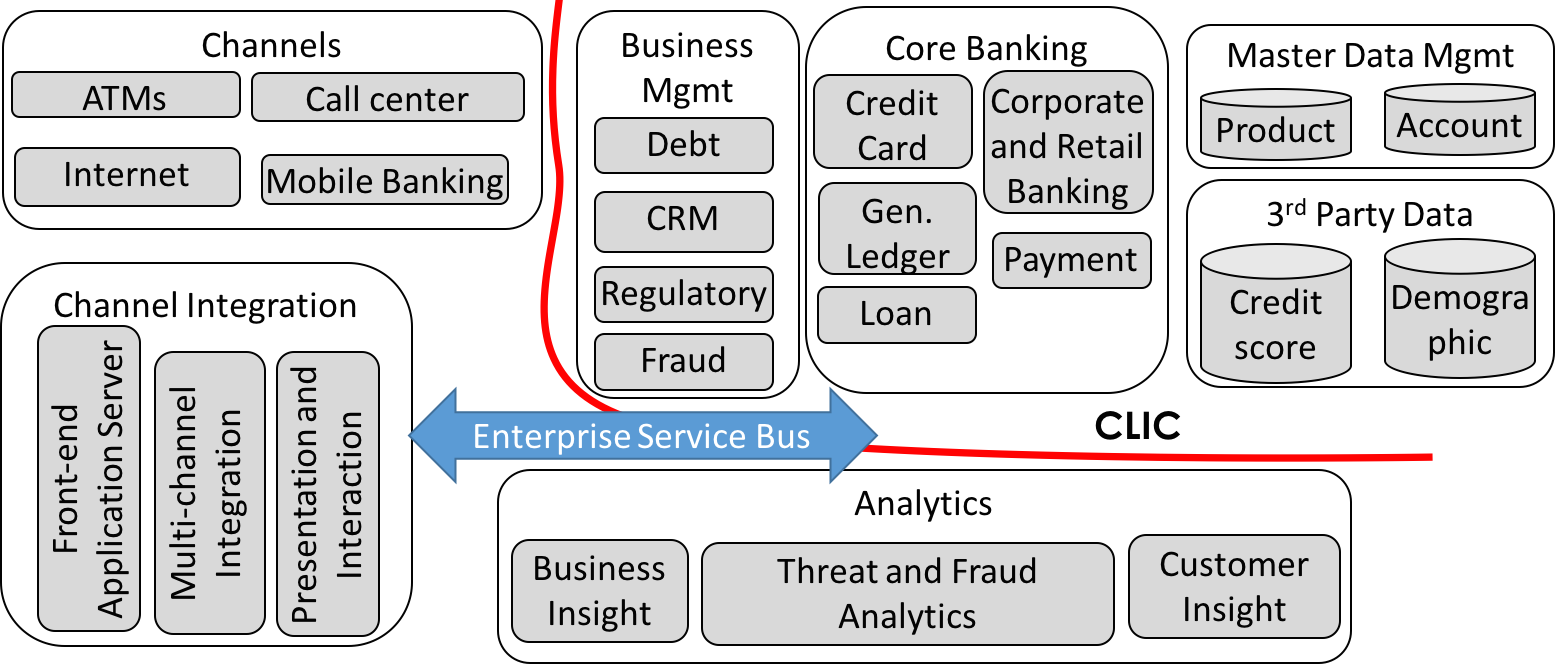
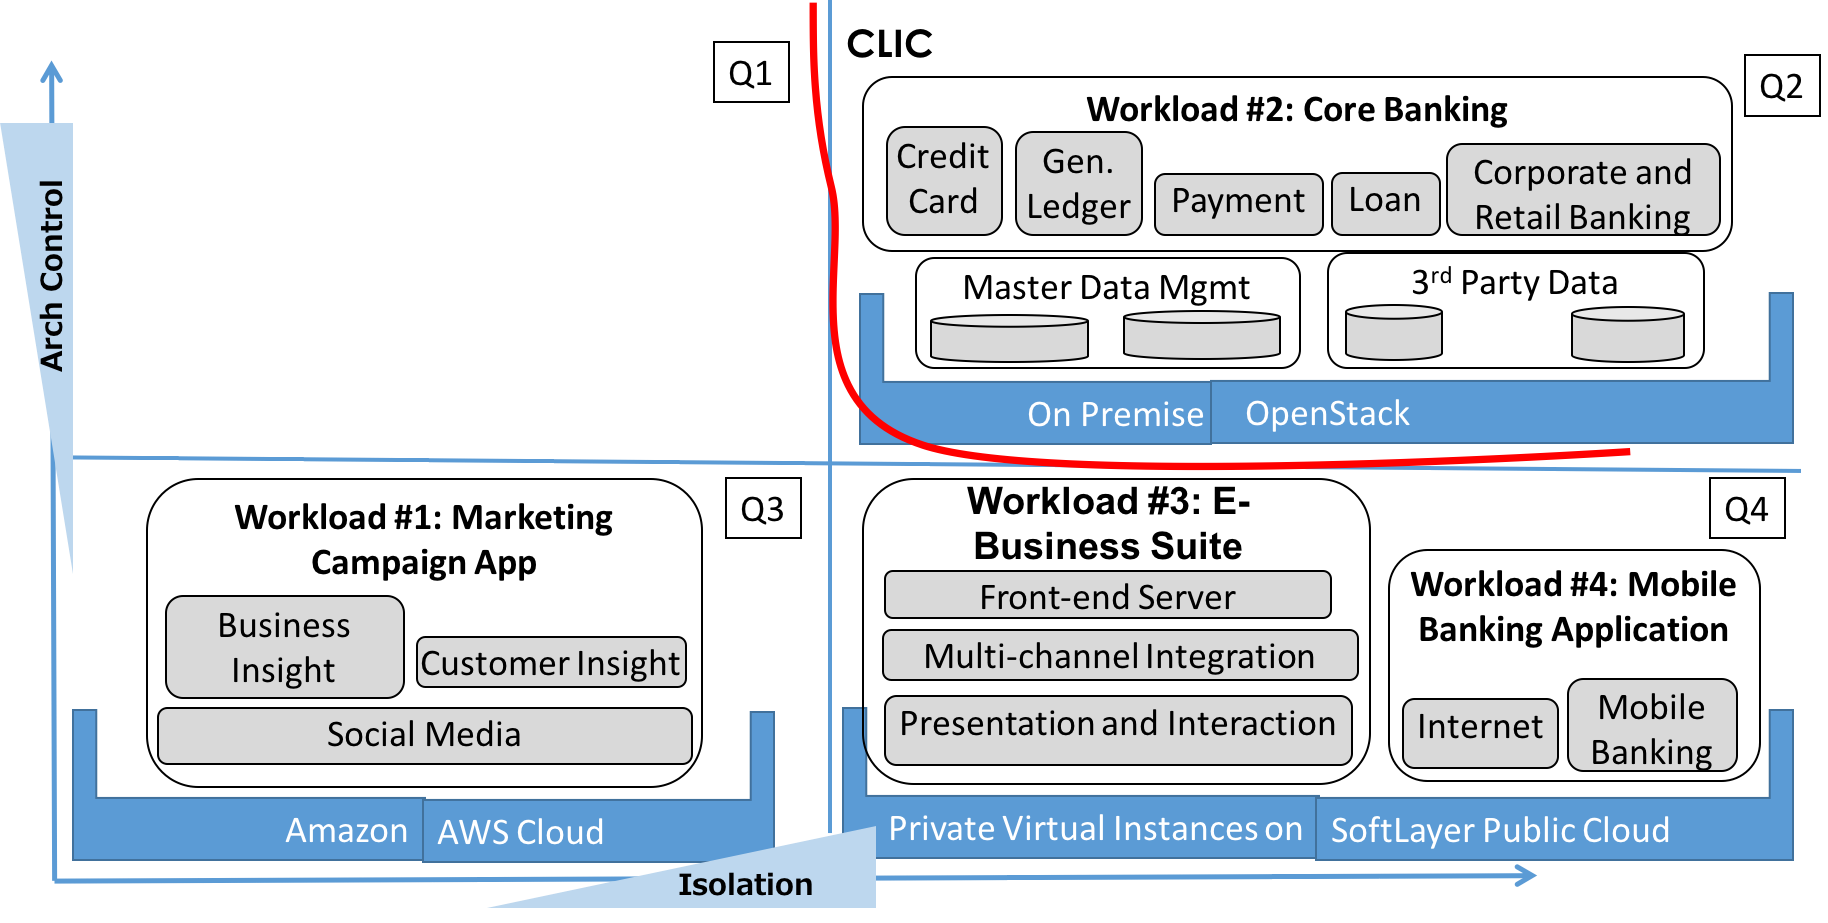
We observed that the financial industry has a natural affinity to hybrid clouds. Enterprises prefer mission critical and regulation sensitive workloads to run on private clouds where the business can exercise architectural control. Less critical production workloads are migrated to public clouds. Let us consider a generic banking sector reference architecture shown in Figure 6, which is a simplified version of the banking reference model described in [13]. Further, consider Figure 7, which depicts the infrastructure that applies to our case study. Figure 7 conforms to, but is a subset of, the reference model shown in Figure 6, and explains the hybrid cloud deployment pattern that we designed to host a bank's software system.
There are four workloads in this case comprising of three sets:
-
1.
Core banking applications are mission critical. Even a few minutes of downtime of these workloads can translate to millions of dollars of revenue and brand image loss. These applications transact with customer financial records. Regulatory requirements demand isolation for this ensemble of workloads; custom security requirements call for architectural control as well. This portion of the bank's software, thus, firmly resides in Quadrant #4. These workloads were hosted on an OpenStack-based private cloud [18] implemented on-premise as shown in Figure 7.
-
2.
Two workloads that reside in Quadrant #4 on the left hand side of the CLIC: An e-business suite centered round the bank's web portal, and an application that generates mobile alerts based on state changes reported by the core banking environment. These software components were hosted on virtual private instances on the IBM SoftLayer Public Cloud [11]. As discussed earlier, virtual private instances offer server level isolation for a customer.
-
3.
A marketing campaign application that draws insight from social media interactions. Because the analytics engine associated with this application was built around a Hadoop Big Data engine, virtual instances on a public cloud offered the most advantageous deployment infrastructure for this application.
The overall deployment architecture for the bank's software system is depicted in Figure 7. The hybrid complexity was calculated by the application of Equation 1. Note that we have empirically observed for financial workloads as in the industry plot in Figure 2.
.
4.3 Health care Sector
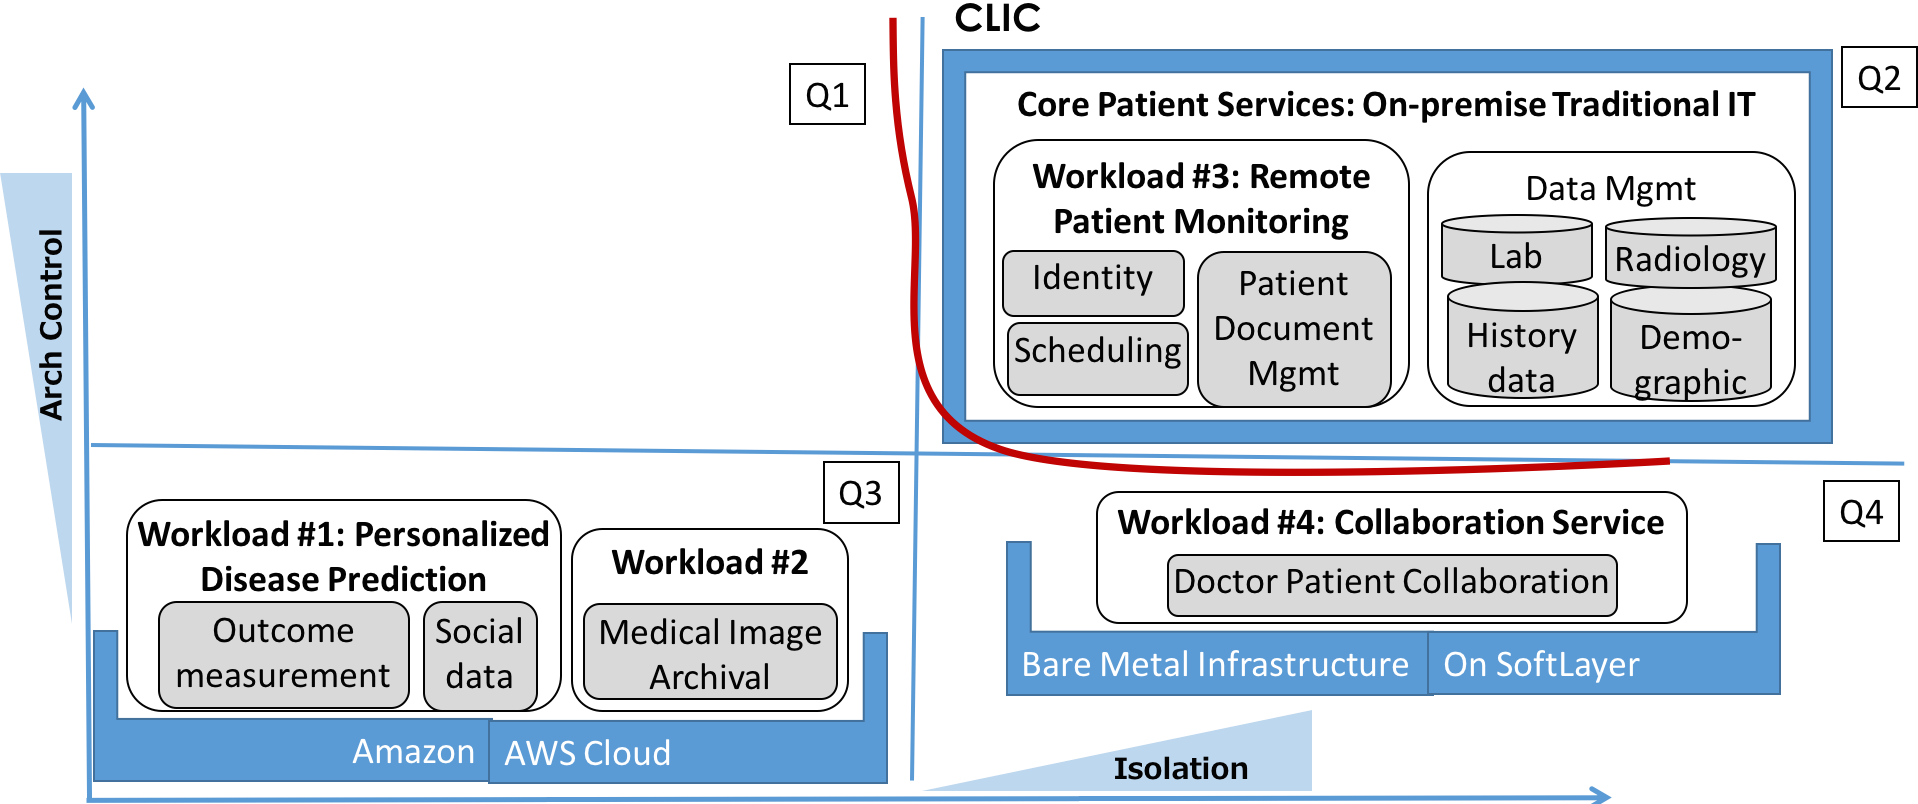
Health care is being transformed by technology, cloud, and the Internet. The use cases are many and varied: collaborative care without spatial boundaries, remote patient monitoring, medical imaging, mobile-enabled hospital management systems, and innovative and predictive Systems of Insight. Figure 8 shows the hybrid cloud deployment pattern relevant for a modern health care service. The architecture reference model shown in this figure has been adapted from [19]. The case study in question has workloads that constitute a subset of the aforementioned reference model and is depicted in Figure 9.

The client case study in question had four workloads:
-
1.
A software system that queried and monitored the patient's cardiac parameters. This software was an FDA Class-3333Food and Drug Administration (FDA) is the agency that regulates drugs and medical devices in the United States. A device is classified as Class-3 by the FDA if its failure can be life threatening; hence devices under this category are subject to the highest level of regulation. system, thus sensitive to regulation. This system falls on the right side of the CLIC and was hosted on a traditional non-cloud IT infrastructure.
-
2.
A software suite built around analytics and social media to predict and prevent diseases based on past diagnostic data, while also aiming to improve outcomes by measuring clinical results on patients. The framework on which this workload depended, lent itself to being a natural fit for Quadrant #3. This part of the overall workload was hosted on virtual instances on the Amazon Cloud [4].
-
3.
A collaboration system to remotely connect doctors and patients. Given that the stakeholders would be geographically separated, the communication needed to be rapid and secure. The latter brought in requirements on isolation, best satisfied by deployment options associated with Quadrant #4. This workload, thus, was hosted on single-tenant bare metal servers on the IBM SoftLayer Public Cloud [11].
-
4.
An archival system for storing medical images. This data was infrequently accessed and could tolerate large retrieval access times. An off-site storage that was a replacement for tape drives was the need, and hence this workload also falls on Quadrant #3. The storage solution chosen in this case was Amazon Glacier services [3].
The overall deployment architecture for the health care provider's software system is depicted in Figure 9. The hybrid complexity was calculated by the application of Equation 1. Note that we have empirically observed for health care workloads as in the industry plot in Figure 2.
.
4.4 Airline Sector
Our fourth case study is from the aviation industry, which is part of the larger transportation sector. Figure 10 describes a customer scenario where a mission critical airline reservation system that falls on the right side of the CLIC was hosted on a secure dedicated on-premise private cloud. The customer-engaging front-end portal that belonged to the left of the CLIC was deployed on the Amazon Public Cloud [4].
The hybrid complexity was calculated by the application of Equation 1. Note that we have empirically observed for the Airline sector as in the industry plot in Figure 2.
4.5 Evaluating the Hybrid Deployment Model with Results from the Case Studies
In this section, we use data from our case studies to evaluate our model expressed via Equation 1, Equation 2 and Equation 3. We apply the values we calculated for our case studies to Equation 3 and record the effort estimate that it predicts. We then compare it with the actual effort that was expended to deploy and sustain the hybrid cloud environment associated with our case studies for a period of one year.
Table 4 summarizes our findings. As mentioned earlier, we observed three application deployments from each of the four chosen industries, so the table has data points from twelve deployments. The inter-quadrant workload distribution for each client deployment is specified within brackets in column #2. The four deployments highlighted in bold are the ones that we described in detail earlier in this section. All the chosen deployments were performed by one service provider organization.
| Industry | ||
|---|---|---|
| Retail | 150 | 0.8 |
| Finance | 150 | 0.6 |
| Health Care | 150 | 0.8 |
| Airline | 150 | 0.7 |
To explain the calculations, let’s consider the retail case study that we discussed in Section 4.1 (row #1 of Table 4). As determined in Section 4.1, this client deployment yielded an of 0.29 resulting from the application of Equation 1. To apply Equation 3, we next need the two cloud service provider specific parameters, and . These values are depicted in Table 3, which contains the and values for the cloud service provider organization applicable to our experiment. was empirically determined as described in Section 3.3, whereas was estimated for each industry.
As can be seen from Section 4.1, the cloud service provider organization applicable to our case had an empirically determined value of ,
which implies that based on internal skills and processes of the service provider,
a 43 person month effort can implement and sustain a hybrid deployment having an H(w) of 0.29,
assuming lack of relevant reusable assets () and absence of custom requirements
(). Our cloud service provider, however, has an asset leverage factor of for retail cloud
deployments, which means that the availability of
reusable assets from similar earlier deals is relatively low. The custom-multiplier for this retail deployment was 0.2, which implies that the contractual custom
requirements to make the deployment infrastructure ready for the application deployment was high. If we apply these values to Equation 3 to obtain the expected
effort estimate, we get,
Person Months.
We also computed the percentage variance between the predicted sizing numbers () and the actual values that we observed post-deployment (), which in this case was (the last column of the first row in Table 4).
Our post-deployment measurements thus reveal that our method to determine the hybrid complexity of client workloads and to forecast the associated effort estimate is a reasonably accurate technique.
| # | Industry | ||||
|---|---|---|---|---|---|
| 1 | Retail (Case Study #1) | 0.29 | 0.2 | 174 person months | 10% |
| 2 | Retail () | 0.38 | 1.0 | 46 person months | 4% |
| 3 | Retail () | 0.48 | 0.8 | 72 person months | 13% |
| 4 | Finance (Case Study #2) | 0.31 | 0.2 | 117 person months | 15% |
| 5 | Finance () | 0.62 | 0.3 | 186 person months | 15% |
| 6 | Finance () | 0.77 | 0.4 | 173 person months | 12% |
| 7 | Health Care (Case Study #3) | 0.25 | 0.5 | 60 person months | 12% |
| 8 | Health Care () | 0.50 | 0.6 | 100 person months | 9% |
| 9 | Health Care () | 0.47 | 0.3 | 188 person months | 2% |
| 10 | Airline (Case Study #4) | 0.12 | 0.3 | 18 person months | 8% |
| 11 | Airline () | 0.21 | 0.5 | 44 person months | 5% |
| 12 | Airline () | 0.23 | 0.7 | 35 person months | 14% |
| Industry | # Deployments | Availability | Biz Continuity | Security | Compliance | Performance | Complexity Quotient | from Table 2 |
|---|---|---|---|---|---|---|---|---|
| Airline | 15 | M | M | L | L | M | 8 | 15 |
| Retail | 15 | M | M | M | M | M | 10 | 10 |
| Health Care | 15 | M | M | H | H | M | 12 | 8 |
| Finance | 15 | M | H | H | H | M | 13 | 6 |
| Manufacturing | 15 | M | L | H | M | M | 10 | 10 |
| Telecom | 15 | M | H | M | H | H | 13 | 6 |
4.6 Validation of
We also performed an experiment, shown in Table 5, to demonstrate that our observations and conclusions on presented in Table 2 are intuitive as well. The deployments listed in Table 5 are the same ones that we chose for our observations recorded in Table 2 (and hence Figure 2). Each row of this table grades the non-functional requirements associated with an industry, which we ascertained from actual application deployment data in that business grouping. Each cell is rated High(H), Medium(M) or Low(L) having weights of 3, 2, and 1, respectively, that combine to determine a complexity quotient for that industry. Note that each entry is the average of the characteristics of all workloads in that client deployment. As seen in the table, compliance requirements imposed on health care, finance and telecom industries are higher than say, the manufacturing industry. Similarly, the performance requirements generally expected from telecom workloads (that can have hundreds of millions of users) is more than for most other industries. We make the reasonable assumption that the complexity quotient that we observed for the target managed environment also applies to the hybrid cloud managing environment. It is logical that the larger the value of the complexity quotient, the smaller should be the value of , which is consistent with our observations. To take an example, Table 5 reveals that retail systems manifest a lesser complexity quotient than financial systems; they also empirically demonstrate a higher than financial systems. What this means is that, financial workloads yield a larger value for compared to retail workloads for a given number and spread of workloads across the four Quadrants in Figure 1.
4.7 Threats to Validity
Like any other empirical study, it is important to highlight various threats to the validity while placing confidence in the results. In this section, we comment on the threats to validity of our results under 3 different axes: construct validity, internal validity, and external validity [6].
Construct Validity implies that the dataset used for the experiment is correct. Our data is in essence, meta-data compiled while working on hundreds of client deals. Also, the data used to construct our model (Table 1 and Table 2) does not overlap with the data leveraged to verify the model (Table 4). Thus, while potential threats under this head are minimal, residual risks include the possibility of wrongly determining or for the service provider in question, and errors while empirically calculating . On the latter, our model, for the sake of simplicity, ignores the possibility of a slight variation of across the four quadrants for a given industrial grouping, and this can ripple into a slight error in predicting for some corner cases. It is also possible that the best classification of a given set of workloads is not the industry that it belong to, rather its phase in the DevOps life cycle, for example, development-test. For such cases, the corresponding will need to be experimentally deciphered by the practitioner as described in Figure 2.
Internal validity highlights the impacts of the experimental process, conditions, past history, or relationships among inputs on the observed outcome. Our sample space spans across 60 and 90 independent cloud deployment projects as described in Table 1 and Table 2, respectively. Also, these projects have cross-geography, cross-industry and cross-provider spread. The tools, methodology and the data collection mechanism used for executing these deployment projects are uniform and free from any project specific biases.
We have attempted to establish external validity by applying our findings to twelve randomly chosen case studies across 4 industries and calculating the variance of what we observed with what our model predicted. The spread of industry domains in our chosen sample set has been done to establish the generality of the approach. While we are confident of the general applicability of our model, because of the sheer diversity of real life use cases, there could be occasional divergence from what our model predicts. As we continue to test our model on new and more complex cloud deployments, we may discover the need to render it more granular to maintain accuracy in the face of wide adoption. We will continue to refine our model with future work, whose contours we lay out in Section 6.
5 Related Work
While cloud computing has been in existence for nearly a decade and has gained attention of both academia and practitioners, the notion of hybrid cloud which is an integration of private and public clouds, is a recent phenomenon. As observed in [23], early versions of hybrid clouds aimed to supplement local and private infrastructure with compute capabilities borrowed from the public IaaS, but this approach does not provide a seamless integration across compute environments. With the growing popularity of hybrid clouds, it is now all the more important that the public-private IaaS integration is seamless and transparent to the user. In order to deploy a large enterprise software intensive system on a hybrid cloud, the software architect must analyze and partition various workloads of the system onto the hybrid infrastructure leveraging a methodology such as the one we propose.
An approach by Zhang et al. [24] discusses a factoring algorithm that applies for Internet-based applications with dynamic workloads. The mechanism detects and splits workloads to ’base’ and ’trespassing’ zones when encountering load spikes. The latter zone is assumed to contain requests for a small number of unique data items that are best served on elastic public clouds Though this work is not aimed towards a hybrid deployment, the approach attempts to partition workloads.
Smit et al. [22] proposes a code partitioning method for client-facing web applications that first annotates code based on characteristics such as sensitivity to mobility. The partitioning algorithm takes these cues and apportions it onto public or private clouds.
Literature such as [21] propose improvements to decrease load imbalance in data-intensive applications running on high-performance computing systems; their focus is on tuning the way data is partitioned into chunks depending on execution times and the number of nodes in the system.
The approach described in [12] proposes a resource provisioning policy based on the workload model so as to minimize failure. The work proposes a scheduling infrastructure that can suitably allocate a workload to an infrastructure.
Kaviani et al. [16] propose a method to partition multi-tier web applications for hybrid clouds. Dependencies across the tiers are modeled, which yields suggestions on the placement of application and data tiers across public cloud or on-premise private clouds.
While literature such as [24, 22, 16] have explored workload partitioning for hybrid clouds, they are attuned to certain categories of software systems, primarily Internet-facing web applications. We present a more generic approach to architectural partitioning that is heuristically applicable across wide categories of software systems across industries. We also go a step further and propose a method to translate the architectural partitioning into deployment complexity and associated effort estimates. Also, our semantic of what constitutes hybrid IT deployment is broader than prior art, which only chooses between two alternatives: on-premise private clouds and off-premise public clouds.
6 Conclusion and Future Work
In this paper, we presented a heuristic approach to help solve the problem of rapidly determining the best-fit hybrid deployment architecture for a given complex software system. We introduced what we call the Cloud Line of Isolation and Control (CLIC) that serves as a high-level deployment-centric partitioning indicator to segment workloads based on their characteristics and requirements. We went on to propose a mathematical model to represent hybrid deployments, and a metric to measure the degree of hybrid complexity of categories of workloads. We then used this model to develop a method to predict the effort estimate to deploy and sustain hybrid cloud environments.We also drew industry-specific conclusions from data collected from various client deals across industries.
We next evaluated our model using data from twelve case studies across four industries to which we applied the hybrid cloud complexity model that we constructed. We measured the variance of predicted and observed results and verified that our model is a reasonably accurate tool to forecast the complexity and effort estimate to implement and run hybrid cloud environments.
Our approach however, has limitations. The generality of applicable workloads and the perfection of partitioning are complementary variables, so there is a fundamental limit to the precision with which both can be achieved simultaneously. In future, we plan to improve our approach by enhancing the coverage of many deployment possibilities in a hybrid hosted environment. For example, the four quadrants of Figure 1 can be refined to nine (three on each axis rather than two); and there can be multiple sub-CLIC lines that separate more of the resulting zones. Additionally, , now generalized across the deployment quadrants, could be rendered quadrant-specific. And what constitutes a workload can be laid out in a more granular fashion in terms of underpinning servers, middleware tiers and application components. The equations that we have derived to measure hybrid complexity can also correspondingly mature. Furthermore, our complexity and effort estimate models are designed for the managing environment (the cloud stack) and not the managed environment. The complexity of virtualizing and sustaining the managed environment depends on the nature of workloads and the composition of the compute, storage and network domains in the data center; it will also need to factor in aspects such as workload migration which we have not considered in this paper.
The emerging area of Cloud Service Brokerage [20] is expected to mitigate many problems attendant with consuming hybrid IT. Cloud brokerage can create and support constructs that abstract underpinning clouds, thereby delivering an integrated hybrid IT experience. We also intend to focus on this area for future research on hybrid Clouds.
References
- [1] Amazon elastic compute cloud (amazon ec2). http://aws.amazon.com/ec2.
- [2] J. Aldrich, C. Omar, A. Potanin, and D. Li. Language based architectural control. In Proceedings of the International Workshop on Aliasing, Capabilities and Ownership (IWACO), 2014.
- [3] Amazon glacier services. https://aws.amazon.com/glacier/.
- [4] Amazon web services. http://aws.amazon.com/.
- [5] F. Aulkemeier, M. Schramm, M.-E. Iacob, and J. van Hillegersberg. A service-oriented e-commerce reference architecture. Journal of Theoretical and Applied Electronic Commerce Research, 11(1):26–45, 2016.
- [6] T. D. Cook, W. Shadish, and D. Campbell. Experimental and Quasi-Experimental Designs for Generalized Causal Inference. Houghton Mifflin, 2002.
- [7] M. D. de Assuncao, A. de Costanzo, and R. Buyya. Evaluating the cost-benefit of using cloud computing to extend the capacity of clusters. In Proc. of the 18th International Symposium on High Performance Parallel and Distributed Computing (HPDC), pages 141–150. ACM, New York, NY, 2009.
- [8] J. M. Ed Anderson. Cloud adoption across vertical industries exhibits more similarities than differences. https://www.gartner.com/doc/2987617/survey-analysis-cloud-adoption-vertical. [Online; accessed 2015].
- [9] J. Fontan, T. Vaizquez, L. Gonzalez, R. S. Montero, and I. M. Llorente. Opennebula: the open source virtual machine manager for cluster computing. In Open Source Grid and Cluster Soft, volume 72, pages 1318–1331, 2008.
- [10] IBM Bluebox. https://www.blueboxcloud.com/.
- [11] IBM Softlayer. http://www.softlayer.com/.
- [12] B. R. Javadi B, Abawajy J. Failure-aware resource provisioning for hybrid cloud infrastructure. Journal of Parallel and Distributed Computing, pages 1318–1331, 2012.
- [13] M. Keen, R. Kaushik, K. S. Bhogal, A. Aghara, S. Simmons, R. DuLaney, S. Dube, and A. Allison. Case study: Soa banking business pattern. IBM Redbooks, 2009.
- [14] J. McKendrick. Nasa’s nebula: a stellar example of private clouds in government.
- [15] J. Mirandi. Hybrid cloud customer research. Technical report, Technology Business Research, Inc, 2014.
- [16] E. W. Nima Kaviani and R. Lea. Partitioning of web applications for hybrid cloud deployment. Journal of Internet Services and Applications, 2014.
- [17] NIST - National Institute of Standards and Technology, P. Mell, and T. Grance. The NIST definition of cloud computing. Special Publication 800-145, 2011.
- [18] Openstack open source cloud computing software. https://www.openstack.org/.
- [19] N. Orvis, M. Terlep, and S. Hufnagel. Healthcare SOA reference architecture. http://www.omg.org/news/meetings/HC-WS/index.htm, April 2008.
- [20] D. Plummer. Cloud services brokerage: A must-have for most organizations, 2012.
- [21] C. Rosas, A. Sikora, JosepJorba, A. Moreno, and E. C�esar. Dynamic Tuning of the Workload Partition Factor in Data-Intensive Applications. In 14th International Conference on High Performance Computing and Communications. IEEE, 2012.
- [22] M. Smit, M. Shtern, B. Simmons, and M. Litoiu. Partitioning applications for hybrid and federated clouds. In Conference of the Center for Advanced Studies on Collaborative Research, 2012.
- [23] B. Sotomayor, R. S. Montero, and I. Foster. Virtual infrastructure management in private and hybrid clouds. IEEE Internet Computing, pages 14–22, Sept 2009.
- [24] H. Zhang, G. Jiang, K. Yoshihira, H. Chen, and A. Saxena. Intelligent workload factoring for a hybrid cloud computing model. In IEEE International Conference on Web Services (ICWS), 2009.