labelname:poss#1’s
Bitcoin Returns and Public Attention to COVID-19: Do Timing and Individualism Matter?††thanks: Declaration of Interest: None.
Abstract
The evolution of the pandemic and people’s concern over it have an impact on the Bitcoin market, while the extent of individualism could differentiate investor behaviors in the financial market during the pandemic. This paper examines whether public attention to COVID-19 in individualistic countries versus collectivistic countries Granger causes Bitcoin returns between February 11, 2020 and May 09, 2022. To this end, eight large economies with a individualistic or collectivistic tradition are chosen for analyses. By using rolling and recursive-evolving algorithms, it accounts for the timing of COVID-19 issues that vary by country and circumvents the potential estimation bias that a traditional Granger causality test may suffer due largely to Google’s sampling variation for different time frames. In general, collectivistic countries are found to have stronger causal impacts on Bitcoin returns than individualistic countries.
JEL Classification: G41; G12; G15
Keywords: Bitcoin; COVID-19; individualism; Google Trends; time-varying causality
1 Introduction
Since the first known outbreak of COVID-19, Bitcoin price, at its peak, skyrocketed by more than 700%. There is evidence that the price explosion coincided with mortality caused by COVID-19 [11], but not only deaths, confirmed cases and news related to COVID-19 were also correlated with the bitcoin market [20, 27]. The evolution, particularly, a worsening prospect, of the pandemic and the exposure to its news could effectively stir up public panic. These fears towards COVID-19 were often accompanied by a drop in yield at hand, but a reversal later, and boosted transaction volume and volatility [5].
At the same time, the epidemic situation varies widely across countries due, in part, to the role of cross-cultural differences in preventive behaviors and health outcomes. More individualistic regions saw less compliance with stay-at-home orders, were more reluctant to a variety of socially optimal actions, such as social distancing, mask use, or receiving vaccine, and had more cases and/or higher fatalities (e.g., \citesMaaravi2021, Bazzi2021).
Overall, the pandemic and people’s concern over it form part of the dynamics of the Bitcoin market, while individualism and collectivism, as a cultural element, differentiate how individuals regard and react to the viral spread and corresponding measures. Thus, do individualistic and collectivistic countries differ in their influence on the Bitcoin market under the the shock of COVID-19? Despite indirectly, possible answers could be drawn from the previous studies that increases in individualism was correlated with decreases in Bitcoin price co-movements [3]; individualistic culture weakened the willingness to buy Bitcoin during the lockdown [6]. However, people’s attention and the ensuing panic depends on when COVID-19 and its variants occur and spread, particularly in their countries. This means that time is crucial to the analysis.111In addition, both the fact that testing for Granger causality is sensitive to the sample period and the underlying assumption of unchanged causality over time point towards the necessity of examining the time-varying causality in this context.
Hence, this paper analyzes the time-varying Granger causality between public attention to COVID-19 in individualistic countries versus collectivistic countries and Bitcoin returns on a daily basis. To this end, two newly-developed time-varying Granger causality tests are adopted \autocitesShi2018, and Google Search Volume Index (GSVI) data are exploited.222They are normalized indices reflecting real-time interest in a topic relative to all topic searches on Google. It allows researchers to compare trends across countries and dates, independent of the disparity in the user population. Because it is impossible to analyze every country on a case-by-case basis, I chose as a case study the United States, China, Japan, Germany, the United Kingdom, India, France and South Korea.333They are both the largest economies in the world and traditionally individualistic (collectivistic) countries. In addition, GSVI data are inconsistent across time due largely to the variation in random samples drawn by Google for different time frames [9], which could invalidate a traditional Granger causality test. With time-varying causality tests, I circumvent this issue by controlling the initialization and bootstrapping procedure to be performed over a period of three months.444I used a three-month time frame to download all the GSVI data.
2 Data and Methodology
2.1 Data Source
Daily data on Bitcoin prices from February 11, 2020 to May 9, 2022 are retrieved from Bitcoincharts.555The World Health Organization released the official name “COVID-19” on February 11, 2020. Bitcoin return is defined as . Daily attention to COVID-19 issues is measured by regional Google Search Volume Index, using the keyword “COVID”.666Using “COVID” leads to more inclusive results than using “COVID-19”. See search tips here. The data are briefly summarized in Table 1.
Country
Daily GSVI Mean
Individualism Score
Individualism
US
58.68 (2nd)
91 (highest)
UK
55.45 (4th)
89 (2 lower the US)
France
49.55 (6th)
71 (20 lower the US)
Germany
65.88 (1st)
67 (24 lower the US)
Collectivism
South Korea
56.26 (3rd)
18 (lowest)
China
42.42 (8th)
20 (2 higher than South Korea)
Japan
50.97 (5th)
46 (28 higher than South Korea)
India
43.72 (7th)
48 (30 higher than South Korea)
Notes: The scale of GSVI and individualism score is 0–100 and 6–91, respectively.
Source: Google Trends & [12].
2.2 Time-Varying Granger Causality Tests
Following \AtNextCite[22] procedure, an unrestricted VAR(p) model can be written as:
| (1) |
where is a vector of variables of interest. is a vector of constants, and is a vector of independent white noise innovations.
The Wald test of the restrictions imposed by the null hypothesis has the general form:
| (2) |
where denotes the (row vectorized) coefficients of , and R is the selection matrix. Each row of R picks one of the coefficients to set to zero under the non-causal null hypothesis.
[22] proposes three tests based on the supremum norm (sup) of a series of recursively evolving Wald test statistics to detect changes in causality.777The power of the recursive evolving procedure is found to be best, followed by the rolling procedure. The origination (termination) date of a change in causality is identified as the first observation whose test statistic value exceeds (goes below) its corresponding critical value.
The Wald statistic obtained for each sub-sample regression, using observations over with a sample size fraction of , is denoted by , and the supremum Wald statistic is defined as:
| (3) |
where for some minimal sample size in the regressions. This is the so-called recursive evolving procedure.
Let and denote the origination and termination points in the causal relationship that are estimated as the first chronological observation whose test statistic exceeds or falls below the critical value. The analysis relies on dating rules of the following two algorithms:
| (4) | ||||
where and are the corresponding critical values of the and statistics. All procedures are implemented under the null hypothesis of no causality and under the assumption of either homoskedasticity or conditional heteroskedasticity of an unknown form.
3 Empirical Results
To estimate the VAR model and implement the aforementioned tests, the Bayesian information criteria (BIC) with a maximum potential lag length of 12 are used to select the lag order. The minimum window size is set to be three months. Critical values are obtained from a bootstrapping procedure with 499 replications. The empirical size is 5% and controlled over a three-month period. Further, the Augmented Dickey-Fuller (ADF) and Phillips-Perron unit root tests suggest that Bitcoin returns and daily attention are all stationary (p-value for all).
3.1 Individualistic Countries
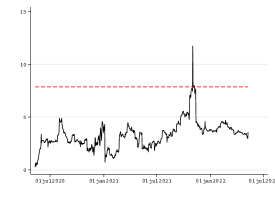
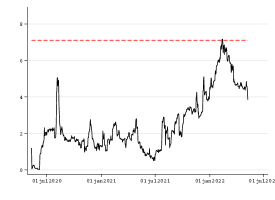
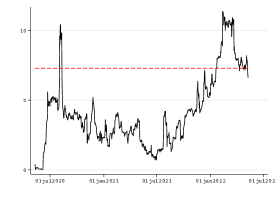
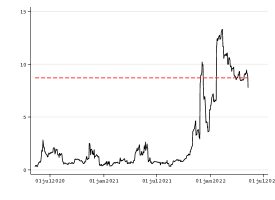
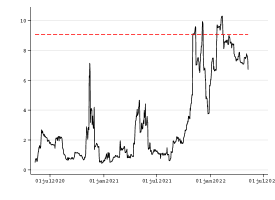
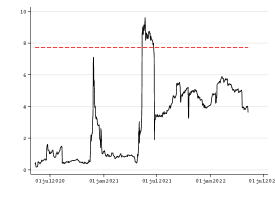
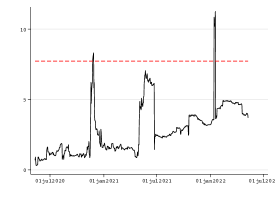
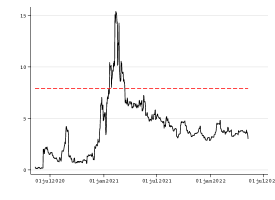
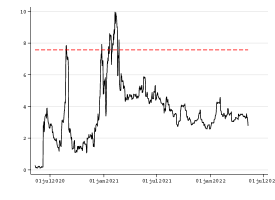
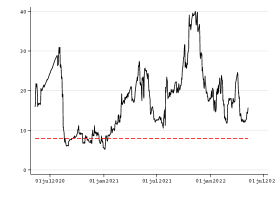
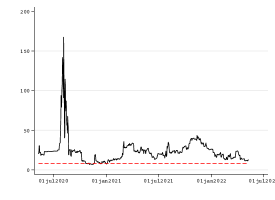
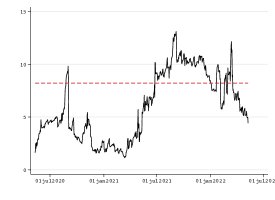
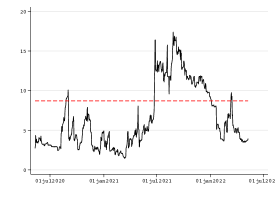
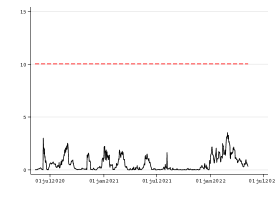
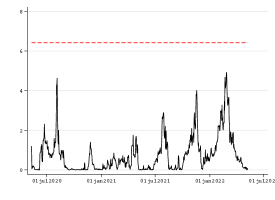
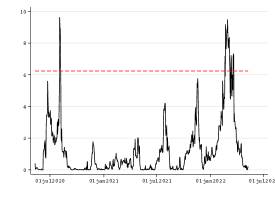
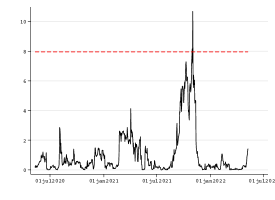
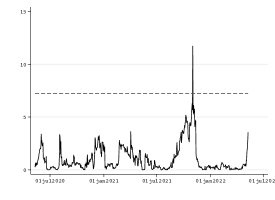
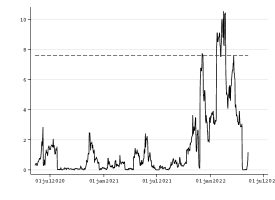
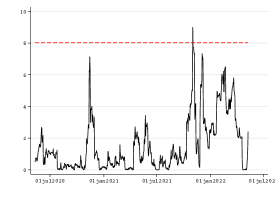
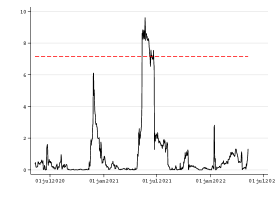
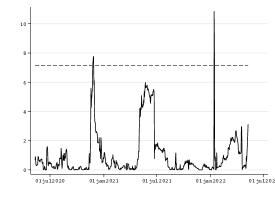
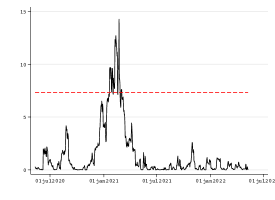
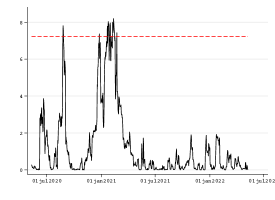
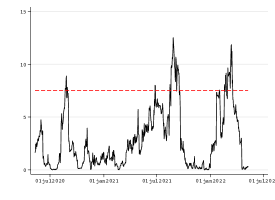
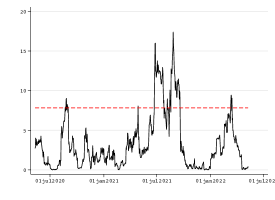
The results of the recursive evolving tests running from the public attention to COVID-19 in the US, Germany, the UK, and France to Bitcoin returns are displayed in Figures 1–4.888Test results using rolling window algorithms are reported in the Appendix. As seen in Figure 1, two Wald tests detect that no statistic sequence exceeds its corresponding critical values, indicating that the null hypothesis of no Granger causality cannot be rejected for the U.S. Whereas, in Figure 2, a very short causal episode is identified for the UK. Further, the results for Germany are inconsistent – no causality is observed in Figure 3(a), but two causal episodes are found in Figure 3(b). More importantly, the attention paid to the pandemic by people living in France had an impact on Bitcoin returns during at least two periods, among which the latest one arose on January 22, 2022 and terminated on February 14, 2022. In general, no sufficient evidence can be drawn that people’s concern over the epidemic situations in these individualistic countries has an impact on Bitcoin returns.
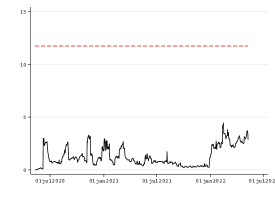

Notes: The test statistic sequence (—) is in black; the 5% bootstrapped critical value sequence (–) is in red. The selected lag order is 1.
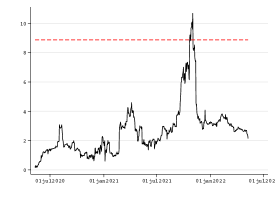
Notes: The test statistic sequence (—) is in black; the 5% bootstrapped critical value sequence (–) is in red. The selected lag order is 1.
Notes: The test statistic sequence (—) is in black; the 5% bootstrapped critical value sequence (–) is in red. The selected lag order is 1.
Notes: The test statistic sequence (—) is in black; the 5% bootstrapped critical value sequence (–) is in red. The selected lag order is 1.
3.2 Collectivistic Countries
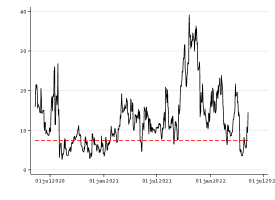
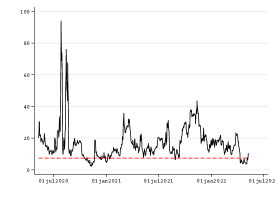
The results of the recursive evolving tests running from the attention to COVID-19 in India, China, Japan, and South Korea to Bitcoin returns are presented in Figures 5–8.999Test results using rolling window algorithms are reported in the Appendix. Here, based on two Wald tests, all the countries show at least one causal episode.101010The interpretations rely mainly on the results of the heteroskedastic-consistent test. As seen in Figure 5, the public attention to COVID-19 in India exhibits two short episodes of causality around November 24, 2020 and January 12, 2022. Similarly, China has three episodes, the longest of which began on January 19, 2021 and lasted roughly 33 days. In contrast, people’s attention to COVID-19 in Japan and South Korea is found to have much stronger impacts on Bitcoin returns, both in terms of duration and magnitude. In particular, the Japanese results are remarkable – causality existed for almost the entire sampling period. While the longest causal event for South Korea is also more persistent than other countries, with the exception of Japan. Specifically, it took place around June 21, 2021 and lasted about 196 days. Overall, collectivistic countries here show a stronger causality with Bitcoin returns than individualistic countries.
Notes: The test statistic sequence (—) is in black; the 5% bootstrapped critical value sequence (–) is in red. The selected lag order is 1.
Notes: The test statistic sequence (—) is in black; the 5% bootstrapped critical value sequence (–) is in red. The selected lag order is 1.
Notes: The test statistic sequence (—) is in black; the 5% bootstrapped critical value sequence (–) is in red. The selected lag order is 9.
Notes: The test statistic sequence (—) is in black; the 5% bootstrapped critical value sequence (–) is in red. The selected lag order is 2.
4 Conclusions
This paper adopted two novel time-varying Granger causality tests to examine the relationships between regional attention to COVID-19 and Bitcoin returns. Eight large economies with a individualistic or collectivistic tradition were chosen for analyses. Collectivist countries have been found to have stronger causality ties with bitcoin returns than individualistic countries. The findings are consistent with earlier studies (e.g., \citesCaporale2020, Chen2022). The paper adds ideas in a new light to the Bitcoin literature on individualism and COVID-19.
Acknowledgements
This research did not receive any specific grant from funding agencies in the public, commercial, or not-for-profit sectors.
Appendix: Figures

Notes: The test statistic sequence (—) is in black; the 5% bootstrapped critical value sequence (–) is in red. The selected lag order is 1.
Notes: The test statistic sequence (—) is in black; the 5% bootstrapped critical value sequence (–) is in red. The selected lag order is 1.
Notes: The test statistic sequence (—) is in black; the 5% bootstrapped critical value sequence (–) is in red. The selected lag order is 1.
Notes: The test statistic sequence (—) is in black; the 5% bootstrapped critical value sequence (–) is in red. The selected lag order is 1.
Notes: The test statistic sequence (—) is in black; the 5% bootstrapped critical value sequence (–) is in red. The selected lag order is 1.
Notes: The test statistic sequence (—) is in black; the 5% bootstrapped critical value sequence (–) is in red. The selected lag order is 1.
Notes: The test statistic sequence (—) is in black; the 5% bootstrapped critical value sequence (–) is in red. The selected lag order is 9.
Notes: The test statistic sequence (—) is in black; the 5% bootstrapped critical value sequence (–) is in red. The selected lag order is 2.
References
- [1] Samuel Bazzi, Martin Fiszbein and Mesay Gebresilasse ““Rugged individualism” and collective (in)action during the COVID-19 pandemic” In Journal of Public Economics 195, 2021, pp. 104357 DOI: 10.1016/j.jpubeco.2020.104357
- [2] Bo Bian, Jingjing Li, Ting Xu and Natasha Z. Foutz “Individualism during crises” In The Review of Economics and Statistics 104.2, 2022, pp. 368–385 DOI: 10.1162/rest_a_01107
- [3] Guglielmo Maria Caporale and Woo-Young Kang “Bitcoin price co-movements and culture” In SSRN Electronic Journal, 2020 DOI: 10.2139/ssrn.3535286
- [4] Chinchih Chen, Carl Benedikt Frey and Giorgio Presidente “Culture and contagion: Individualism and compliance with COVID-19 policy” In Journal of Economic Behavior & Organization 190, 2021, pp. 191–200 DOI: 10.1016/j.jebo.2021.07.026
- [5] Conghui Chen, Lanlan Liu and Ningru Zhao “Fear sentiment, uncertainty, and bitcoin price dynamics: The case of COVID-19” In Emerging Markets Finance and Trade 56.10, 2020, pp. 2298–2309 DOI: 10.1080/1540496X.2020.1787150
- [6] Meichen Chen, Cong Qin and Xiaoyu Zhang “Cryptocurrency price discrepancies under uncertainty: Evidence from COVID-19 and lockdown nexus” In Journal of International Money and Finance 124, 2022, pp. 102633 DOI: 10.1016/j.jimonfin.2022.102633
- [7] Zhi Da, Joseph Engelberg and Pengjie Gao “The sum of all FEARS investor sentiment and asset prices” In Review of Financial Studies 28.1, 2015, pp. 1–32 DOI: 10.1093/rfs/hhu072
- [8] Renan Diniz, Diogo Prince and Leandro Maciel “Bubble detection in Bitcoin and Ethereum and its relationship with volatility regimes” In Journal of Economic Studies, 2022 DOI: 10.1108/JES-09-2021-0452
- [9] Vera Z. Eichenauer, Ronald Indergand, Isabel Z. Martínez and Christoph Sax “Obtaining consistent time series from Google Trends” In Economic Inquiry 60.2, 2022, pp. 694–705 DOI: 10.1111/ecin.13049
- [10] Adrian Fernandez-Perez, Aaron Gilbert, Ivan Indriawan and Nhut H. Nguyen “COVID-19 pandemic and stock market response: A culture effect” In Journal of Behavioral and Experimental Finance 29, 2021, pp. 100454 DOI: 10.1016/j.jbef.2020.100454
- [11] John W. Goodell and Stephane Goutte “Co-movement of COVID-19 and Bitcoin: Evidence from wavelet coherence analysis” In Finance Research Letters 38, 2021, pp. 101625 DOI: 10.1016/j.frl.2020.101625
- [12] Geert Hofstede, Gert Jan Hofstede and Michael Minkov “Cultures and Organizations: Software of the Mind” New York: Mcgraw-hill, 2010
- [13] Yang Hu, Yang Greg Hou and Les Oxley “What role do futures markets play in Bitcoin pricing? Causality, cointegration and price discovery from a time-varying perspective?” In International Review of Financial Analysis 72, 2020, pp. 101569 DOI: 10.1016/j.irfa.2020.101569
- [14] Yossi Maaravi et al. ““The tragedy of the commons”: How individualism and collectivism affected the spread of the COVID-19 pandemic” In Frontiers in Public Health 9, 2021 DOI: 10.3389/fpubh.2021.627559
- [15] Aydin Ozkan, Gulcin Ozkan, Abdullah Yalaman and Yilmaz Yildiz “Climate risk, culture and the Covid-19 mortality: A cross-country analysis” In World Development 141, 2021, pp. 105412 DOI: 10.1016/j.worlddev.2021.105412
- [16] Peter C.. Phillips, Shuping Shi and Jun Yu “Testing for multiple bubbles: Historical episodes of exuberance and collapse in the S&P 500” In International Economic Review 56.4, 2015, pp. 1043–1078 DOI: 10.1111/iere.12132
- [17] Peter C.. Phillips, Shuping Shi and Jun Yu “Testing for multiple bubbles: Limit theory of real-time detectors” In International Economic Review 56.4, 2015, pp. 1079–1134 DOI: 10.1111/iere.12131
- [18] Ali Yavuz Polat, Ahmet Faruk Aysan, Hasan Tekin and Ahmet Semih Tunali “Bitcoin-specific fear sentiment matters in the COVID-19 outbreak” In Studies in Economics and Finance 39.1, 2022, pp. 98–110 DOI: 10.1108/SEF-02-2021-0080
- [19] Eduardo Salcedo and Manjul Gupta “The effects of individual-level espoused national cultural values on the willingness to use Bitcoin-like blockchain currencies” In International Journal of Information Management 60, 2021, pp. 102388 DOI: 10.1016/j.ijinfomgt.2021.102388
- [20] Samuel Asumadu Sarkodie, Maruf Yakubu Ahmed and Phebe Asantewaa Owusu “COVID-19 pandemic improves market signals of cryptocurrencies–evidence from Bitcoin, Bitcoin Cash, Ethereum, and Litecoin” In Finance Research Letters 44, 2022, pp. 102049 DOI: 10.1016/j.frl.2021.102049
- [21] Shuping Shi, Stan Hurn and Peter C B Phillips “Causal change detection in possibly integrated systems: Revisiting the money–income relationship” In Journal of Financial Econometrics 18.1, 2020, pp. 158–180 DOI: 10.1093/jjfinec/nbz004
- [22] Shuping Shi, Peter C.. Phillips and Stan Hurn “Causal change detection in possibly integrated systems: Revisiting the money–income relationship” In Journal of Time Series Analysis 39.6, 2018, pp. 966–987 DOI: 10.1111/jtsa.12427
- [23] Norman R. Swanson “Money and output viewed through a rolling window” In Journal of Monetary Economics 41.3, 1998, pp. 455–474 DOI: 10.1016/S0304-3932(98)00005-1
- [24] Mark A Thoma “Subsample instability and asymmetries in money-income causality” In Journal of Econometrics 64.1-2, 1994, pp. 279–306 DOI: 10.1016/0304-4076(94)90066-3
- [25] Alexandru Todea and Alexandra Maria Buglea “Individualism and stock price reaction to market-wide information” In Economics Letters 160, 2017, pp. 4–6 DOI: 10.1016/j.econlet.2017.07.028
- [26] Andrew Urquhart “What causes the attention of Bitcoin?” In Economics Letters 166, 2018, pp. 40–44 DOI: 10.1016/j.econlet.2018.02.017
- [27] Hongwei Zhang, Huojun Hong, Yaoqi Guo and Cai Yang “Information spillover effects from media coverage to the crude oil, gold, and Bitcoin markets during the COVID-19 pandemic: Evidence from the time and frequency domains” In International Review of Economics & Finance 78, 2022, pp. 267–285 DOI: 10.1016/j.iref.2021.12.005
- [28] Xun Zhang, Fengbin Lu, Rui Tao and Shouyang Wang “The time-varying causal relationship between the Bitcoin market and internet attention” In Financial Innovation 7.1, 2021, pp. 66 DOI: 10.1186/s40854-021-00275-9