Also at ]Department of Physics, Faculty of Science, Kyoto University, Kitashirakawa Oiwake-cho, Sakyo-ku, Kyoto 606-8502, Japan
Also at ]Tomonaga Center for the History of the Universe (TCHoU), University of Tsukuba, Japan
The DOSUE-RR Collaboration
Search for Dark Photon Dark Matter in the Mass Range
with a Cryogenic Millimeter-Wave Receiver
Abstract
We search for the dark photon dark matter (DPDM) using a cryogenic millimeter-wave receiver. DPDM has a kinetic coupling with electromagnetic fields with a coupling constant of , and is converted into ordinary photons at the surface of a metal plate. We search for signal of this conversion in the frequency range , which corresponds to the mass range . We observed no significant signal excess, allowing us to set an upper bound of at 95% confidence level. This is the most stringent constraint to date, and tighter than cosmological constraints. Improvements from previous studies are obtained by employing a cryogenic optical path and a fast spectrometer.
Probing the properties of cold dark matter is a crucial subject for particle physics and cosmology. The dark matter is localized in most galaxy halos, but we do not understand it can interact with other standard model particles, except for via gravity. The dark photon is one of the dark matter candidates. It has a mass () and interacts with electromagnetic fields via kinetic mixing with a coupling constant of [1]. Dark photon as dark matter (hereafter DPDM) in the mass range around is predicted to exist in the context of high-scale inflation models [2] and a part of string theories [1]. Cosmological observations give constraints in this range, with [1]. However, the constraints set by direct searches have still not covered the wide mass range [3].
DPDM is converted to ordinary photons through the kinetic mixing at the boundary of any change in the medium [4], e.g., at a metal surface. To use this characteristic, a methodology was suggested for searching for DPDM using an antenna [5]. Then, the methodology using a metal plate was established by [3]. Because the speed of DPDM () is very small compared with the speed of light (), the direction of the conversion photons is almost perpendicular to the surface of the plate within [6]. The conversion photons should be observed as a peak in the frequency spectrum. The peak frequency () corresponds to the mass of the DPDM because of energy conservation, i.e., , where is the Planck constant. The ratio of the peak width to the peak frequency is approximately [7].
The power of the conversion photons, , is given by [5, 3],
| (1) | |||||
where is the effective aperture area of the antenna, is the energy density of the dark matter in the Galactic halo [8], and is a coefficient related to the polarization of the DPDM, which we assume has a random orientation for, i.e., [5].
A previous study searched for DPDM in the mass range [3] and set an upper bound of . In this paper, we perform a similar experiment in a different mass range, , with an improved experimental setup.
Our experimental setup is shown in Fig. 1. We use a cryogenic millimeter-wave receiver. DPDM is converted into ordinary photons at the lower surface of the aluminum plate. The conversion photons are detected by a horn antenna kept under cryogenic conditions, and the signals are amplified with both a cold low-noise-amplifier (C-LNA) and a warm one (W-LNA). The frequency spectrum is then measured using a signal analyzer.
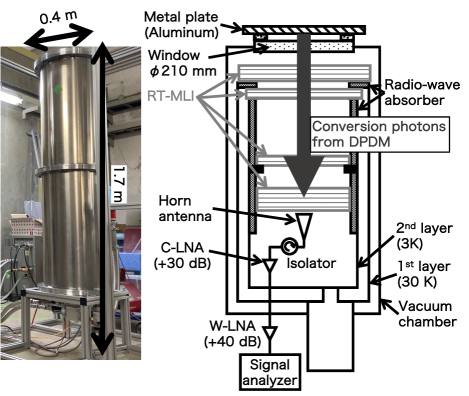
To minimize the thermal noise entering the antenna, the off-axis directions from the signal are surrounded by radio absorbers kept under cryogenic conditions. We used radio-transparent multi-layer-insulation (RT-MLI [9]) to mitigate thermal radiations from the outside. We succeeded in achieving 3 K and 30 K at each layer in the cryostat. As a result, the noise temperature () was approximately half that in the previous study whose optical path was at ambient temperature [3]. In addition, a recent spectrum analyzer allows us to increase the data-taking speed by 150 times.
A receiver gain and an offset from the receiver noise were calibrated by using two blackbody sources in place of the metal plate [10]. The blackbody sources (ECCOSORB CV3) are maintained at two temperatures: in the liquid nitrogen bath and room temperature as monitored (290 K). We measured the frequency spectra at each blackbody temperature and we obtained the gain spectrum as a ratio between the difference of the measured spectra and the difference of the input powers. The measured gains were typically . The offset spectrum corresponds to the power at zero input signal from the outside, which was also calculated using these two measurements. The offset powers are typically with a frequency bin width of .
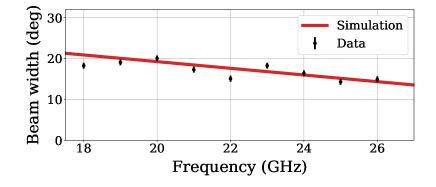
Understanding the responsivity of the antenna as a function of angle from the line of sight (hereafter beam) is important for calculating (the effective aperture area of the antenna) as well as (the fraction of the solid angle of the beam facing the blackbody sources in the calibration). The beam-width measurement was performed at room temperature separately from the DPDM search using an artificial source by combing a high-frequency signal generator (KEYSIGHT E8257D), a frequency multiplier (ERAVANT SFA-203403205-KFSF-S1), and the identical horn antenna with the receiver. Figure 2 shows the measured beam width (full width at half maximum) as a function of frequency (). We confirmed that the results reproduced those from a 3-dimensional electromagnetic simulation using ANSYS-HFSS. The remaining difference is considered to be the systematic error. From the validated simulation, we obtained with negligible frequency dependence. Similarly, we obtained for the input power calculation from the blackbody sources.
We took data in the frequency range , corresponding to . The lower and upper frequency edges were determined by the cutoff frequency of the antenna and the capability of the signal analyzer, respectively. The signal analyzer was able to simultaneously take spectral data for a limited frequency range of with the resolution band width set to . There were 32,769 data points in each data chunk for the range, i.e., the frequency interval was .
Our initial data were taken from November 29 to December 10, 2021. The time to accumulate the data for each chunk () was set to 2 seconds. We shifted the center frequency by after taking 12 chunks of data for each frequency region. In total, we took 51,000 data chunks in 4,250 frequency regions. Regions that overlapped with the neighboring frequency region were used to estimate the statistical error in the analysis. We performed the gain calibration before and after each data acquisition. The time intervals between the calibrations were typically 40 minutes.
As described later, we obtained small values of below in 27 frequency regions. Here, is the local -value for the zero-signal hypothesis. For further investigation with more statistics, we took additional data with ten times longer accumulation, i.e., seconds, for these regions on January 17, 2022.
We also prepared “null samples” using the calibrated data. We divided the 12 data chunks into two groups for each frequency region and subtracted one from the other. These differential samples did not contain a DPDM signal but did contain uncorrelated noise. There were 462 combinations for the null samples. Null samples have been widely used in analyses of the cosmic microwave background [11, 12]. We used null samples for optimizing analysis bin width of the spectrum (), validating the statistical significance, and checking systematic uncertainties. In the raw data, each data point has a correlation with neighbor points. We mitigated it by re-binning the data points.
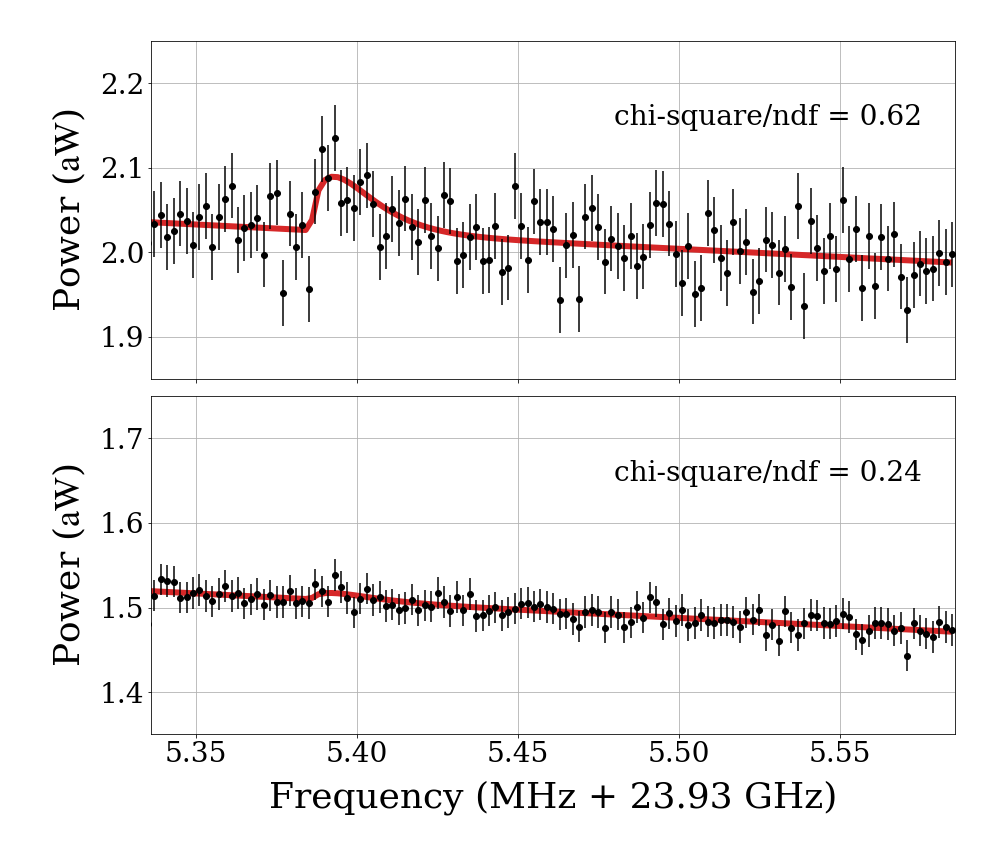
Figure 3 shows the measured spectra in one of the frequency ranges after the calibration and re-binning. We extracted the power of the conversion photons () by fitting for each , i.e., for each . The fitting function at consisted of a signal, , and the background which was a one-dimensional polynomial, ,
| (2) |
is a difference in the cumulative functions, which was introduced to account for the effect of the finite bin width,
| (3) |
The cumulative function was calculated using the following equation with the DPDM velocity and speed, ,
| (4) | |||||
| (5) |
where is its velocity distribution, is the circular rotational speed of the Galaxy, and is the velocity of the Earth in the frame of the Galaxy. We assumed a Maxwell-Boltzmann distribution for [13]. We also assumed , as in many dark matter searches [14, 15, 16, 17, 18]. The width of was approximately , following from the above. Further details on the signal distribution were described in [3].
We varied the peak frequency from to in a small steps of , and performed a fit with floating , , and , in the frequency range from to , as shown in Fig. 3. We calculated the standard deviations of the data for the regions below and above the fit range, and their average was assigned to be the error associated with each data point in the fit.
Before the above signal extraction, we performed fits to the null samples in the same manner. For each null sample at each frequency, we obtained , the error , and their ratio . We obtained a zero-consistent mean value for the distribution of , as expected, and we did not observe any frequency dependence. Thus, the normalized distribution of the ratios, , was used to estimate the local -values for the zero-signal hypothesis [19],
| (6) |
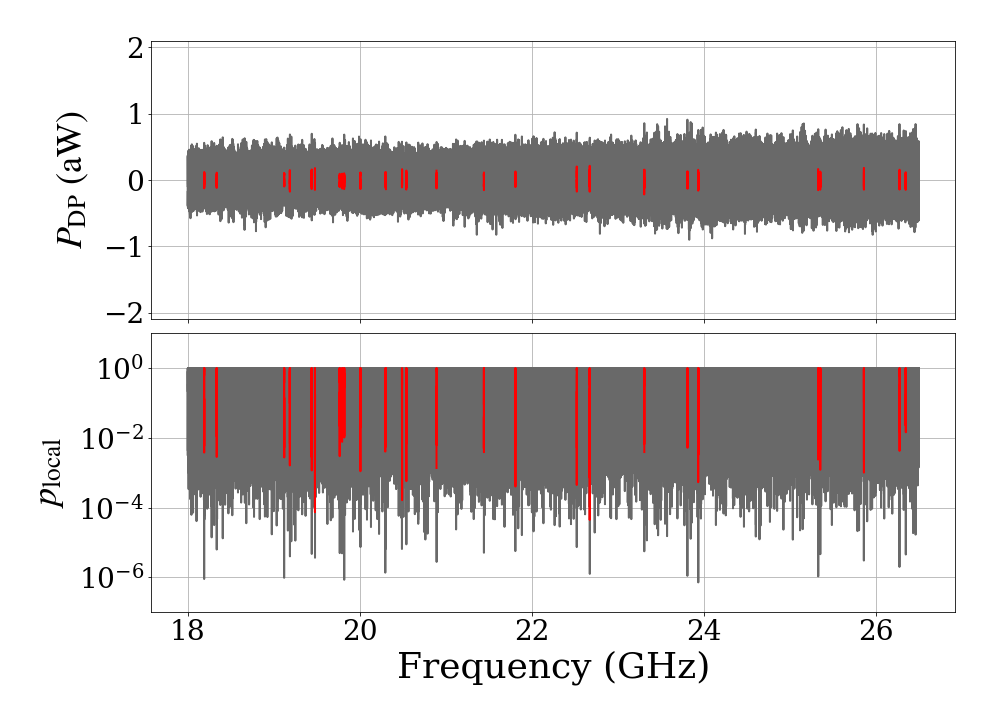
Figure 4 shows the extracted at each frequency and their . The minimum value was at . Adopting a methodology similar to those in previous studies [3, 20], we accounted for the look-elsewhere-effect. We determined the number of independent frequency windows () using the null samples. The probability of exceeding at any frequency was estimated as,
| (7) |
We did not observe any significant excess of the DPDM signal from zero.
In the initial data set, we found 27 frequency regions with . To obtain a more robust conclusion, we additionally took data for these regions giving 11 times more statistics. As shown in the bottom plot in Fig. 3, we obtained zero-consistent results at the frequency with the minimum -value in the initial data set. In the other regions, we obtained less significant -values () as shown in Fig. 4. We conclude that there is no significant signal from DPDM in this search.
The systematic uncertainties associated with the coupling constant are summarized in Table 1. The uncertainty from was estimated from the difference in the beam width between the calibration and simulation. The uncertainty assigned to the gain conservatively includes the maximum variation across all the gain calibration intervals during the experiment (3.4%), the difference in between the calibration and the simulation (1.9%), and uncertainties of the source temperature and emissivity (). A possible fitting bias due to the frequency binning was estimated using the simulation. For the instrumental alignment, the tilt of the plate to the antenna was at most . The alignment contributes only a small systematic error to because the beam width is large as shown in Fig. 2. The uncertainty related to the direction of the conversion photons was similarly obtained. For the dark matter density, we used the uncertainty described in [8].
| Source | () |
|---|---|
| Effective aperture area () | 4.2 |
| Gain | 4.0 |
| Frequency bin | 0.6 |
| Alignment of instruments | 0.1 |
| Direction of conversion photons | 0.1 |
| Dark matter density () | 3.9 |
| Total | 7.0 |
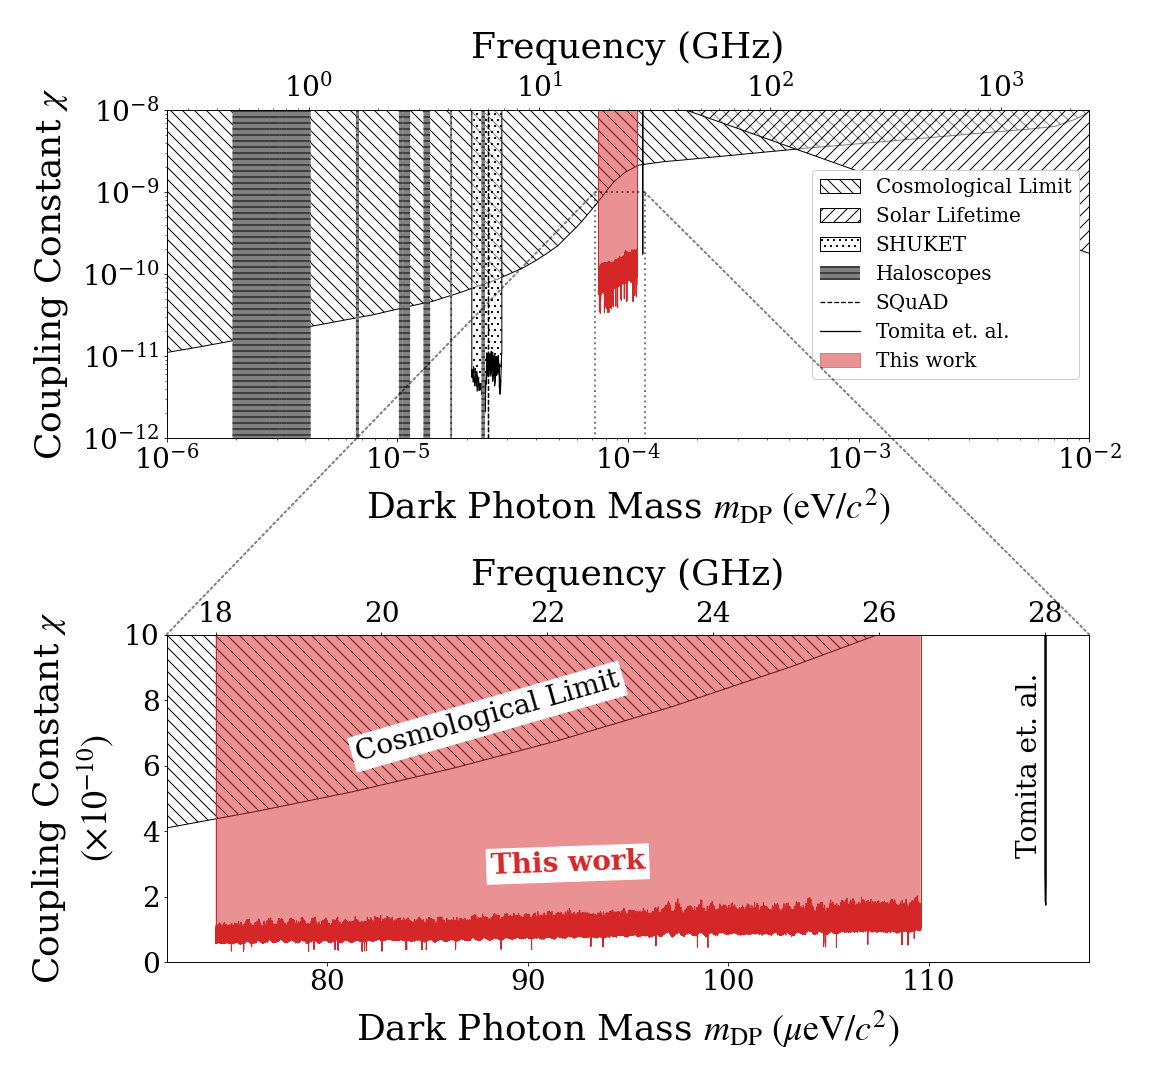
The upper bounds on at 95% confidence level for each frequency were also calculated using the ,
| (8) |
Here, the value of 1.71 is slightly larger than that of the normal Gaussian (1.65) [19]. This is due to the distribution tail in . The upper limits on were converted into the upper limits on using Eq. (1). The systematic uncertainty was also considered in this process. As shown in Fig. 5, we obtained limits for at a confidence level in the mass range . This is the most stringent constraint to date, and tighter than that given by cosmological observations.
In summary, we performed a search for DPDM using a cryogenic receiver in the millimeter-wave range, , which corresponds to a mass range . We optimized the analysis procedure using null samples and calculated the statistical significance using them. We found no signal and set an upper limit of at confidence level. This is the first exploration of a mass range that had not yet been explored by any direct search. The constraint achieved is tighter than that from the cosmological observations. The explored mass range is 600 times larger than that in the previous study with an improved setup.
This work was supported by JSPS KAKENHI under grand numbers 20K14486, 20K20427, 21H01093, and 21H05460, and was also supported by grant aid from the Murata Foundation and the Sumitomo Foundation. SA and TS acknowledge the Hakubi Project and the SPIRITS Program of Kyoto University, respectively. We thank Edanz (https://jp.edanz.com/ac) for editing a draft of this manuscript.
References
- Arias et al. [2012] P. Arias, D. Cadamuro, M. Goodsell, J. Jaeckel, J. Redondo, and A. Ringwald, J. Cosmol. Astropart. Phys. 2012 (06), 013.
- Graham et al. [2016] P. W. Graham, J. Mardon, and S. Rajendran, Phys. Rev. D 93, 103520 (2016).
- Tomita et al. [2020] N. Tomita, S. Oguri, Y. Inoue, M. Minowa, T. Nagasaki, J. Suzuki, and O. Tajima, J. Cosmol. Astropart. Phys. 2020 (09), 012.
- Caputo et al. [2021] A. Caputo, A. J. Millar, C. A. J. O’Hare, and E. Vitagliano, Phys. Rev. D 104, 095029 (2021).
- Horns et al. [2013] D. Horns, J. Jaeckel, A. Lindner, A. Lobanov, J. Redondo, and A. Ringwald, J. Cosmol. Astropart. Phys. 2013 (04), 016.
- Jaeckel and Knirck [2016] J. Jaeckel and S. Knirck, J. Cosmol. Astropart. Phys. 2016 (01), 005.
- Sikivie [1983] P. Sikivie, Phys. Rev. Lett. 51, 1415 (1983).
- Catena and Ullio [2010] R. Catena and P. Ullio, J. Cosmol. Astropart. Phys. 2010 (08), 004.
- Choi et al. [2013] J. Choi, H. Ishitsuka, S. Mima, S. Oguri, K. Takahashi, and O. Tajima, Rev. Sci. Instrum. 84, 114502 (2013) .
- Partridge [1995] R. B. Partridge, 3K: The Cosmic Microwave Background Radiation, Cambridge Astrophysics (Cambridge University Press, 1995).
- Araujo et al. [2012] D. Araujo et al. (The QUIET Collaboration), Astrophys. J. 760, 145 (2012).
- Bischoff et al. [2013] C. Bischoff et al. (The QUIET Collaboration), Astrophys. J. 768, 9 (2013).
- Drukier et al. [1986] A. K. Drukier, K. Freese, and D. N. Spergel, Phys. Rev. D 33, 3495 (1986).
- Mayet et al. [2016] F. Mayet et al., Phys. Rep. 627, 1 (2016) .
- Akerib et al. [2017] D. S. Akerib et al. (LUX Collaboration), Phys. Rev. Lett. 118, 021303 (2017).
- Aprile et al. [2018] E. Aprile et al. (XENON Collaboration), Phys. Rev. Lett. 121, 111302 (2018).
- Fu et al. [2017] C. Fu et al. (PandaX-II Collaboration), Phys. Rev. Lett. 118, 071301 (2017).
- Agnes et al. [2018] P. Agnes et al. (The DarkSide Collaboration), Phys. Rev. Lett. 121, 111303 (2018).
- [19] P.A. Zyla et al. (Particle Data Group), Prog. Theor. Exp. Phys. 2020, 083C01 (2020).
- Foster et al. [2018] J. W. Foster, N. L. Rodd, and B. R. Safdi, Phys. Rev. D 97, 123006 (2018).
- [21] P. Brun, L. Chevalier, and C. Flouzat, Phys. Rev. Lett. 122, 201801 (2019).
- [22] A. V. Dixit, S. Chakram, K. He, A. Agrawal, R. K. Naik, D. I. Schuster, and A. Chou, Phys. Rev. Lett. 126, 141302 (2021).