Multiplex mobility network and metapopulation epidemic simulations of Italy based on Open Data
Abstract
The patterns of human mobility play a key role in the spreading of infectious diseases and thus represent a key ingredient of epidemic modeling and forecasting. Unfortunately, as the Covid-19 pandemic has dramatically highlighted, for the vast majority of countries there is no availability of granular mobility data. This hinders the possibility of developing computational frameworks to monitor the evolution of the disease and to adopt timely and adequate prevention policies. Here we show how this problem can be addressed in the case study of Italy. We build a multiplex mobility network based solely on open data, and implement a SIR metapopulation model that allows scenario analysis through data-driven stochastic simulations. The mobility flows that we estimate are in agreement with real-time proprietary data from smartphones. Our modeling approach can thus be useful in contexts where high-resolution mobility data is not available.
I Introduction
Facing the SARS-CoV-2 outbreak has required an unprecedented effort for mankind. Governments around the world have applied containment measures in multiple occasions to hinder the spread of the virus. In particular, as human interactions and mobility are known to deeply affect the patterns of epidemic spreading [1, 2, 3], non-pharmaceutical interventions (NPIs) have been widely adopted to reduce contacts between individuals [4, 5, 6].
NPIs can be generally divided in two main categories [7]. Bottom-up NPIs are self-initiated measurements and behavioral changes due to increase risk perception of the populations [8, 9, 10], which can be measured via surveys or mobile data [11, 12, 13]. Top-down NPIs are measurements imposed by governments whose effectiveness can be measured via changes in the mobility [14, 15, 16] and reduction of the disease prevalence [17, 18]. Making informed decisions, both at the top-down and bottom-up levels, requires timely and quality data about the current stage of the outbreak and contact patterns of individuals [19, 20]. In particular, these data serve to inform computational epidemic models [21], which produce detailed scenario analyses that can be fundamental to inform strategies of response and mitigation of a disease [3, 22, 23, 24, 25] and have been widely exploited to face Covid-19 [26, 27, 28, 29, 30, 31, 32, 33, 34, 35, 36, 37, 38, 39].
Epidemic models vary in complexity [21], ranging from graph-based [40], agent-based [41] and structured meta-population models [42], each with different data requirements. A common ingredient though is the complex network modeling of social contacts, through which contagion can spread at different scales [43, 44, 45]. Mobility data are crucial in this respect [46]. Unfortunately, in many cases the health authorities had to deal with the scarcity and incompleteness of this type of data, which especially in the early stages of the pandemic prevented them from understanding the spreading patterns of the disease and the effects of the various containment measures implemented.
Here we are interested in the case study of Italy, which was the first outbreak of Covid-19 among Western countries and consequently has been the subject of many research studies that tried to model and predict the evolution of the epidemics. In addition to the development of improved compartment models calibrated on the characteristics of Covid-19 [47, 48, 49, 50, 51, 52, 53], much attention has been devoted to the cross-analysis of epidemic and mobility data, in order to evaluate the direct and indirect effect as well as the effectiveness of NPIs.
For instance, [54] developed a mean-field approach that allows to relate the amount of daily cases to the average number of people that an individual meets per day. The empirical studies have instead used mobile phone data from either Facebook Data For Good [55, 56, 57] or telecom operators [58, 59, 60]. These data are available as aggregates over territorial units, therefore they have been used to study mobility at the geographic level of regions or provinces. In particular, the authors of [56] have considered the Italian regions as separate entities, due to low level of commuting between regions, while arguing that such inter-regional mobility had a crucial role in the long-range propagation of epidemics [61]. In addition, these proprietary data represent only proxies of the mobility and therefore are affected by systematic effects that cannot be controlled by researchers. Other works [62, 63] defined network models using commuting flows form the 2011 census database of ISTAT (the Italian Institute of Statistics), which however is obsolete and lacks information on long-range mobility.
Through this work, we attempt to overcome the drawbacks of the data sources described above, by building a granular mobility network model of Italy based on data sources that are openly accessible to researchers, as well as up-to-date and complete. The model is defined at the detailed geographical scale of individual municipalities, and is based on a multiplex structure encompassing various means of mobility – which can be tuned independently to mimic the implementation of different lockdown measures. We remark that the use of open data has benefits and drawbacks: they are readily accessible by anyone, can easily be updated in the future, and can be tested against possible systematic errors; however proprietary data typically have higher granularity, especially on the temporal dimension. Besides open data, we also use a gravity-like model as described below to build the mobility network, which thus inherits all the assumption (and possible shortcomings) associated with that model [64]. Nevertheless we show that the flows of population moving among provinces estimated by our multiplex model are quantitatively in agreement with those computed with Facebook Data for Good [65]. We then show how our model can be used to simulate epidemic dynamics and containment measures at the national scale. Here we consider a disease dynamics modelled via a SIR meta-population approach, but the simulation framework can be easily extended to more complex dynamics. We realise representative epidemic scenarios by varying the geographical position and size of the initially infected population, as well as by implementing a different combination of travel limitation measures. In particular we confirm that limiting long range travel is the main effective strategy to slow down the large-scale expansion of the disease. Additionally we show that the effective network distance can be properly used to infer the actual seed of an epidemic outbreak.
II Methods
II.1 Mobility network
The mobility network is defined by representing each of the municipalities in Italy as a node. We use ISTAT data (https://www.istat.it/it/archivio/6789) to collect information on identification number, reference province, population, surface, latitude and longitude of each municipality. We consider four different mobility layers: intra-province and inter-province layers, representing short range mobility modeled with gravity-like interactions, and train and flight layers, representing long range travels extracted from the origin-destination matrices obtained by government agencies.
To model the mobility of individuals, at each time step of the dynamics we sample a fraction of the population of each municipality and move it to other municipalities. This moving population is distributed over the four layers with the following probabilities: , , , . These values have been extracted from the origin-destination matrices of individual movements (https://www.dati.lombardia.it/Mobilit-e-trasporti/Matrice-OD2020-Passeggeri/hyqr-mpe2, as fractions of the total moving population that uses a given transportation method or moves between different provinces. The destinations of the moving population depend on the chosen layer as described in the following. At the end of the current time step, the moving population returns to the municipality of departure.
II.2 Short range networks: Intra-province and Inter-province layers
The connectivity of the Intra-province and Inter-province layers is set by the territorial contiguity matrix collected by ISTAT (https://www.istat.it/it/archivio/157423): if two municipalities and are geographically adjacent and otherwise. We use the reference province of a municipality to split the connections into the two layers: if the province of municipality is different from the province of municipality , then the connection is placed in the inter-province layer; otherwise it belongs to the intra-province layer. Connections in these layers are weighted using gravity-like assumptions [64]: for the link between nodes and we pose
| (1) |
where is the population density of node (population over surface), is the distance between the two municipalities and denotes the layer. In order to transform such weights into Markovian connection probabilities we use the following normalization:
| (2) |
where are the territorial neighbours of node in the corresponding layer.
II.3 Long range networks: Trains and Flights layers
To build the Train layer, we use the RESTful API of Viaggiatreno (http://www.viaggiatreno.it/) to retrieve information of the train stations and the connections between them. Each station is identified by a unique id, latitude and longitude, while for each train departing from a given station we have the id of the next stop station and the type of connection (Frecciarossa, Intercity, Metropolitana, EuroNight, Regionale, EuroCity). To map the railway stations on the municipalities, we associated each station with the municipalities that are located no more than 5 km away (in this way, on average a single station corresponds to three municipalities). Overall the weight of a link from node to node in the train layer is built as , where is a boolean indicator for the presence of a connection from to by train type , while is the fraction of total travellers for train type , obtained from ISTAT (https://www.istat.it/it/archivio/13995). Finally, as in the short range network, to obtain connection probabilities each is normalised over the total weight of the links from to all possible destinations reachable by train in one stop.
To build the Flight layer, we collect IATA and ICAO codes, latitudes and longitudes of airports from OpenFlights (https://openflights.org/data.html. From the annual ENAC report (https://www.enac.gov.it/pubblicazioni/dati-di-traffico-2019) we collected the air traffic data: origin and destination airports, identified by the IATA and ICAO codes, and total passengers moving between airports. To map the airports on the municipalities, we associated each airport with all municipalities located no more than 15 km away (on average a single airport is mapped on ten municipalities). Overall the weight of a link from node to node in the flight layer, , is defined as the fraction of total travellers from to . As for the other layers, weights are normalised to obtain connection probabilities.
III Results and Discussion
III.1 Comparison of simulated mobility fluxes with Facebook data
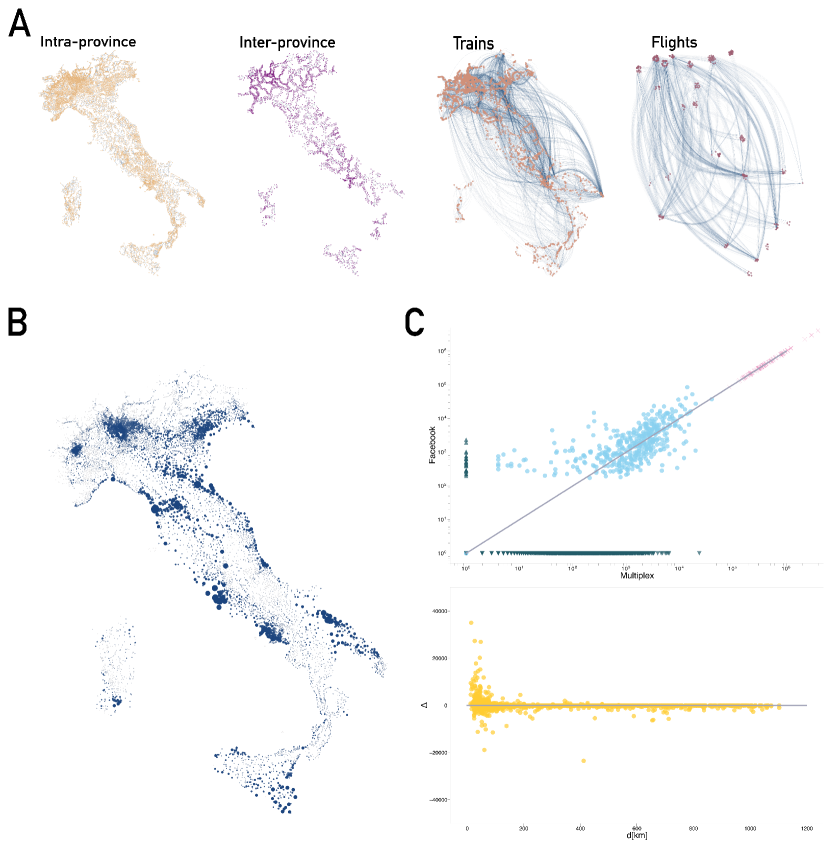
Overall the multiplex network model is build using a combination of a gravity-like approach for short distance travels [64] and of a data-driven approach for long range trains and flights. We have derived connection (transition) probabilities between nodes that are stationary and pairwise-independent, which allow representing mobility as a simple Markovian dynamics. In particular the probability that an individual moves from node to node in a single time step, where , is such that where is the probability to remain on node . Extensive probability fluxes (i.e, the moving population) between any two nodes can be then computed as , where is the population of the starting node . We remark that our model is defined at the geographical resolution of individual municipalities, contrarily to other works that take provinces or regions as minimal spatial units [31, 56]. Figure 1A depicts the different layers that compose the network. Clearly the intra- and inter-province layers exhibit a short distance nature of the connections, whilst the trains and the flights layers represent the long range connections.
Given the mobility network, we identify the most important (or “vital”) nodes via k-core decomposition [66] based on the weighted out-degree, which for a generic node reads
| (3) |
with and , where equals 1 for and 0 otherwise. We use and to give more weight to the strength in the decomposition since it represents the extent of the mobility. Figure 1B shows that the top-ranked nodes are those corresponding to the largest metropolitan areas. Notably, the weighted k-core ranking of a node is derived using only the structural properties of the network, yet it is consistent with a ranking obtained from the size of the epidemic outbreak starting from that node (Kendall’s for the ranking restricted to region capitals equal to at time steps of the simulations and to at ).
We then check whether our mobility model can well represent real data. We thus compare to Facebook Data for Good information; in particular we use the “baseline” indicator of the Movement Maps. This value represents the daily average of the count of movements between two administrative regions over a time window of 45 days, preceding day 0 of data collection (February 23rd 2020 in our case). As the minimal spatial unit of the Facebook data is the province, to perform the comparison we compute inter-province fluxes in the multiplex model as the number of people commuting among provinces. Fig 1 C shows that such mobility fluxes are comparable to Facebook data, the main difference being the under-estimation of short distance mobility by our model and the shortage of long distance travels by Facebook data.
III.2 Disease dynamics: different starting points
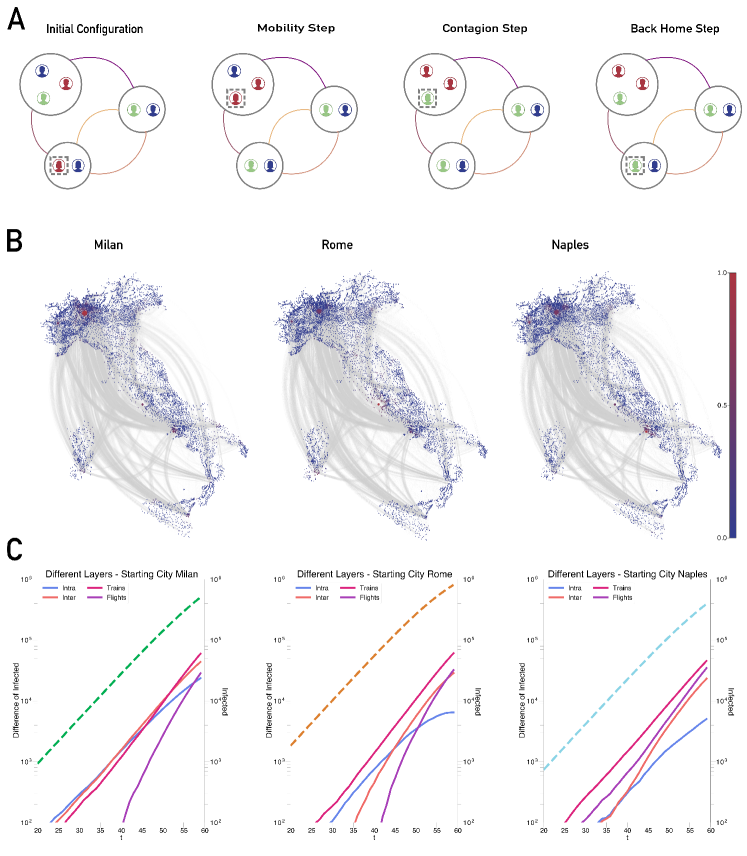
We now couple the mobility with an epidemic dynamics (see Fig 2A) in order to simulate realistic scenarios of the disease diffusion. We choose to use the SIR compartmental model (simulated with a discrete-time reactive process). The reason is that the simple SIR features the key dynamical ingredients that trigger the exponential trend and thus it can be used to study the territorial expansion of the disease (namely the branching process at the basis of the SI transition). Therefore this approach suffices for our purposes of simulating different scenarios on short temporal scales, without fitting of real data. Note however that our framework can be easily implemented with any of the more refined epidemiological models for Covid-19 proposed in the literature (see [7] for a review). These approach try to overcome some limitations of the SIR framework, adding for instance more compartments and dynamic values of , as well as considering an aged-structured population.
Following the meta-population approach used in [31], within a given municipality the transition rules between compartments are:
| (4) | ||||
| (5) |
where is the total population in municipality while , and are the number of individuals in that are susceptible, infected and recovered, respectively. is the mean reproduction number and is the inverse of mean infectious period (here we consider values of disease parameters taken from [31]: and ).
In Figure 2B we plot the results of the model evolution, averaged over 100 numerical simulations, after time steps of the dynamics. We consider different representative starting seeds of the disease (the seed is the municipality of the initially infected individuals) and observe markedly different spreading patterns, both regarding the short and long distances. We also investigate the impact of each individual layer on the spreading dynamics, by removing it from the mobility network (for example, removing the Flight layer means that air travels become forbidden): individuals who are chosen to use the removed layer simply remain in their departure location. Figure 2C shows, for the different starting seeds, the difference of infected individuals between simulations with the complete multiplex and those where a given layer is removed. We consistently observe that in the early phase of the spreading the impact of the trains layer is the largest, with the flight layer eventually becoming more important at later stages.
III.3 Different scenarios of seed sizes and mobility restrictions
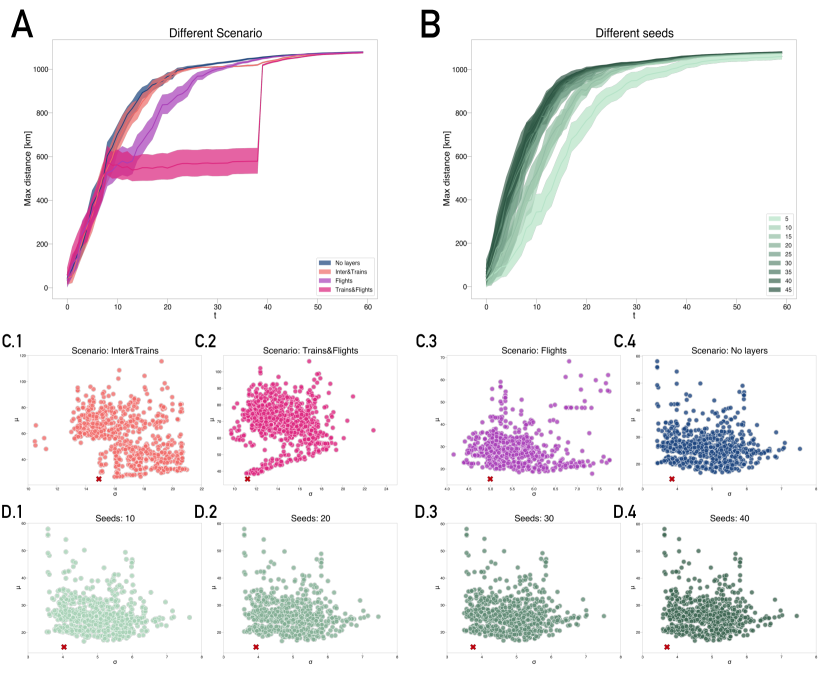
Here we further illustrate how the multiplex model can be used to simulate epidemic scenarios under mobility restrictions. As representative example, we analyzed the maximum distance reached by the disease from the seed location. This distance is computed, for a given time step of the dynamics, considering the farthest municipality with a fraction of infected individuals at least equal to that of the initial seed location at . 111 We consider such an intensive indicator to mark a municipality as “infected” in order to fairly compare small and large population sizes. Other definitions are of course possible, such as those based on extensive thresholds. Figure 3B shows that this observable linearly depends on the size of the starting seed, whereas, Figure 3A illustrates the effect of different restrictions on the mobility — simulated by removing a combination of layers from the network. This simple exercise confirms the effectiveness of long range travels restrictions in slowing down the territorial expansion of the disease [43, 61].
Besides geographical distance, we also consider the effective network distance as introduced in [67]: for nodes that are directly connected, while otherwise, where is the length of a directed path from to , obtained by summing the effective lengths along the legs of the path. Figure 3C-D shows the mean and the variance of the effective distance of infected municipalities from potential outbreak locations (among the top 1000 municipalities by number of populations). The real outbreak location (represented as a red cross) is markedly separated from the other points. Panels C shows different mobility restriction scenarios: the mean effective distances of scenarios C.1 and C.2 (more severe restrictions) are a factor of 2 bigger than those of scenarios C.3 and C.4, and also the shapes of the point clouds are markedly different. Panels D show instead the case of different sizes of the starting seed: the variances of the effective distance, both for the actual and potential outbreak locations, decreases as the seed size increases.
IV Conclusions
In this work we developed a multiplex mobility network of Italy, defined at the fine-grained level of municipalities. We then showed how the model can be used to perform different scenario analysis. The Covid-19 outbreak has highlighted the lack of such a tool, at least for Italy, that would certainly have helped policy makers to monitor the disease evolution and to promptly adopt adequate prevention policies. We built the networked data structure using only open data collected by government agencies. However the estimated mobility flows are well compatible with empirical Facebook geo-localization data from mobile phones. Nevertheless, the comparison with Facebook data has shown a limitation of our approach, namely the absence of a true high quality data source for short distance travels. While we used territorial contiguity to inform a gravity-like approach, considering (at the moment unavailable) open data on road and highway connections certainly represent interesting directions to further extend our approach. Overall, we believe our modeling framework can be a good starting point to build a detailed simulator for Italy to inform response strategies for future epidemics outbreaks.
Data and Code Availability
The data are released on Zenodo, both in the raw scraped version and in the multiplex network construction. The codes to generate the mobility network and to perform the epidemic simulations are released on GitHub. For further information, contact A. Desiderio antonio.desiderio@cref.it
AUTHOR CONTRIBUTIONS
A.D. wrote the simulation code, performed the analysis and realised the figure. G.C. and G.S. designed the analysis and supervised the project. All the authors gathered the data, wrote the paper and discussed the results.
Competing Interest
The authors declare no competing interests.
References
- Eubank et al. [2004] S. Eubank, H. Guclu, V. S. A. Kumar, M. V. Marathe, A. Srinivasan, Z. Toroczkai, and N. Wang, Modelling disease outbreaks in realistic urban social networks, Nature 429, 180 (2004).
- Hufnagel et al. [2004] L. Hufnagel, D. Brockmann, and T. Geisel, Forecast and control of epidemics in a globalized world, Proceedings of the National Academy of Sciences 101, 15124 (2004).
- Balcan et al. [2009] D. Balcan, V. Colizza, B. Gonçalves, H. Hu, J. J. Ramasco, and A. Vespignani, Multiscale mobility networks and the spatial spreading of infectious diseases, Proceedings of the National Academy of Sciences 106, 21484 (2009).
- Haug et al. [2020] N. Haug, L. Geyrhofer, A. Londei, E. Dervic, A. Desvars-Larrive, V. Loreto, B. Pinior, S. Thurner, and P. Klimek, Ranking the effectiveness of worldwide covid-19 government interventions, Nature Human Behaviour 4, 1303 (2020).
- Bo et al. [2021] Y. Bo, C. Guo, C. Lin, Y. Zeng, H. B. Li, Y. Zhang, M. S. Hossain, J. W. Chan, D. W. Yeung, K. O. Kwok, S. Y. Wong, A. K. Lau, and X. Q. Lao, Effectiveness of non-pharmaceutical interventions on covid-19 transmission in 190 countries from 23 january to 13 april 2020, International Journal of Infectious Diseases 102, 247 (2021).
- Mendez-Brito et al. [2021] A. Mendez-Brito, C. E. Bcheraoui, and F. Pozo-Martin, Systematic review of empirical studies comparing the effectiveness of non-pharmaceutical interventions against covid-19, Journal of Infection 83, 281 (2021).
- Perra [2021] N. Perra, Non-pharmaceutical interventions during the covid-19 pandemic: A review, Physics Reports 913, 1–52 (2021).
- Wise et al. [2020] T. Wise, T. D. Zbozinek, G. Michelini, C. C. Hagan, and D. Mobbs, Changes in risk perception and self-reported protective behaviour during the first week of the covid-19 pandemic in the united states, Royal Society Open Science 7, 200742 (2020).
- Bae and Chang [2021] S. Y. Bae and P.-J. Chang, The effect of coronavirus disease-19 (covid-19) risk perception on behavioural intention towards ‘untact’ tourism in south korea during the first wave of the pandemic (march 2020), Current Issues in Tourism 24, 1017 (2021).
- Lüdecke and von dem Knesebeck [2020] D. Lüdecke and O. von dem Knesebeck, Protective behavior in course of the covid-19 outbreak—survey results from germany, Frontiers in Public Health 8, 10.3389/fpubh.2020.572561 (2020).
- Muto et al. [2020] K. Muto, I. Yamamoto, M. Nagasu, M. Tanaka, and K. Wada, Japanese citizens’ behavioral changes and preparedness against covid-19: An online survey during the early phase of the pandemic, PLOS ONE 15, 1 (2020).
- Bönisch et al. [2020] S. Bönisch, K. Wegscheider, L. Krause, S. Sehner, S. Wiegel, A. Zapf, S. Moser, and H. Becher, Effects of coronavirus disease (covid-19) related contact restrictions in germany, march to may 2020, on the mobility and relation to infection patterns, Frontiers in Public Health 8, 10.3389/fpubh.2020.568287 (2020).
- Sun et al. [2020] S. Sun, A. A. Folarin, Y. Ranjan, Z. Rashid, P. Conde, C. Stewart, N. Cummins, F. Matcham, G. D. Costa, S. Simblett, L. Leocani, F. Lamers, P. S. Sørensen, M. Buron, A. Zabalza, A. I. G. Pé rez, B. W. Penninx, S. Siddi, J. M. Haro, I. Myin-Germeys, A. Rintala, T. Wykes, V. A. Narayan, G. Comi, M. Hotopf, and R. J. D. and, Using smartphones and wearable devices to monitor behavioral changes during COVID-19, Journal of Medical Internet Research 22, e19992 (2020).
- Santana et al. [2022] C. Santana, F. Botta, H. Barbosa, F. Privitera, R. Menezes, and R. Di Clemente, Changes in the time-space dimension of human mobility during the covid-19 pandemic (2022).
- Woskie et al. [2021] L. R. Woskie, J. Hennessy, V. Espinosa, T. C. Tsai, S. Vispute, B. H. Jacobson, C. Cattuto, L. Gauvin, M. Tizzoni, A. Fabrikant, K. Gadepalli, A. Boulanger, A. Pearce, C. Kamath, A. Schlosberg, C. Stanton, S. Bavadekar, M. Abueg, M. Hogue, A. Oplinger, K. Chou, G. Corrado, T. Shekel, A. K. Jha, G. A. Wellenius, and E. Gabrilovich, Early social distancing policies in europe, changes in mobility & covid-19 case trajectories: Insights from spring 2020, PLOS ONE 16, 1 (2021).
- Gozzi et al. [2022] N. Gozzi, N. Comini, and N. Perra, The adoption of non-pharmaceutical interventions and the role of digital infrastructure during the covid-19 pandemic in colombia, ecuador, and el salvador (2022).
- Schlosser et al. [2020a] F. Schlosser, B. F. Maier, O. Jack, D. Hinrichs, A. Zachariae, and D. Brockmann, Covid-19 lockdown induces disease-mitigating structural changes in mobility networks, Proceedings of the National Academy of Sciences 117, 32883 (2020a).
- Schlosser et al. [2020b] F. Schlosser, B. F. Maier, O. Jack, D. Hinrichs, A. Zachariae, and D. Brockmann, Covid-19 lockdown induces disease-mitigating structural changes in mobility networks, Proceedings of the National Academy of Sciences 117, 32883 (2020b).
- Oliver et al. [2020a] N. Oliver, B. Lepri, H. Sterly, R. Lambiotte, S. Deletaille, M. D. Nadai, E. Letouzé, A. A. Salah, R. Benjamins, C. Cattuto, V. Colizza, N. de Cordes, S. P. Fraiberger, T. Koebe, S. Lehmann, J. Murillo, A. Pentland, P. N. Pham, F. Pivetta, J. Saramäki, S. V. Scarpino, M. Tizzoni, S. Verhulst, and P. Vinck, Mobile phone data for informing public health actions across the covid-19 pandemic life cycle, Science Advances 6, eabc0764 (2020a).
- Starnini et al. [2021] M. Starnini, A. Aleta, M. Tizzoni, and Y. Moreno, Impact of data accuracy on the evaluation of covid-19 mitigation policies, Data & Policy 3, e28 (2021).
- Pastor-Satorras et al. [2015] R. Pastor-Satorras, C. Castellano, P. Van Mieghem, and A. Vespignani, Epidemic processes in complex networks, Rev. Mod. Phys. 87, 925 (2015).
- Ferguson et al. [2005a] N. M. Ferguson, D. A. T. Cummings, S. Cauchemez, C. Fraser, S. Riley, A. Meeyai, S. Iamsirithaworn, and D. S. Burke, Strategies for containing an emerging influenza pandemic in southeast asia, Nature 437, 209 (2005a).
- Tizzoni et al. [2012] M. Tizzoni, P. Bajardi, C. Poletto, J. J. Ramasco, D. Balcan, B. Gonçalves, N. Perra, V. Colizza, and A. Vespignani, Real-time numerical forecast of global epidemic spreading: case study of 2009 a/h1n1pdm, BMC Medicine 10, 165 (2012).
- Longini et al. [2005] I. M. Longini, A. Nizam, S. Xu, K. Ungchusak, W. Hanshaoworakul, D. A. T. Cummings, and M. E. Halloran, Containing pandemic influenza at the source, Science 309, 1083 (2005).
- Germann et al. [2006] T. C. Germann, K. Kadau, I. M. Longini, and C. A. Macken, Mitigation strategies for pandemic influenza in the united states, Proceedings of the National Academy of Sciences 103, 5935 (2006).
- Broeck et al. [2011] W. V. d. Broeck, C. Gioannini, B. Gonçalves, M. Quaggiotto, V. Colizza, and A. Vespignani, The gleamviz computational tool, a publicly available software to explore realistic epidemic spreading scenarios at the global scale, BMC Infectious Diseases 11, 37 (2011).
- Ferguson et al. [2005b] N. M. Ferguson, D. A. T. Cummings, S. Cauchemez, C. Fraser, S. Riley, A. Meeyai, S. Iamsirithaworn, and D. S. Burke, Strategies for containing an emerging influenza pandemic in southeast asia, Nature 437, 209 (2005b).
- Hollingsworth et al. [2011] T. D. Hollingsworth, D. Klinkenberg, H. Heesterbeek, and R. M. Anderson, Mitigation strategies for pandemic influenza a: balancing conflicting policy objectives, PLoS computational biology 7, e1001076 (2011).
- Zlojutro et al. [2019] A. Zlojutro, D. Rey, and L. Gardner, A decision-support framework to optimize border control for global outbreak mitigation, Scientific Reports 9, 2216 (2019).
- Aleta et al. [2020] A. Aleta, D. Martín-Corral, A. P. Y. Piontti, M. Ajelli, M. Litvinova, M. Chinazzi, N. E. Dean, M. E. Halloran, I. M. L. Jr, S. Merler, A. Pentland, A. Vespignani, E. Moro, and Y. Moreno, Modeling the impact of social distancing, testing, contact tracing and household quarantine on second-wave scenarios of the covid-19 epidemic, medRxiv : the preprint server for health sciences , 2020.05.06.20092841 (2020).
- Aleta and Moreno [2020] A. Aleta and Y. Moreno, Evaluation of the potential incidence of covid-19 and effectiveness of contention measures in spain: a data-driven approach, medRxiv 10.1101/2020.03.01.20029801 (2020).
- Chang et al. [2021] S. Chang, E. Pierson, P. W. Koh, J. Gerardin, B. Redbird, D. Grusky, and J. Leskovec, Mobility network models of covid-19 explain inequities and inform reopening, Nature 589, 82 (2021).
- Barrat et al. [2021] A. Barrat, C. Cattuto, M. Kivelä, S. Lehmann, and J. Saramäki, Effect of manual and digital contact tracing on covid-19 outbreaks: A study on empirical contact data, Journal of the Royal Society Interface 18, 10.1098/rsif.2020.1000 (2021).
- Susswein et al. [2021] Z. Susswein, E. Valdano, T. Brett, P. Rohani, V. Colizza, and S. Bansal, Ignoring spatial heterogeneity in drivers of sars-cov-2 transmission in the us will impede sustained elimination, medRxiv 10.1101/2021.08.09.21261807 (2021).
- Aleta et al. [2021] A. Aleta, D. Martín-Corral, M. A. Bakker, A. P. y Piontti, M. Ajelli, M. Litvinova, M. Chinazzi, N. E. Dean, M. E. Halloran, I. M. Longini, A. Pentland, A. Vespignani, Y. Moreno, and E. Moro, Quantifying the importance and location of sars-cov-2 transmission events in large metropolitan areas, medRxiv 10.1101/2020.12.15.20248273 (2021).
- Domenico et al. [2021] L. D. Domenico, G. Pullano, C. E. Sabbatini, P. Y. Boëlle, and V. Colizza, Modelling safe protocols for reopening schools during the covid-19 pandemic in france, Nature Communications 12, 10.1038/s41467-021-21249-6 (2021).
- Abueg et al. [2021] M. Abueg, R. Hinch, N. Wu, L. Liu, W. Probert, A. Wu, P. Eastham, Y. Shafi, M. Rosencrantz, M. Dikovsky, Z. Cheng, A. Nurtay, L. Abeler-Dörner, D. Bonsall, M. V. McConnell, S. O’Banion, and C. Fraser, Modeling the effect of exposure notification and non-pharmaceutical interventions on covid-19 transmission in washington state, npj Digital Medicine 4, 10.1038/s41746-021-00422-7 (2021).
- Mazzoli et al. [2021] M. Mazzoli, E. Pepe, D. Mateo, C. Cattuto, L. Gauvin, P. Bajardi, M. Tizzoni, A. Hernando, S. Meloni, and J. J. Ramasco, Interplay between mobility, multi-seeding and lockdowns shapes covid-19 local impact, PLoS Computational Biology 17, 10.1371/journal.pcbi.1009326 (2021).
- Contreras et al. [2022] D. A. Contreras, E. Colosi, G. Bassignana, V. Colizza, and A. Barrat, Impact of the representation of contact data on the evaluation of interventions in infectious diseases simulations, medRxiv 10.1101/2022.02.28.22271600 (2022).
- Pastor-Satorras and Vespignani [2001] R. Pastor-Satorras and A. Vespignani, Epidemic spreading in scale-free networks, Phys. Rev. Lett. 86, 3200 (2001).
- Liu et al. [2018] Q.-H. Liu, M. Ajelli, A. Aleta, S. Merler, Y. Moreno, and A. Vespignani, Measurability of the epidemic reproduction number in data-driven contact networks, Proceedings of the National Academy of Sciences 115, 12680 (2018).
- Wang and Li [2014] L. Wang and X. Li, Spatial epidemiology of networked metapopulation: an overview, Chinese Science Bulletin 59, 3511 (2014).
- Colizza et al. [2006] V. Colizza, A. Barrat, M. Barthélemy, and A. Vespignani, The role of the airline transportation network in the prediction and predictability of global epidemics, Proceedings of the National Academy of Sciences 103, 2015 (2006).
- Moreno et al. [2002] Y. Moreno, R. Pastor-Satorras, and A. Vespignani, Epidemic outbreaks in complex heterogeneous networks, The European Physical Journal B - Condensed Matter and Complex Systems 26, 521 (2002).
- Kraemer et al. [2020] M. U. G. Kraemer, C.-H. Yang, B. Gutierrez, C.-H. Wu, B. Klein, D. M. Pigott, null null, L. du Plessis, N. R. Faria, R. Li, W. P. Hanage, J. S. Brownstein, M. Layan, A. Vespignani, H. Tian, C. Dye, O. G. Pybus, and S. V. Scarpino, The effect of human mobility and control measures on the covid-19 epidemic in china, Science 368, 493 (2020).
- Oliver et al. [2020b] N. Oliver, B. Lepri, H. Sterly, R. Lambiotte, S. Deletaille, M. D. Nadai, E. Letouzé, A. A. Salah, R. Benjamins, C. Cattuto, V. Colizza, N. de Cordes, S. P. Fraiberger, T. Koebe, S. Lehmann, J. Murillo, A. Pentland, P. N. Pham, F. Pivetta, J. Saramäki, S. V. Scarpino, M. Tizzoni, S. Verhulst, and P. Vinck, Mobile phone data for informing public health actions across the covid-19 pandemic life cycle, Science Advances 6, eabc0764 (2020b).
- Parolini et al. [2021] N. Parolini, L. Dede’, G. Ardenghi, and A. Quarteroni, Modelling the covid-19 epidemic and the vaccination campaign in italy by the suihter model (2021).
- Giordano et al. [2020] G. Giordano, F. Blanchini, R. Bruno, P. Colaneri, A. D. Filippo, A. D. Matteo, and M. Colaneri, Modelling the covid-19 epidemic and implementation of population-wide interventions in italy, Nature Medicine 26, 855 (2020).
- Rossa et al. [2020] F. D. Rossa, D. Salzano, A. D. Meglio, F. D. Lellis, M. Coraggio, C. Calabrese, A. Guarino, R. Cardona-Rivera, P. D. Lellis, D. Liuzza, F. L. Iudice, G. Russo, and M. di Bernardo, A network model of italy shows that intermittent regional strategies can alleviate the covid-19 epidemic, Nature Communications 11, 5106 (2020).
- Arcede, Jayrold P. et al. [2020] Arcede, Jayrold P., Caga-anan, Randy L., Mentuda, Cheryl Q., and Mammeri, Youcef, Accounting for symptomatic and asymptomatic in a seir-type model of covid-19, Math. Model. Nat. Phenom. 15, 34 (2020).
- De Falco et al. [2020] I. De Falco, A. Della Cioppa, U. Scafuri, and E. Tarantino, Coronavirus covid-19 spreading in italy: optimizing an epidemiological model with dynamic social distancing through differential evolution (2020).
- Guzzetta et al. [2020] G. Guzzetta, F. Riccardo, V. Marziano, P. Poletti, F. Trentini, A. Bella, X. Andrianou, M. Del Manso, M. Fabiani, S. Bellino, S. Boros, A. M. Urdiales, M. F. Vescio, A. Piccioli, C.-. w. group, S. Brusaferro, G. Rezza, P. Pezzotti, M. Ajelli, and S. Merler, The impact of a nation-wide lockdown on covid-19 transmissibility in italy (2020).
- Pizzuti et al. [2020] C. Pizzuti, A. Socievole, B. Prasse, and P. V. Mieghem, Network-based prediction of covid-19 epidemic spreading in italy, Applied Network Science 5, 91 (2020).
- Parino et al. [2021a] F. Parino, L. Zino, M. Porfiri, and A. Rizzo, Modelling and predicting the effect of social distancing and travel restrictions on covid-19 spreading, Journal of the Royal Society Interface 18, 10.1098/rsif.2020.0875 (2021a).
- Galeazzi et al. [2021] A. Galeazzi, M. Cinelli, G. Bonaccorsi, F. Pierri, A. L. Schmidt, A. Scala, F. Pammolli, and W. Quattrociocchi, Human mobility in response to covid-19 in france, italy and uk, Scientific Reports 11, 13141 (2021).
- Scala et al. [2020] A. Scala, A. Flori, A. Spelta, E. Brugnoli, M. Cinelli, W. Quattrociocchi, and F. Pammolli, Time, space and social interactions: exit mechanisms for the covid-19 epidemics, Scientific Reports 10, 10.1038/s41598-020-70631-9 (2020).
- Smolyak et al. [2021] A. Smolyak, G. Bonaccorsi, A. Flori, F. Pammolli, and S. Havlin, Effects of mobility restrictions during covid19 in italy, Scientific Reports 11, 21783 (2021).
- Pepe et al. [2020] E. Pepe, P. Bajardi, L. Gauvin, F. Privitera, B. Lake, C. Cattuto, and M. Tizzoni, Covid-19 outbreak response, a dataset to assess mobility changes in italy following national lockdown, Scientific Data 7, 230 (2020).
- Cintia et al. [2020] P. Cintia, L. Pappalardo, S. Rinzivillo, D. Fadda, T. Boschi, F. Giannotti, F. Chiaromonte, P. Bonato, F. Fabbri, F. Penone, M. Savarese, F. Calabrese, G. Guzzetta, F. Riccardo, V. Marziano, P. Poletti, F. Trentini, A. Bella, X. Andrianou, M. Del Manso, M. Fabiani, S. Bellino, S. Boros, A. M. Urdiales, M. F. Vescio, S. Brusaferro, G. Rezza, P. Pezzotti, M. Ajelli, S. Merler, P. Vineis, and D. Pedreschi, The relationship between human mobility and viral transmissibility during the covid-19 epidemics in italy (2020).
- Iacus et al. [2020] S. M. Iacus, C. Santamaria, F. Sermi, S. Spyratos, D. Tarchi, and M. Vespe, Human mobility and covid-19 initial dynamics, Nonlinear Dynamics 101, 1901 (2020).
- Gross et al. [2020] B. Gross, Z. Zheng, S. Liu, X. Chen, A. Sela, J. Li, D. Li, and S. Havlin, Spatio-temporal propagation of covid-19 pandemics, EPL (Europhysics Letters) 131, 58003 (2020).
- Gatto et al. [2020] M. Gatto, E. Bertuzzo, L. Mari, S. Miccoli, L. Carraro, R. Casagrandi, and A. Rinaldo, Spread and dynamics of the covid-19 epidemic in italy: Effects of emergency containment measures, Proceedings of the National Academy of Sciences 117, 10484 (2020).
- Parino et al. [2021b] F. Parino, L. Zino, M. Porfiri, and A. Rizzo, Modelling and predicting the effect of social distancing and travel restrictions on covid-19 spreading, Journal of the Royal Society Interface 18, 10.1098/rsif.2020.0875 (2021b).
- Barbosa et al. [2018] H. Barbosa, M. Barthelemy, G. Ghoshal, C. R. James, M. Lenormand, T. Louail, R. Menezes, J. J. Ramasco, F. Simini, and M. Tomasini, Human mobility: Models and applications, Physics Reports 734, 1–74 (2018).
- Maas [2019] P. Maas, Facebook disaster maps: Aggregate insights for crisis response & recovery, Proceedings of the 25th ACM SIGKDD International Conference on Knowledge Discovery Data Mining (2019).
- Lü et al. [2016] L. Lü, D. Chen, X.-L. Ren, Q.-M. Zhang, Y.-C. Zhang, and T. Zhou, Vital nodes identification in complex networks, Physics Reports 650, 1 (2016).
- Brockmann and Helbing [2013] D. Brockmann and D. Helbing, The hidden geometry of complex, network-driven contagion phenomena, Science 342, 1337 (2013).