Journaling Data for Daily PHQ-2 Depression Prediction and Forecasting
Abstract
Digital health applications are becoming increasingly important for assessing and monitoring the wellbeing of people suffering from mental health conditions like depression. A common target of said applications is to predict the results of self-assessed Patient-Health-Questionnaires (PHQ), indicating current symptom severity of depressive individuals. Many of the currently available approaches to predict PHQ scores use passive data, e. g., from smartphones. However, there are several other scores and data besides PHQ, e. g., the Behavioral Activation for Depression Scale–Short Form (BADSSF), the Center for Epidemiologic Studies Depression Scale (CESD), or the Personality Dynamics Diary (PDD), all of which can be effortlessly collected on a daily basis. In this work, we explore the potential of using actively-collected data to predict and forecast daily PHQ-2 scores on a newly-collected longitudinal dataset. We obtain a best MAE of for daily prediction of PHQ-2 scores, which specifically in the used dataset have a range of to , using leave-one-subject-out cross-validation, as well as a best MAE of for forecasting PHQ-2 scores using data from up to the last days. This illustrates the additive value that can be obtained by incorporating actively-collected data in a depression monitoring application.
I Introduction
Depression is a common mental illness that affects millions of individuals around the world, leading to a variety of emotional and physical problems that pose a threat to a patient’s overall wellbeing, and in many cases the demand for help exceeds available resources, e. g., among college students [1, 2]. As its timely diagnosis and longitudinal monitoring can inform treatment decisions, recent years have seen a rise in (digital) monitoring applications [3]. These applications may collect various data streams such as movement [3], heart rate signals [4], or speech [5].
Furthermore, it is common to employ self-administered questionnaires for assessing the severity of depression symptoms, such as the 2- and 9-item Patient-Health-Questionnaires (PHQ-2/9) [6, 7]. These questionnaires are well-correlated with symptom severity, amount of sick days, and higher healthcare utilisation, and thus form well-validated prediction and forecasting targets for digital health applications.
Predicting those depression severity scales is usually done with two kinds of data: passively- and actively-collected. In recent years, there has been a strong focus on passive data by using a broad range of wearable devices [8, 9], which have been used to detect not only depression, but also a number of other diseases such as COVID-19 [10].
The recent review of [3] analysed a range of mobile and wearable technology for monitoring of depressive symptoms and came to the conclusion that certain mobile technologies are able to track depression. In line with this conclusion, [11] use passive phone data and combine them in a multi-task learning model for depression assessment. [12] also use passively-collected phone data to predict daily mood. Within their study, they found out that for predicting daily PHQ-2, passive phone data and their derived features may not be suited for a prediction at a population level. This is caused by the high variation in phone usage patterns and daily mood ratings. [13] chose a different approach to depression prediction by taking audio and video as available data streams into account [13].
Different from previous work, our study focuses on exclusively exploring active data in the form of diary questionnaires that can be effortlessly collected on a daily basis for PHQ-2 prediction and forecasting at a population level. These kinds of active assessments are known as Experience Sampling Methods (ESM) [14] and are often used for journaling to track symptoms. Symptom monitoring is a typical part of cognitive-behavioural treatments for depression [15], as well as for other mental disorders [16]. Therefore, this type of assessment is common and often used in practice. However, especially under real-world conditions, these data are not typically used for modelling, thus their potential is not yet fully exploited, so we intend to explore these possibilities within this work by predicting and forecasting PHQ-2 ratings with it. In doing so, we consider not only individual questions in isolation, but a number of different scores that participants record daily in a smartphone/app diary.
The remainder of this paper is organised as follows. Section II describes the MAIKI study and the resulting dataset. Section III and Section IV outline our experiments and results. Section V concludes the paper with a brief discussion.
II MAIKI Dataset
In this section, we provide information about the longitudinal MAIKI dataset, a subset of which we use in this work. It is collected within the “Mobile daily living therapy assistant with interaction-focused artificial intelligence for depression” (MAIKI) project, in which various active and passive data modalities, e. g., phone data, GPS data, or several questionnaires were gathered from 48 patients over a period of three months. The study procedures were approved by the ethics committee of the Friedrich-Alexander-University Erlangen-Nuremberg (385_20B).
MAIKI is a real-world dataset. During the period of the study, there have been days when no data was collected from some participants. The reason for this is that some individuals did not complete the diaries for everyday. In Section III, we explain in detail how we handle missing values to ensure data quality. The various data streams available from all participants of the study are outlined below.
II-A Passively-collected data
First, passive phone data were collected. These can be roughly divided into the four areas of (1) app sessions & app usage information, (2) metadata on general cell phone settings & phone actions, (3) GPS data, as well as (4) communication information in the form of contacts, call & SMS data.
Since this work focuses on the actively-collected daily data, we will not go into further in-depth for passive data, but instead describe the active data in more detail.
II-B Actively-collected data
In parallel to the passively-collected data, the project also collected active data. Active data collection took place in four different ways: (1) First, audio data were recorded at the beginning of the study. This was done during an interview with a trained psychologist. (2) Second, a self-assessment survey was collected at least once from each participant, providing different socio-demographic information. In addition, these surveys determined various clinical scores such as the Assessment of Quality of Life (AQoL-8D) [17], Behavioral Activation for Depression Scale-Short Form (BADSSF) [18], or the Big Five Inventory (BFI) [19]. (3) Third, each patient underwent a weekly screening in which the three scores Generalized Anxiety Disorder (GAD-7) [20], Perceived Stress Scale (PSS-4) [21], and Patient Health Questionnaire (PHQ-9) [7] were collected. (4) Fourth, study participants kept a diary in which they answered questions daily. These questions were based on items extracted from psychometrically validated questionnaires: the Center for Epidemiologic Studies Depression (CESD; item 5, 7, 20) [22], Personality Dynamics Diary (PDD; agentic/communal reward, workload) [23], Pittsburgh Sleep Quality Index (PSQI; item 6) [24], BADS-SF (item 1, 5, 7), as well as PHQ-2 [6]. Different to previous studies, a scale of 0-12 is used for PHQ-2 in the MAIKI dataset, aiming at an even finer patient state estimation. A division by 2 allows a conversion to the commonly used PHQ-2 scale, ranging from 0-6. In addition to the diary, data was also collected during the day using the ESM, providing information about the current mood of the individuals.
II-C Feature sets
From all the assembled data in the MAIKI dataset, we use the actively-collected daily data which was gathered by a diary entry of each participant for every day in the study. Based on the diaries data, we compiled three feature sets as follows:
-
•
Intraday-ESM data contains only four features that reflect a person’s daily mood, including scores for activity, happiness, sadness, and tension during the day. In addition, it contains a PSQI score, indicating the quality of sleep of the previous night.
-
•
Daily-Diary consists of questions of the depression scores BADSSF and CESD, as well as PDD. Further, it includes a score for perceived anxiety and experiential avoidance.
-
•
Intraday-ESM & Daily-Diary combines both feature sets and therefore contains a broad spectrum of information about the daily mood of a patient.
III Experimental setup
In this section, we provide details on the experimental setup. All models were evaluated in a Leave-One-Subject-Out (LOSO) cross-validation setup, where for each fold, we test the model on one participant and train on all the others. Optimisation was performed by nested-cross-validation on each train data set. Features are min-max normalised to a range for each fold. We also experimented with mean-std normalisation, but do not report results on it, as it showed inferior performance on our dataset. As an initial baseline for the MAIKI dataset, we calculated the mean absolute error (MAE) based on the rolling-mean value of all labels for each subject, which corresponds to chance-level. Due to the fact that features from Intraday-ESM and Daily-Diary are not always both available on all days, there are separate baselines for the individual two feature sets, since a different number of labels corresponding to the features leads to another mean value.
In the following, we explain which method and strategy we use to deal with missing data in all feature sets in order to ensure data quality. Additionally, we describe the different models we use to perform PHQ-2 prediction and forecasting based on the actively-collected ESM and diaries.
III-A Missing data
As described in section II, MAIKI is a real-world dataset and therefore also has missing data, for which we apply the following strategy.
At first, we filter the data by considering a participant’s entry for each associated label as available only if they have provided at least five days of data in the week prior to the corresponding label date. The data missing rate of the subsequent filtered dataset comprises 16 % on average for the three feature sets (17 % in Intraday-ESM and the combined feature set and 14 % in Daily-Diary).
For dealing with this missing data, we perform standard statistical imputation. At every missing data point, we perform linear interpolation by calculating the mean value between the last and the next available data point. Therefore, for each missing feature of one day, the mean feature value of the previous day and the following day is calculated.
III-B Models
We experiment with four different regression models: a) XGBoost [25], b) Support Vector Machines (SVMs), c) Random Forests, and d) Multilayer Perceptrons (MLPs). Each model comes with distinct associated hyperparameters which we tune using 3-fold nested-cross-validation on each train data set with non-disjoint subjects. For XGBoost, we optimise the column subsample ratio ({), the maximum tree depth (), and the number of trees trained (). For SVM, we optimise the kernel function (RBF, linear) and the value (). The hyperparameters for Random Forests are the number of trees () and the number of features to consider when looking for the best split ().
Finally, for MLPs, we use a fixed architecture of two linear layers with dropout of and ReLU activation function, as well as Adam as an optimiser. The number of neurons in each case corresponds to the number of available features () and one neuron for the output layer. The models were trained for epochs with a batch size of , a learning rate of , and MAE Loss.
IV Results
In this section, we describe the experiments performed, as well as the results achieved. First, we explore the performance of PHQ-2 prediction with data from the same day. Second, we present results for PHQ-2 forecasting for a given day based on the data of up to seven previous days.
IV-A PHQ-2 prediction with data from the same day
based on the (active) data from the same day.
| Data | Model | MAE |
|---|---|---|
| Intraday-ESM | Baseline | 2.407 |
| XGBoost | 1.972 | |
| SVM | 1.892 | |
| Random Forest | 1.928 | |
| MLP | 1.855 | |
| Daily-Diary | Baseline | 2.499 |
| XGBoost | 1.517 | |
| SVM | 1.455 | |
| Random Forest | 1.536 | |
| MLP | 1.468 | |
| Intraday-ESM & Daily-Diary | Baseline | 2.407 |
| XGBoost | 1.617 | |
| SVM | 1.496 | |
| Random Forest | 1.577 | |
| MLP | 1.417 |
Table I summarises the regression performance for daily PHQ-2 prediction with active diaries data from the same day which we report with the MAE for each feature set. Furthermore, the table shows an initial baseline MAE that was calculated based on the PHQ-2 rolling-mean value of all participants within the feature set. PHQ-2 ranges from values between 0-12. This range was defined specifically for MAIKI data collection to provide an even finer scale than the regular PHQ-2 range. In Intraday-ESM and the combined feature set, the best regression performance can be observed with the MLP model, which yields an MAE of 1.855 and 1.417 with a baseline of 2.407. In Daily-Diary, the best result can be observed with the SVM model, which has an MAE of 1.455 with a baseline of 2.499.
IV-B PHQ-2 forecasting with data from the last 7 days
based on the last 1-7 days (active) data.
| Data | Model | MAE |
|---|---|---|
| Intraday-ESM (5 days) | Baseline | 2.176 |
| XGBoost | 2.161 | |
| SVM | 2.018 | |
| Random Forest | 2.034 | |
| MLP | 2.133 | |
| Daily-Diary (2 days) | Baseline | 2.438 |
| XGBoost | 2.185 | |
| SVM | 2.110 | |
| Random Forest | 2.174 | |
| MLP | 2.048 | |
| Intraday-ESM & Daily-Diary (4 days) | Baseline | 2.176 |
| XGBoost | 1.967 | |
| SVM | 1.964 | |
| Random Forest | 2.022 | |
| MLP | 1.914 |
Table II summarises for each feature set the best regression performance of PHQ-2 forecasting for the next day with data from up to the last 1-7 days. For Intraday-ESM, the best result is achieved with the SVM model with data from the last 5 days, which leads to an MAE of 2.018 with a baseline of 2.176. For Daily-Diary, the best result can be observed with the MLP model, which yields an MAE of 2.048 with a baseline of 2.438. For Intraday-ESM & Daily-Diary, the MLP model leads to the best result with an MAE of 1.914 and a baseline of 2.176.
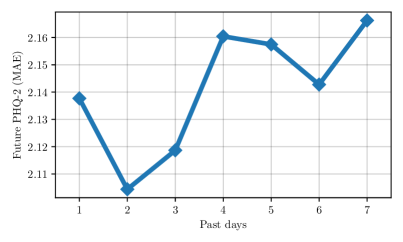
Figure 1 shows the variation of performance when adding further past days (). This demonstrates that more days do not lead to better results in the case of PHQ-2 forecasting using active diaries and ESM data. In fact, minor fluctuations can be observed, which are, however, not statistically significant (t-tests for MAE values when using only previous day vs all other days, ). A similar behaviour can be observed for all three feature sets.
V Conclusion and future work
For early detection, predicting scores for depression detection is becoming increasingly important in order to be able to intervene in time. With the normal PHQ-2 scale (), intervention should take place from a score of 3, which corresponds to a score of 6 on our chosen scale (). We showed that PHQ-2 can be predicted with a small amount of daily active data. We also observed that the previous day is most important for PHQ-2 forecasting, and that days previous to the last day have only a small effect on performance.
The results are therefore relevant for future depression detection and lead to the conclusion that actively-collected data can be promising to improve prediction models for PHQ scores in the future.
Overall, MLP models had the best performance. Our results demonstrated that active data should be given more consideration in prediction models in the future, e. g., by combining more active data with commonly used passive prediction models.
Future work could be targeted at exploring these different possible multimodal combinations to further improve performance, as well as investigating more complex models.
Acknowledgments
Data analysed in this publication were collected as part of the MAIKI project, which was funded by the German Federal Ministry of Education and Research (grant No. 13GW0254). The responsibility for the content of this publication lies with the authors.
References
References
- [1] Aaron T Beck, Brad A Alford, MD Aaron T Beck and Ph D Brad A Alford “Depression” University of Pennsylvania Press, 2014
- [2] Randy P Auerbach, Jordi Alonso, William G Axinn, Pim Cuijpers, David D Ebert, Jennifer G Green, Irving Hwang, Ronald C Kessler, Howard Liu and Philippe Mortier “Mental disorders among college students in the World Health Organization world mental health surveys” In Psychological medicine 46.14 Cambridge University Press, 2016, pp. 2955–2970
- [3] Lydia Sequeira, Steve Perrotta, Jennifer LaGrassa, Kathleen Merikangas, David Kreindler, Deepa Kundur, Darren Courtney, Peter Szatmari, Marco Battaglia and John Strauss “Mobile and wearable technology for monitoring depressive symptoms in children and adolescents: A scoping review” In Journal of affective disorders 265 Elsevier, 2020, pp. 314–324
- [4] Rui Wang, Weichen Wang, Alex DaSilva, Jeremy F Huckins, William M Kelley, Todd F Heatherton and Andrew T Campbell “Tracking depression dynamics in college students using mobile phone and wearable sensing” In Proceedings of the ACM on Interactive, Mobile, Wearable and Ubiquitous Technologies 2.1 ACM New York, NY, USA, 2018, pp. 1–26
- [5] Nicholas Cummins, Alice Baird and Bjoern W Schuller “Speech analysis for health: Current state-of-the-art and the increasing impact of deep learning” In Methods 151 Elsevier, 2018, pp. 41–54
- [6] Kurt Kroenke, Robert L Spitzer and Janet BW Williams “The Patient Health Questionnaire-2: validity of a two-item depression screener” In Medical care JSTOR, 2003, pp. 1284–1292
- [7] Bernd Löwe, Kurt Kroenke, Wolfgang Herzog and Kerstin Gräfe “Measuring depression outcome with a brief self-report instrument: sensitivity to change of the Patient Health Questionnaire (PHQ-9)” In Journal of affective disorders 81.1 Elsevier, 2004, pp. 61–66
- [8] Jing Han, Zixing Zhang, Cecilia Mascolo, Elisabeth André, Jianhua Tao, Ziping Zhao and Björn W Schuller “Deep learning for mobile mental health: challenges and recent advances” In IEEE Signal Processing Magazine 38.6 IEEE, 2021, pp. 96–105
- [9] Kun Qian, Zixing Zhang, Yoshiharu Yamamoto and Bjoern W Schuller “Artificial intelligence internet of things for the elderly: From assisted living to health-care monitoring” In IEEE Signal Processing Magazine 38.4 IEEE, 2021, pp. 78–88
- [10] Shuo Liu, Jing Han, Estela Laporta Puyal, Spyridon Kontaxis, Shaoxiong Sun, Patrick Locatelli, Judith Dineley, Florian B Pokorny, Gloria Dalla Costa and Letizia Leocani “Fitbeat: COVID-19 estimation based on wristband heart rate using a contrastive convolutional auto-encoder” In Pattern recognition 123 Elsevier, 2022, pp. 108403
- [11] Jin Lu, Chao Shang, Chaoqun Yue, Reynaldo Morillo, Shweta Ware, Jayesh Kamath, Athanasios Bamis, Alexander Russell, Bing Wang and Jinbo Bi “Joint modeling of heterogeneous sensing data for depression assessment via multi-task learning” In Proceedings of the ACM on Interactive, Mobile, Wearable and Ubiquitous Technologies 2.1 ACM New York, NY, USA, 2018, pp. 1–21
- [12] Abhishek Pratap, David C Atkins, Brenna N Renn, Michael J Tanana, Sean D Mooney, Joaquin A Anguera and Patricia A Areán “The accuracy of passive phone sensors in predicting daily mood” In Depression and anxiety 36.1 Wiley Online Library, 2019, pp. 72–81
- [13] Fabien Ringeval, Björn Schuller, Michel Valstar, Nicholas Cummins, Roddy Cowie, Leili Tavabi, Maximilian Schmitt, Sina Alisamir, Shahin Amiriparian and Eva-Maria Messner “AVEC 2019 workshop and challenge: state-of-mind, detecting depression with AI, and cross-cultural affect recognition” In Proceedings of the 9th International on Audio/Visual Emotion Challenge and Workshop, 2019, pp. 3–12
- [14] Lisa Rhee, Joseph B Bayer and Alex Hedstrom “Experience sampling method” In The International Encyclopedia of Media Psychology Wiley Online Library, 2020, pp. 1–5
- [15] CRRG Telford, Simon McCarthy-Jones, R Corcoran and G Rowse “Experience sampling methodology studies of depression: the state of the art” In Psychological medicine 42.6 Cambridge University Press, 2012, pp. 1119–1129
- [16] Hugo Vachon, Wolfgang Viechtbauer, Aki Rintala and Inez Myin-Germeys “Compliance and retention with the experience sampling method over the continuum of severe mental disorders: meta-analysis and recommendations” In Journal of medical Internet research 21.12 JMIR Publications Inc., Toronto, Canada, 2019, pp. e14475
- [17] Jeff Richardson, Angelo Iezzi, Munir A Khan and Aimee Maxwell “Validity and reliability of the Assessment of Quality of Life (AQoL)-8D multi-attribute utility instrument” In The Patient-Patient-Centered Outcomes Research 7.1 Springer, 2014, pp. 85–96
- [18] Rachel C Manos, Jonathan W Kanter and Wen Luo “The behavioral activation for depression scale–short form: development and validation” In Behavior therapy 42.4 Elsevier, 2011, pp. 726–739
- [19] Oliver P John, Eileen M Donahue and Robert L Kentle “Big five inventory” In Journal of Personality and Social Psychology, 1991
- [20] Robert L Spitzer, Kurt Kroenke, Janet BW Williams and Bernd Löwe “A brief measure for assessing generalized anxiety disorder: the GAD-7” In Archives of internal medicine 166.10 American Medical Association, 2006, pp. 1092–1097
- [21] Eun-Hyun Lee “Review of the psychometric evidence of the perceived stress scale” In Asian nursing research 6.4 Elsevier, 2012, pp. 121–127
- [22] Peter M Lewinsohn, John R Seeley, Robert E Roberts and Nicholas B Allen “Center for Epidemiologic Studies Depression Scale (CES-D) as a screening instrument for depression among community-residing older adults.” In Psychology and aging 12.2 American Psychological Association, 1997, pp. 277
- [23] Johannes Zimmermann, William C Woods, Sven Ritter, Moritz Happel, Oliver Masuhr, Ulrich Jaeger, Carsten Spitzer and Aidan GC Wright “Integrating structure and dynamics in personality assessment: First steps toward the development and validation of a personality dynamics diary.” In Psychological assessment 31.4 American Psychological Association, 2019, pp. 516
- [24] Daniel J Buysse, Charles F Reynolds III, Timothy H Monk, Susan R Berman and David J Kupfer “The Pittsburgh Sleep Quality Index: a new instrument for psychiatric practice and research” In Psychiatry research 28.2 Elsevier, 1989, pp. 193–213
- [25] Tianqi Chen and Carlos Guestrin “Xgboost: A scalable tree boosting system” In Proceedings of the 22nd acm sigkdd international conference on knowledge discovery and data mining, 2016, pp. 785–794