Phase separation and critical size in molecular sorting
Abstract
Molecular sorting is a fundamental process that allows eukaryotic cells to distill and concentrate specific chemical factors in appropriate cell membrane subregions, thus endowing them with different chemical identities and functional properties. A phenomenological theory of this molecular distillation process has recently been proposed [1], based on the idea that molecular sorting emerges from the combination of: a) phase-separation-driven formation of sorting domains, and b) domain-induced membrane bending, leading to the production of submicrometric lipid vesicles enriched in the sorted molecules. In this framework, a natural parameter controlling the efficiency of molecular distillation is the critical size of phase-separated domains. In the experiments, sorting domains appear to fall into two classes: unproductive domains, characterized by short lifetimes and low probability of extraction, and productive domains, that evolve into vesicles that ultimately detach from the membrane system. It is tempting to link these two classes to the different fates predicted by classical phase separation theory for subcritical and supercritical phase-separated domains. Here, we discuss the implication of this picture in the framework of the previously introduced phenomenological theory of molecular sorting. Several predictions of the theory are verified by numerical simulations of a lattice-gas model. Sorting is observed to be most efficient when the number of sorting domains is close to a minimum. To help in the analysis of experimental data, an operational definition of the critical size of sorting domains is proposed. Comparison with experimental results shows that the statistical properties of productive/unproductive domains inferred from experimental data are in agreement with those predicted from numerical simulations of the model, compatibly with the hypothesis that molecular sorting is driven by a phase separation process.
I Introduction
Molecular sorting is a major process responsible for the organization of cellular matter in eukaryotic cells [2]. This highly complex task is accomplished by selectively concentrating and distilling specific proteins and lipids that dwell on the plasma membrane and on the membranes of inner cellular bodies into submicrometric lipid vesicles. Once formed, these vesicles detach from the membrane and are subsequently delivered to their appropriate destinations. It has recently been proposed that molecular sorting may emerge from the combination of two fundamental physical processes [1]: a) phase separation of specific molecules into localized sorting domains, and b) domain-induced membrane bending, leading to the formation of vesicles constitutively enriched in the biochemical factors of the engulfed domains, thus resulting in a natural distillation process. In the proposed abstract model of the process, molecules arriving on a membrane region can laterally diffuse and aggregate into localized domains, whose formation and growth occurs through the typical stages of phase separation: after the initial nucleation stage, in the case of low supersaturation, the growth of domains is mainly governed by the absorption of freely diffusing molecules. One of the main predictions of the classical theory of phase separation is that a critical size has to be reached in order for domains to survive and continue to grow irreversibly to larger and larger scales [3, 4]. In the present theory of molecular distillation such domains are extracted once they reach a characteristic size , determined by the physical and biomolecular processes that induce membrane bending and vesicle formation. In the presence of a constant flux of incoming molecules, the membrane system selforganizes in a driven non-equilibrium stationary state, which can be seen as a realization in Nature of the classical Szilard’s model of droplet formation [5, 6, 4].
Phase separation phenomena are emerging as central drivers of the selforganization of cell structures [7, 8, 9, 10, 11], and the idea that phase separation is an essential step for molecular sorting is increasingly finding support in recent studies [12, 13, 14, 15, 16]. As advances in live-cell imaging have enabled more accurate observations in real time, a striking heterogeneity in domain growth kinetics has emerged, and several approaches to unambiguously classify different dynamic populations have been proposed [17, 18, 19, 20, 21, 22]. In the experiments, a crucial parameter used to describe the sorting process is the lifetime of a sorting domain. It has been recently shown that the lifetime of a sorting domain is related to the domain stability, which in its turn depends on the number of molecules contained in the domain, and thus on the domain size [23]. It is therefore tempting to relate the existence, in the context of phase separation, of a critical size for domain growth, to the observation that sorting domains on cell membranes can undergo qualitatively different final fates. As a matter of fact, sorting domains are commonly classified in two groups: productive domains, if their growth eventually terminates in the nucleation of a vesicle which is ultimately detached from the membrane, and unproductive (or abortive) domains which, instead, progressively dismantle and are ultimately dissolved [24, 18, 22]. It seems natural to interpret this distinction in the context of classical nucleation theory, where the fate of a domain results from the balance between bulk stabilization and the propensity to dismantle along the domain boundary, which in its turn is controlled by the value of a characteristic boundary tension [3, 25, 11]. As a result, circular domains (that minimize the boundary perimeter) are favored, subcritical domains (having size ) have short lifetimes and a low probability of reaching the extraction size , while supercritical domains have a high probability of being ultimately extracted. Here we discuss the implications of this picture in the framework of the phenomenological theory of molecular sorting introduced in Ref. 1. Several predictions of the phenomenological theory are verified by extensive numerical simulations of a lattice-gas model. To help in the analysis of experimental data, we introduce an operational definition of critical size, and discuss its relation to recently introduced methods for the classification of domain formation events into productive and unproductive classes [22]. The operational definition is used here to compare the predictions of our phenomenological theory of molecular sorting to experiments on the formation of productive and unproductive clathrin-coated pits at the plasma membrane. However, the proposed framework is more general, and we expect that it can turn useful in the interpretation of experiments on molecular sorting at different membrane regions, such as sorting endosomes, or the Golgi complex. A direct comparison with experimental results shows that the statistical properties of productive/unproductive domains inferred from experimental data are in good qualitative agreement with those emerging from simulations performed in some specific parameter regions. These results hint at a central role of phase separation, and of the related notions of boundary tension and critical size, in the processes of molecular sorting that control the establishment and maintenance of distinct chemical identities on cell membranes.
II Phenomenological theory
We briefly summarize here the phenomenological theory of phase-separation-driven molecular sorting introduced in Ref. [1], and set up a convenient notation in view of the present discussion. The theory is based on the following non-equilibrium steady-state picture: a constant flux of “sortable” cargo molecules is deposited on the lipid membrane; each molecule occupies a characteristic area on the membrane, diffuses laterally, and can aggregate into sorting domains with the help of a pool of specialized auxiliary molecules, which sustain “active” domain formation by triggering localized positive feedback loops [26, 11, 10], and/or “passive” aggregation, driven by weak attractive intermolecular interactions [27, 7]. Since domain formation is characterized by competing effects, according to classical nucleation theory, a critical size is required for a domain to continue to grow irreversibly and avoid decay [28, 29, 3]. Once formed, sorting domains coarsen due to the incoming flux of laterally diffusing molecules, and are eventually extracted from the membrane in the form of lipid vesicles of characteristic area . It follows that the growing domains coexist with a continuously repleted two-dimensional “gas” of laterally diffusing molecules in a statistically stationary state.
If we consider a region of linear size of the order of the average interdomain half distance, centered around a growing supercritical domain of approximately circular shape and radius , the quasi-static profile of the density of the gas of freely diffusing molecules in the proximity of the domain can be approximately obtained by solving a Laplace equation with Dirichlet boundary conditions and , obtaining
| (1) |
where denotes the distance from the domain center, and . Domain growth is induced by the flux of molecules from the gas to the domain, which can be calculated by integrating the flux density across the boundary of the domain of size , obtaining
| (2) |
where is the lateral diffusivity of the molecules. This formula implies that the domain will grow according to the dynamic equation
| (3) |
In a membrane system where sorting domains may be assumed to be approximately evenly distributed, the statistics of supercritical domains can be conveniently described in terms of the number density , giving the average number per unit membrane area of supercritical domains with size comprised between and . Since the effects of random fluctuations can be approximately neglected in the case of supercritical domains, satisfies the continuity equation
| (4) |
where the rate of removal of domains of size from the system is for , and for . The stationary solution of Eq. (4),
| (5) |
has a universal logarithmic behavior for . The normalization constant can be determined from the steady state condition
| (6) |
for large and . Assuming that the incoming flux of molecules is evenly distributed in average among all available supercritical sorting domains, and neglecting logarithmic corrections, the average number of supercritical domains per unit area is given by
| (7) |
Numerical observations suggest that faster responses of the membrane system to changing environmental conditions are related to shorter residence times of the sorted molecules on the membrane in the steady-state [1]. It is therefore interesting to investigate under which parametric conditions this residence time can be minimized. From the moment of insertion to the moment of extraction, molecules spend an average time diffusing freely and an average time attached to supercritical sorting domains. In principle, for the molecules that aggregate in the initial stage of the domain formation process, when the domain is still subcritical, one should also consider the time spent in the subcritical stage, but this is generally negligible if the critical size is small.
In the following, repeated use will be made of a general steady-state relation, which applies to open systems in a driven non-equilibrium stationary state [30]: the average density of molecules in the system is given by the product of the average density flux of molecules (entering or leaving the system) and the average time that a molecule spends in the system. According to this general relation, the steady-state average density of molecules that are freely diffusing as a two-dimensional gas on the membrane is
| (8) |
The same steady-state relation can be applied to the average density of supercritical domains that are generated and ultimately extracted from the membrane, giving
| (9) |
On the other hand, since each new domain starts its aggregation process from the encounter of two freely diffusing molecules, one can write (see also App. A)
| (10) |
where is a dimensionless proportionality constant measuring the strength of the effective interaction that keeps molecules together in a sorting domain. Combining (8), (9) and (10), the following steady-state relations are obtained:
| (11) | ||||
| (12) |
For approximately absorbing domains, and , therefore (7), (9) and (10) give:
| (13) | ||||
| (14) |
The average time spent by molecules in the system is approximately , which is minimum for
| (15) |
The optimal value is obtained for
| (16) |
For this value, the average number densities of gas molecules and of supercritical domains are:
| (17) |
III Numerical validation
In a minimal lattice-gas model of the distillation process, the lipid membrane is modelled as a two-dimensional square lattice with periodic boundary conditions, where each site can be occupied by a single molecule at most [1]. The system evolves according to a Markov process consisting of the following three elementary events: 1) insertion: molecules from an infinite reservoir arrive and are inserted on empty sites with rate ; 2) diffusion and aggregation: molecules can perform diffusive jumps to an empty neighboring site with rate , where is a dimensionless parameter representing the interaction strength, and is the number of neighboring molecules of the hopping molecule before the jump occurs; 3) extraction: molecules are extracted from the system by simultaneously removing all connected clusters of molecules that contain a completely filled square of size . In what follows, , i.e. areas are measured as numbers of lattice sites, and . In every simulation, the system is allowed to relax to the steady state before starting the collection of relevant statistical data.
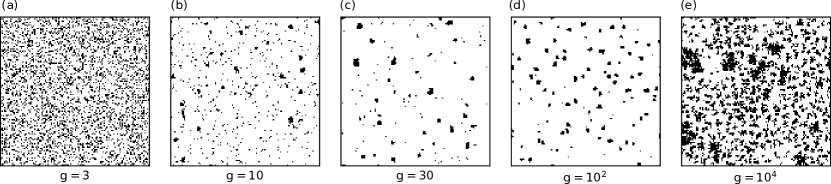
One of the main observations of Ref. 1 is that both the average permanence time of sorted molecules on the membrane system and the average molecule density in the steady state are minimal in an intermediate, optimal range of values of the interaction strength , where the molecular distillation process is most efficient. Snapshots of the simulations taken in the steady state show the typical behavior of the system both inside and outside of this optimal range (Fig. 1). For low interaction strength, molecular crowding accompanied by a hectic formation of small short-lived domains is observed (Fig. 1(a)). As the interaction strength increases, the density of freely diffusing molecules decreases (Fig. 1(b-d)). Consistently with the predictions of the phenomenological theory, the molecular density and residence time are lower in this intermediate range, and reach a minimum in correspondence with the optimal value of the interaction strength (Ref. 1 and Fig. 1(c)). When the interaction strength becomes much larger than its optimal value, the gas of free molecules is strongly depleted, and the system enters into a regime of domain crowding (Fig. 1(d)). Here, a large number of sorting domains shares the incoming molecular flux, the growth of each sorting domain is slowed down, and the efficiency of the distillation process is impaired, as both the molecular density and molecular residence time are much larger than in the optimal region. For very high values of the microscopic interaction strength , the formation of highly irregular domains of the type predicted by the theory of diffusion-limited aggregation [31] is observed (Fig. 1(e)). This latter regime is unlikely to correspond to physiological sorting, but could be related to pathological conditions where high intermolecular interaction strength induced by mutations promote the formation of irregular, solid-like aggregates associated to degenerative deseases [32, 33]. Similar behaviors have also been observed in experiments, where overexpression of adaptor proteins responsible for mediating intermolecular interactions leads to the formation of large and irregularly shaped sorting domains [34].
In summary, for varying values of the interaction strength , our abstract model recapitulates two main phenomenologies. At low and intermediate values of the interaction strength , the simulated dynamics is characterized by the formation of approximately circular sorting domains via nucleation and coarsening, compatibly with the phenomenology of liquid-liquid phase separation observed in several important biological processes [7, 8, 9]. For very large instead, domain remodeling is impaired and a DLA phenomenology [31] is recovered, which may possibly describe the features of pathological processes. A precise characterization of the crossover between these two regimes will be the matter of future investigation.
Numerical simulations confirm the validity of the scaling laws , and , as the numerically obtained values , and are in good agreement with the theoretical predictions [1], that were derived under simplifying assumptions.
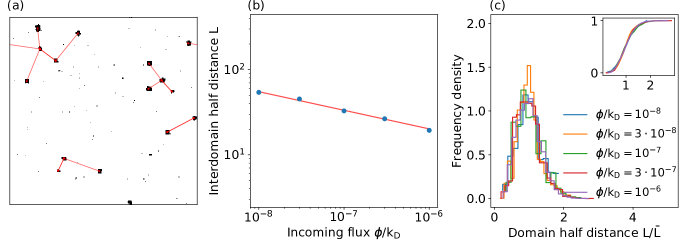
In addition to these former results, other predictions of the phenomenological theory can be verified numerically using the microscopic lattice-gas model. The previously exposed phenomenological theory is valid in the regime where supercritical domains are well separated objects, with a well defined value of the average interdomain half distance . Since the number of supercritical domains scales as , and , it is expected that . This scaling law can be verified numerically in the following way. First, the center of mass of each domain is computed. A critical size is determined using the operational definition given in the following Sect. IV. Domains with size smaller than the critical size are neglected. The nearest neighbour of each domain is found (Fig. 2(a)). Finally, the distances between nearest neighbors and the corresponding statistical measures are computed. The numerical values of the average interdomain half distance obtained by this method follow a scaling law with , close to the theoretically predicted value (Fig. 2(b)). When the mean value is used to rescale the interdomain half distances, the corresponding frequency distributions for different values of collapse on a single universal distribution (Fig. 2(c)).
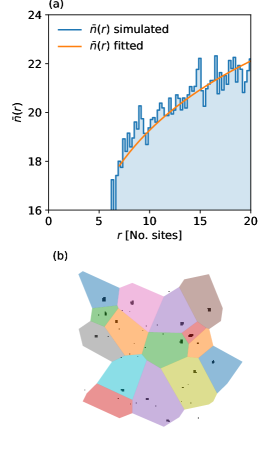
Several results of the phenomenological theory stem from the assumption that the steady-state profile of molecule density around a sorting domain has the logarithmic form (1), and from the related idea that the membrane region can be divided into “attraction basins” of linear size pertaining to distinct sorting domains. Given the approximate nature of these hypotheses, it is interesting to check their validity by direct numerical simulations. A convenient way to computationally define this kind of attraction basins is the use of a Voronoi decomposition, which is a partition of the plane into non-overlapping regions according to their proximity to points of a given set [35]. The two-dimensional square lattice used for the numerical simulations was therefore decomposed according to the following procedure. Once all supercritical domains were identified and tracked, for each time frame the center of mass of each domain was computed and the set of these centers was used to partition the lattice area into Voronoi regions (Fig. 3(b)). Then, free molecules belonging to each region were identified, and their distance from the domain center of mass computed. A direct validation of the theoretical expression (1) is computationally very demanding, as it requires building histograms of distances conditional to the radius of a given sorting domain. We studied a slightly different quantity, i.e. the average frequency of the distances of free molecules from domains of linear sizes comprised between the critical radius and the extraction radius :
| (18) |
for , where the theoretical model describes a density profile characterized by gas depletion in the proximity of the sorting domain. Computing the integral in (18) we obtain
| (19) |
where and are functions of the model parameters. If is the empirical probability of finding a molecule at a distance comprised between and from the center of mass of a domain, then
| (20) |
The measure of obtained from the numerical simulations by this procedure is in agreement with a fit of the theoretical prediction (Fig. 3(a))
In the phenomenological theory, a central role is played by the dimensionless effective interaction strength . A convenient expression for , amenable to empirical estimation, can be obtained by inverting Eq. (10) and making use of (9) to get
| (21) |
which is a function of directly measurable quantities, such as the incoming flux and the bulk gas density . The theory predicts that the optimal value scales as , with (cf. Eq. 16). Numerical simulations yield the compatible value (Fig. 4(a)).
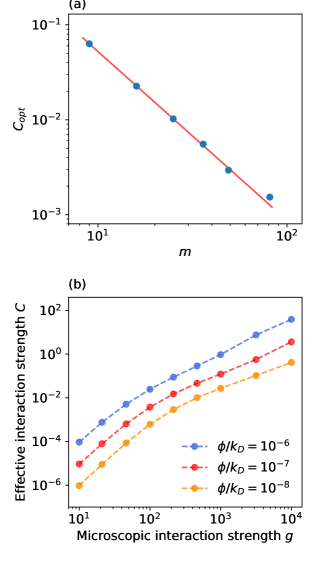
One of the main tenets of the phenomenological theory is the existence of a well-defined critical domain size , arising from the balance between the mixing power of lateral diffusion and the tendency of sorted molecules to aggregate. In the lattice-gas model, the tendency to aggregation is controlled by the microscopic parameter , while in the phenomenological theory, an analogous role is played by the effective interaction strength . The operational definition provided by Eq. 21 allows to determine from the simulated molecule density as a function of model parameters (Fig. 4(b)). Accordingly with its interpretation as an effective interaction strength, is observed to be a non linear, monotonically increasing function of the microscopic parameter .
The critical domain size is a central control parameter of the molecular distillation process, but there is no simple analytical expression for it in the framework of the phenomenological theory. Explicit approximate expressions for the critical size can be obtained using classical metastability analysis in quasi-equilibrium lattice-gas models (see App. B and references therein). Such an analysis predicts that is a monotonically decreasing function of the microscopic interaction strength between sorted molecules, which, however, is not practically measurable. For this reason, in the next Section we provide an operational definition of critical size that can be more directly related to the analysis of experimental observations.
IV Operational definition of the critical size
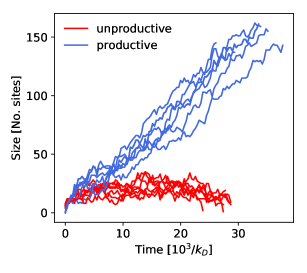
In experimental studies of molecular sorting, domain “trajectories” have been observed to fall into two classes, depending on their fate [24, 18, 22]: productive trajectories, where the domain is finally extracted as a part of a lipid vesicle, and unproductive trajectories, where the domain progressively dismantles and is ultimately dissolved. It is worth observing here that these are properties of the domain history, and not of its state at a given instant. However, for simplicity, we will define in what follows as productive or unproductive domains, those that belong to productive or unproductive trajectories, respectively. In our lattice-gas model, productive and unproductive domains can be directly distinguished by tracking their evolution in time, and checking whether their trajectory ends up with an extraction event, or not (Fig. 5). The classification into productive and unproductive trajectories can be used to provide a natural, operational definition of critical size, applicable to the analysis of actual experimental data.
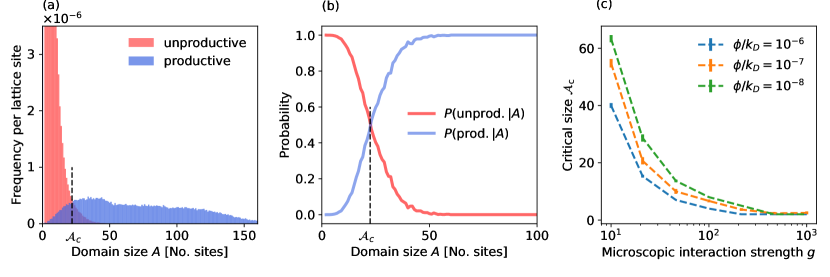
Let us define the ‘operational’ critical size as the value such that a domain of size has 50% probability of being productive:
| (22) |
(similar definitions have been adopted in previous works, see e.g. Ref. 36). In terms of (joint) probability density functions (pdf’s), Eq. 22 is equivalent to
| (23) |
i.e., the critical size is found at the intersection of the joint pdf’s of, respectively, productive and unproductive domain sizes. Under a few additional hypotheses (see App. C), Eq. 22 implies
| (24) |
consistently with the phenomenological picture, where smaller domains decay with high probability, while, once a domain exceeds the critical size, the probability that it will continue to grow up to the extraction size is larger than the probability that it will disappear. In terms of the joint pdf’s of, respectively, productive and unproductive domains, Eq. 24 is in its turn equivalent to the condition that
| (25) |
Either (24) or (25) can be conveniently applied to the analysis of empirical data, which are given as integer or floating-point numbers of finite precision. The critical size can thus be estimated either from conditional frequencies (using Eq. 24) or from frequency histograms of domain sizes (using Eq. 25), as long as productive and unproductive domains can be effectively discriminated. As an example, in Fig. 6(a), is found at the approximate intersection of the (joint) frequency histograms of, respectively, productive and unproductive domains. The existence of this intersection appears to be guaranteed by the fact that is a decreasing function of , while is initially increasing. Fig. 6(b) shows that the probability of a domain being productive increases with its size, while the complementary probability of being unproductive decreases. The above procedure allows to compute from numerical simulations for different values of model parameters. The critical size is thus found to be a decreasing function of both the microscopic interaction strength , and of the incoming molecule flux (Fig. 6(c)).
Having at our disposal an operational definition of critical size, we are now in a position to check numerically the validity of theoretical predictions about the shape of the domain size distribution. The theory predicts functionally different forms for the number densities for the size of, respectively, subcritical and supercritical domains. In the subcritical region, transient domains continuously form and dissolve. This quasi-equilibrium state is approximately described by classical nucleation theory [28, 29], which predicts that the stationary number density for domains of size is
| (26) |
where is a constant, which is expected to be proportional to the interaction strength between sorted molecules.
For , according to Eq. 5, the shape of the number density is instead of the logarithmic type:
| (27) |
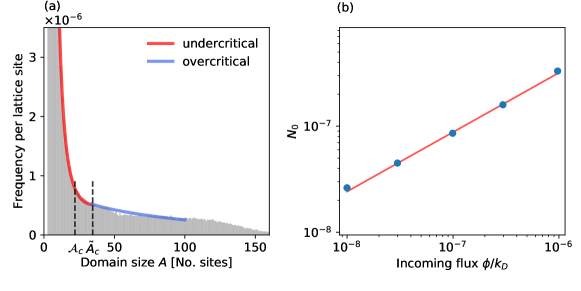
with . By fitting the full histogram of all domain sizes with Eq. 26 for small and with Eq. 27 for large , and by imposing the continuity condition
| (28) |
one obtains an estimate of the critical size in the framework of classical nucleation theory (see Fig. 7(a)). The thus obtained value is of the same order as the previously introduced value , the difference being due to the presence of a small tail of unproductive domains with (see Fig. 6(a)). The definition of has a clear probabilistic interpretation and is independent of phenomenological assumptions about the underlying process of domain formation. On the other hand, the estimate by the above empirical fitting procedure can be used when it is not possible to discriminate between productive and unproductive domains.
A numerical estimate of the prefactor for different values of the incoming molecule flux gives with , in reasonably good agreement with the theoretical value (Fig. 7(b)).
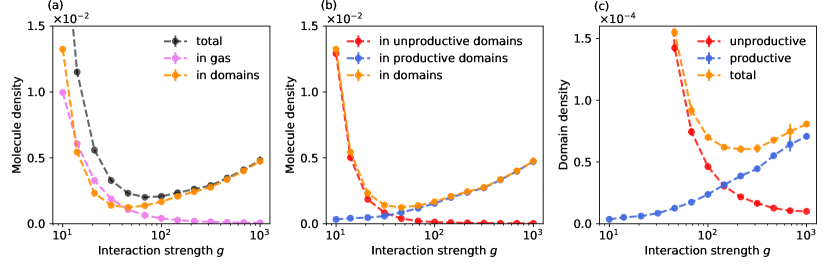
The systematic discrimination of productive and unproductive domains allows to unravel additional aspects of the phenomenology. Optimal sorting takes place when the total number of molecules in the system is minimal [1] (Fig. 8(a)). In a neighborhood of this optimal value, one observes also a minimum in the number of molecules contained in the domains (Fig. 8(b)), and in the number of domains itself (Fig. 8(c)). This is a somehow paradoxical effect, since at first sight, one would expect that a larger number of sorting domains could increase the speed of the sorting process. Instead, sorting turns out to be most efficient precisely when the number of sorting domains is close to a minimum. As a matter of fact, when the interaction strength increases, the number of molecules in unproductive domains decreases, while the number of those in productive domains increases. As a consequence, their sum, i.e. the number of molecules in any of the two types of domains, has a minimum (Fig. 8(b)). A similar argument applies directly to the total numbers of productive and unproductive domains: the number of unproductive domains decreases when the interaction strength increases, while the number of productive domains increases, as predicted by Eq. 13 111Recalling also that the macroscopic interaction strength is a monotonically increasing function of the microscopic parameter (Fig. 4(b)).. This leads to the appearance of an intermediate minimum in the total number of domains (Fig. 8(c)). The emerging picture is that the efficiency of the sorting process is not favored by a proliferation in the number of sorting domains: in that case, the flux of incoming molecules has to be shared among a larger number of domains, and the growth rate of individual domains is slowed down. A balance has therefore to be struck between two competing requirements: the interaction strength should be large enough to allow for easy nucleation of new sorting domains, but small enough to avoid their unnecessary proliferation.
These theoretical predictions are compatible with former experimental work where the strength of interaction between transferrin receptors on cell plasmamembranes was experimentally controlled, and higher interaction strength was shown to induce higher rates of generation of productive sorting domains, and lower numbers of unproductive events [38].
V Interpretation of experimental data
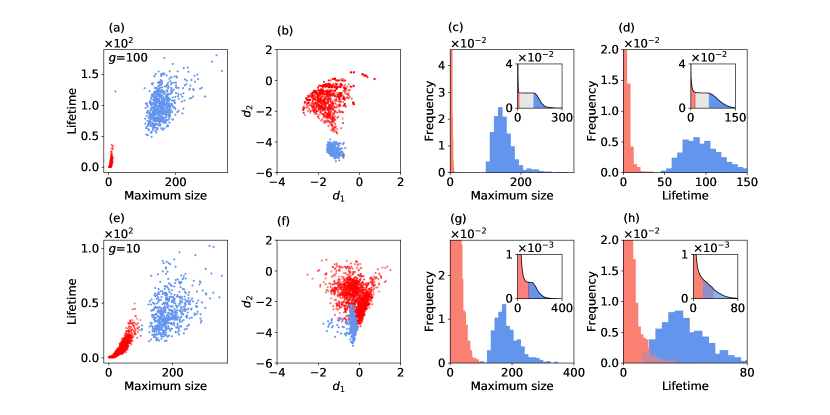
The correct classification of productive/unproductive trajectories in data obtained from living cell experiments is a challenging process. Several approaches have been adopted. Productive trajectories can be singled out by detecting bursts in the concentration of specific molecules involved in the process of vesicle detachment, such as dynamin [39, 20, 24]. Other approaches rely on the measure of extremal properties of domain trajectories, such as the maximum size reached by domains, or their lifetime [24, 17, 18, 40, 1], which are expected to be less dependent on the small-scale details of the stochastic process. More recently, a new classification method based on a “disassembly asymmetry score” (DASC) [22] has been proposed. In this context, productive and unproductive trajectories are discriminated by clustering the values of a set of statistical indicators that compare properties of the backward and forward histories of the domains [22]. The effectiveness of some of these approaches can be tested on numerical simulations of the lattice-gas model discussed in the previous Sections, where the productive vs. unproductive classification can be performed exactly. The first two columns of Fig. 9 show scatter plots of maximum size vs. lifetime (Fig. 9(a, e)), and of the DASC indicators [22] (Fig. 9(b, f)), for and . Different colors are used for productive (blue) and unproductive (red) trajectories. For the two populations are clearly separated, and can be easily discriminated automatically using standard clustering methods. For instead the representative points of the two populations start to overlap, and clustering methods are likely to return a certain number of erroneously classified points. For the existence of two distinct populations of domain trajectories is reflected in the bimodal shape of the frequency distributions of maximum sizes and lifetimes (Fig. 9(c, d)). This clear separation corresponds to a distinct plateau in the (complementary) cumulative frequency distribution (insets). For instead (Fig. 9(g, h)), the frequency distributions of the two populations start to overlap and the bimodal character of the two frequency distributions tends to disappear. The loss of discriminating power takes place approximately for values of the interaction strength such that the critical size becomes of the order of the extraction size (cf. Fig. 6(c)).
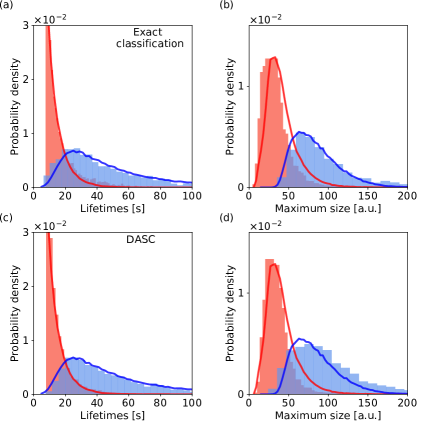
Interestingly, the model predictions for the frequency distributions of the maximum sizes and lifetimes of sorting domains are similar to those resulting from experimental observations. In particular, the maximum size and lifetime distributions for unproductive domains show a rapid monotonic decay, while the corresponding distributions for productive domains show a distinct maximum and a slower decaying tail (Fig. 9(c, d, g, h)). Both of these features have been observed in experiments of endocytic sorting [18, 22], where productive and unproductive domains correspond to clathrin-coated pits (CCPs) and abortive coats (ACs), respectively. (A third population of outlier traces (OTs) [22], characterized by short lifetimes and large sizes, likely correspond to cytoplasm-originated events [40] and are not observed in the simulations.) We looked for model parameters providing the best fit of simulated frequency distributions with data from Fig. 2B,C of Ref. 22, where productive and unproductive domains were classified using DASC. By a single fit of the two parameters of the model and of two rescaling factors for the time and length scales, good agreement between simulation and experimental data was found for both the lifetime and maximum size distributions, simultaneously for both productive and unproductive domains (Fig. 10). The frequency histograms obtained from the exact classification of simulated productive and unproductive domains (Fig. 10(a, b)) was compared with the frequency histograms obtained with the same model parameters, where however simulated domains were classified by the DASC method, yielding similar results (Fig. 10(c, d)).
VI Conclusions
To generate and maintain their internal order and guarantee proper physiological functioning, eukaryotic cells rely on a sophisticated process by which specific biomolecules are sorted and concentrated on small lipid vesicles, that are later delivered to appropriate membrane subregions through well-defined pathways. A recently proposed phenomenological theory of molecular sorting assumes that this process emerges from the coupling of two simpler biophysical mechanisms [1]: a) the tendency of similar molecules to phase separate into localized sorting domains, and b) domain-induced membrane bending, leading to the formation and ultimate detachment of specifically enriched vesicles. A central notion of the theory of phase separation is that only domains larger than a critical size are able to grow indefinitely, while smaller domains tend to be dissolved. In combination with a contextual process of domain extraction at a larger scale , this introduces a sort of “physical checkpoint”, such that only domains that are able to reach the “critical mass” can drive extraction (distillation) events, and are thus “productive”. This scenario is consistent with experimental observations where, in addition to “productive” long-lived domains that grow into vesicles that are ultimately extracted from the membrane, a large number of short-lived, small domains, which tend to disassemble and ultimately disappear, is also detected. The existence of such a “physical checkpoint” is reflected in the particular shape of the size distribution for productive domains (Eq. 5), which exhibits a maximum at sizes of the order of the critical size , a slowly (logarithmically) decaying intermediate region, followed by a non-universal decaying tail at scales larger than the extraction threshold (Fig. 6(a), blue histogram). On the other hand, the existence of a biochemical checkpoint has also been postulated in this regard [17, 18]. It would be quite interesting to further investigate the relation between these two effects. It is worth observing here that in the actual biophysical process, a wealth of different biomolecular species takes place in the formation and stabilization of sorting domains. In the theoretical model, the complex interplay between these different species is effectively encoded into the value of the single dimensionless interaction parameter . Intriguingly, even such a highly simplified abstract model, founded on basic notions from the theory of phase separation, is able to capture relevant features of the real process. This yields support to the hypothesis that endocytic sorting is driven by an underlying phase separation process.
We have here considered a spatially homogeneous probability of nucleation of sorting domains. It has been observed however that nucleation events may cluster in “hotspots” or “nucleation organizers” [41]. The origin of such hotsposts is an interesting open question, that deserves to be investigated in the framework of phase separation theory.
Acknowledgements.
We gratefully acknowledge useful discussions with Igor Kolokolov, Vladimir Lebedev, Guido Serini, Carlo Campa and Roland Wedlich-Söldner. We thank Xinxin Wang, Sandra Schmid and Gaudenz Danuser for kindly sharing their data and for their insightful observations. Numerical calculations were made possible by a CINECA-INFN agreement providing access to CINECA high-performing computing resources.Appendix A Rate of supercritical domain production
The rate at which supercritical domains are generated in the non-equilibrium driven stationary state of the lattice model of molecular sorting is assumed, in Eq.(10), to be proportional to the square of the free molecule density . Here we provide a justification for this assumption, based on a simplified mean-field model of monomer aggregation.
Consider a model of domain formation by means of monomer attachment and detachment, and suppose that there exists a threshold area value above which monomer detachment from domains is not possible, and clusters grow irreversibly. This way, the existence of a critical size in the system is artificially reproduced. Let us call the number density per unit surface of domains of area , and the number density per unit surface of domains with . The incoming flux of monomers is . The set of mean-field Smoluchowski equations for this model is:
| (29a) | ||||
| (29b) | ||||
| (29c) | ||||
where (and, respectively, ) are dimensional coefficients representing the attachment (detachment) rates of monomers on (from) domains of area , and for . According to reaction rate theory [42], in two dimensions, the effective reaction rate of two domains is proportional to the sum of their diffusion constants. In the approximation where only monomers can move (extended domains being much slower, as their diffusivity decreases with size as ), the effective aggregation rates become independent of and proportional to the diffusivity of a monomer. It is also important to notice that dimers can split with a rate proportional to per molecule, i.e. . Summing over the areas to obtain an equation for , we find
| (30a) | ||||
| (30b) | ||||
The stationary condition for the subcritical domains implies . In order for to be approximately constant with a non-zero production of supercritical domains, the second term must be subdominant already at moderately large values of . One can then conclude that the net production of supercritical domains is well approximated by the equation . The quantity corresponds to the number density of supercritical domains used in the main text, thus qualitatively justifying Eq. 10.
Appendix B Metastability in lattice-gas models
Assuming that in a quasi-equilibrium condition the molecule gas density outside of a growing domain in a lattice-gas model follows the Gibbs-Thomson relation [36], where is the line tension of the domain, using Eq. 3 we get
| (31) |
Therefore the critical value of the domain radius is
| (32) |
This is a non-equilibrium result, in which and represent respectively the bulk average density of the molecule gas and the equilibrium density of the gas at the interface with a large flat domain.
These two quantities, together with , can be easily estimated at equilibrium in a lattice-gas model. Consider an equilibrium lattice-gas model with a chemical potential , and let be the energy gain due to the attractive interaction between two molecules occupying nearest-neighboring sites of the lattice. The energy function of the equilibrium lattice-gas system takes the form
| (33) |
where with for is a binary configuration representing the presence or absence of molecules on lattice sites. According to the dynamic viewpoint of Ref. 43, the expression
| (34) |
with the number of nearest neighbors of a given site, is obtained imposing a local equilibrium condition between the probability of growing and that of shrinking. In a mean-field equilibrium picture, the chemical potential is related to the average total density of free molecules in a supersaturated system. At the condensation point , the average total density is equal to the saturation density , which is the molecule density of a gas phase in equilibrium with a liquid phase (with flat interface). In terms of these quantities, the critical domain radius becomes
| (35) |
close to the condensation point. The expression is formally equivalent to Eq. 32 if we identify . Given two configurations of the dynamic lattice-gas model, the detailed balance condition implies
| (36) |
Focusing on the transition , in which a dimer fragments into two monomers as a consequence of one of them hopping away, and since for a square lattice, the previous relation implies , and consequently . Moreover, in a lattice gas at equilibrium, the average density of supersaturated gas is fixed by the chemical potential and is independent of the microscopic interaction strength. Therefore, from (35) the critical radius is seen to be a monotonically decreasing function of .
In the non-equilibrium stationary state relevant to the description of molecular sorting, is numerically observed to be a decreasing function of , however its decrease is slower than the decrease of , since is sustained by the constant molecular influx . This way, from Eq. 32 the critical radius is seen to be a monotonically decreasing function of also in the non-equilibrium case of interest.
Appendix C Alternative definitions of critical size
Maintaining the notations used in the main text, let us define the empirical critical size as the value such that
| (37) |
This value is well defined if is a continuous function which tends to 0 for and to 1 for . Equivalently, can be defined as the solution of
| (38) |
since (38) can be rewritten as
yielding
If is a decreasing function of , and is an increasing function of in a right neighborhood of 0 (as the simulations suggest, see e.g. Fig. 6), one can easily show that is a non decreasing function of by directly computing its derivative with respect to that variable. Then, for all one has:
References
- Zamparo et al. [2021] M. Zamparo, D. Valdembri, G. Serini, I. V. Kolokolov, V. V. Lebedev, L. Dall’Asta, and A. Gamba, Phys. Rev. Lett. 126, 088101 (2021).
- Mellman and Nelson [2008] I. Mellman and W. J. Nelson, Nat. Rev. Mol. Cell Biol. 9, 833 (2008).
- Lifshitz and Pitaevskii [1981] E. Lifshitz and L. Pitaevskii, Physical Kinetics, 1st ed., Course of Theoretical Physics, Vol. 10 (Pergamon Press, 1981).
- Slezov [2009] V. V. Slezov, Kinetics of first order phase transitions (John Wiley & Sons, 2009).
- Farkas [1927] L. Farkas, Z. Phys. Chem. 125, 236 (1927).
- Schmelzer et al. [1997] J. Schmelzer, G. Röpke, and F.-P. Ludwig, Phys. Rev. C 55, 1917 (1997).
- Berry et al. [2018] J. Berry, C. P. Brangwynne, and M. Haataja, Rep. Prog. Phys. 81, 046601 (2018).
- Hyman et al. [2014] A. A. Hyman, C. A. Weber, and F. Jülicher, Ann. Rev. Cell Dev. Biol. 30, 39 (2014).
- Lyon et al. [2021a] A. S. Lyon, W. B. Peeples, and M. K. Rosen, Nat. Rev. Mol. Cell Biol. , 1 (2021a).
- Gamba et al. [2005] A. Gamba, A. de Candia, S. Di Talia, A. Coniglio, F. Bussolino, and G. Serini, Proc. Natl. Acad. Sci. U.S.A. 102, 16927 (2005).
- Floris et al. [2021] E. Floris, A. Piras, L. Dall’Asta, A. Gamba, E. Hirsch, and C. C. Campa, Comput. Struct. Biotechnol. J. 19, 3225 (2021).
- Bergeron-Sandoval et al. [2021] Bergeron-Sandoval et al., Proc. Natl. Acad. Sci. U.S.A. 118, e2113789118 (2021).
- Kozak and Kaksonen [2022] M. Kozak and M. Kaksonen, Elife , e72865 (2022).
- Day et al. [2021] K. J. Day, G. Kago, L. Wang, J. B. Richter, C. C. Hayden, E. M. Lafer, and J. C. Stachowiak, Nat. Cell Biol. 23, 366 (2021).
- Zhao and Zhang [2020] Y. G. Zhao and H. Zhang, Dev. Cell 55, 30 (2020).
- Lomoriello et al. [2022] I. S. Lomoriello, S. Sigismund, and K. J. Day, Curr. Opin. Cell Biol. 75, 102068 (2022).
- Loerke et al. [2009] D. Loerke, M. Mettlen, D. Yarar, K. Jaqaman, H. Jaqaman, G. Danuser, and S. L. Schmid, PLoS Biol. 7, e1000057 (2009).
- Aguet et al. [2013] F. Aguet, C. N. Antonescu, M. Mettlen, S. L. Schmid, and G. Danuser, Dev. Cell 26, 279 (2013).
- Kadlecova et al. [2016] Z. Kadlecova, S. J. Spielman, D. Loerke, A. Mohanakrishnan, D. K. Reed, and S. L. Schmid, J. Cell Biol. 216, 167 (2016).
- Grassart et al. [2014] A. Grassart, A. T. Cheng, S. H. Hong, F. Zhang, N. Zenzer, Y. Feng, D. M. Briner, G. D. Davis, D. Malkov, and D. G. Drubin, J. Cell Biol. 205, 721 (2014).
- He et al. [2020] K. He, E. Song, S. Upadhyayula, S. Dang, R. Gaudin, W. Skillern, K. Bu, B. R. Capraro, I. Rapoport, I. Kusters, M. Ma, and T. Kirchhausen, J. Cell Biol. 219, e201908142 (2020).
- Wang et al. [2020] X. Wang, Z. Chen, M. Mettlen, J. Noh, S. L. Schmid, and G. Danuser, eLife 9, e53686 (2020).
- Lehmann et al. [2019] M. Lehmann, I. Lukonin, F. Noé, J. Schmoranzer, C. Clementi, D. Loerke, and V. Haucke, Sci. Adv. 5, eaax5775 (2019).
- Ehrlich et al. [2004] M. Ehrlich, W. Boll, A. van Oijen, R. Hariharan, K. Chandran, M. L. Nibert, and T. Kirchhausen, Cell 118, 591 (2004).
- Gamba et al. [2009] A. Gamba, I. Kolokolov, V. Lebedev, and G. Ortenzi, J. Stat. Mech. Theory Exp. 2009, P02019 (2009).
- Zamparo et al. [2015] M. Zamparo, F. Chianale, C. Tebaldi, M. Cosentino-Lagomarsino, M. Nicodemi, and A. Gamba, Soft Matter 11, 838 (2015).
- Lyon et al. [2021b] A. S. Lyon, W. B. Peeples, and M. K. Rosen, Nat. Rev. Mol. Cell Biol. 22, 215 (2021b).
- Becker and Döring [1935] R. Becker and W. Döring, Ann. Phys. 416, 719 (1935).
- Zeldovich [1943] Y. B. Zeldovich, Acta Physicochem. USSR 18, 1 (1943).
- Zamparo et al. [2019] M. Zamparo, L. Dall’Asta, and A. Gamba, J. Stat. Phys. 174, 120 (2019).
- Barabási et al. [1995] A.-L. Barabási, H. E. Stanley, et al., Fractal concepts in surface growth (Cambridge University Press, 1995).
- Boeynaems et al. [2018] S. Boeynaems, S. Alberti, N. L. Fawzi, T. Mittag, M. Polymenidou, F. Rousseau, J. Schymkowitz, J. Shorter, B. Wolozin, L. V. D. Bosch, P. Tompa, and M. Fuxreiter, Trends Cell Biol. 28, 420 (2018).
- Patel et al. [2015] A. Patel et al., Cell 162, 1066 (2015).
- Mettlen et al. [2010] M. Mettlen, D. Loerke, D. Yarar, G. Danuser, and S. L. Schmid, J. Cell Biol. 188, 919 (2010).
- Okabe et al. [2000] A. Okabe, B. Boots, K. Sugihara, S. N. Chiu, and D. G. Kendall, Spatial Tessellations, Wiley Series in Probability and Statistics (2000).
- Ryu and Cai [2010] S. Ryu and W. Cai, Phys. Rev. E 82, 011603 (2010).
- Note [1] Recalling also that the macroscopic interaction strength is a monotonically increasing function of the microscopic parameter (Fig. 4(b)).
- Liu et al. [2010] A. P. Liu, F. Aguet, G. Danuser, and S. L. Schmid, J. Cell Biol. 191, 1381 (2010).
- Ferguson and De Camilli [2012] S. M. Ferguson and P. De Camilli, Nat. Rev. Mol. Cell Biol. 13, 75 (2012).
- Hong et al. [2015] S. H. Hong, C. L. Cortesio, and D. G. Drubin, Cell Rep. 12, 2121 (2015).
- Nunez et al. [2011] D. Nunez, C. Antonescu, M. Mettlen, A. Liu, S. L. Schmid, D. Loerke, and G. Danuser, Traffic 12, 1868 (2011).
- Krapivsky et al. [2010] P. L. Krapivsky, S. Redner, and E. Ben-Naim, A kinetic view of statistical physics (Cambridge University Press, 2010).
- den Hollander et al. [2000] F. den Hollander, E. Olivieri, and E. Scoppola, J. Math Phys. 41, 1424 (2000).