New direct limit on neutrinoless double beta decay half-life of 128Te with CUORE
Abstract
The Cryogenic Underground Observatory for Rare Events (CUORE) at Laboratori Nazionali del Gran Sasso of INFN in Italy is an experiment searching for neutrinoless double beta (0) decay. Its main goal is to investigate this decay in 130Te, but its ton-scale mass and low background make CUORE sensitive to other rare processes as well. In this work, we present our first results on the search for decay of 128Te, the Te isotope with the second highest natural isotopic abundance. We find no evidence for this decay, and using a Bayesian analysis we set a lower limit on the 128Te decay half-life of T yr (90% CI). This represents the most stringent limit on the half-life of this isotope, improving by over a factor 30 the previous direct search results, and exceeding those from geochemical experiments for the first time.
Double beta () decay is a rare second-order Fermi interaction in which a nucleus transforms into its isobar by the simultaneous transmutation of two neutrons into two protons. This Standard Model process occurs with the emission of two electrons and two electron antineutrinos in the final state ( decay), such that lepton number () conservation holds; this process has been measured for 11 nuclei Barabash (2020), with half-lives in the range of 1018-1022 years. A second decay mode, neutrinoless double beta (0) decay, has been hypothesized but never observed. This process would consist of a nucleus -decaying into its daughter with the emission of two electrons and no antineutrinos in the final state, thus violating by two units. The experimental signature of this process is a peak in the two-electron total energy spectrum at the Q-value (Qββ) of the transition. The search for decay addresses one of the most relevant open questions in neutrino physics: its observation would establish that is not a symmetry of nature and neutrinos are Majorana fermions, providing a clear signature of physics beyond the Standard Model Bilenky and Giunti (2015); Dolinski et al. (2019). This would provide significant input for the explanation of the matter-antimatter asymmetry in the Universe via leptogenesis Canetti et al. (2012); Luty (1992), as well as constraints on the absolute mass scale and ordering of neutrinos complementing other approaches Dolinski et al. (2019); Dell’Oro et al. (2019).
CUORE is a ton-scale array of 988 TeO2 crystals designed to search for decay of 130Te. Besides having the world leading sensitivity for this process Adams et al. (2020, 2022a) due to its very large mass –742 kg of TeO2– and low background, CUORE is also a powerful detector for other rare processes, in particular other Te decay channels Adams et al. (2021a, b, 2022b). In this letter we report on a new direct search for 128Te decay. The CUORE array is grown from material with natural isotopic composition, which given the natural abundance of 31.75% Fehr et al. (2004) contains 188 kg of 128Te. Despite this high abundance, the direct search is challenging due to the low Qββ value of ( keV Wang et al. (2021) which lies in a region of the energy spectrum dominated by decay of 130Te and backgrounds from other natural radioactivity. The most recent 128Te decay half-life limit from a direct search experiment, T yr, was set by MiDBD in 2003 Arnaboldi et al. (2003). More stringent limits than this have been set by indirect geochemical measurements (see Campani et al. (2021) for a review), which evaluate the presence of the decay products accumulated in geological mineral samples of known age via the assessment of the parent/daughter nuclei ratio. The geochemical studies are not sensitive to the decay mode but rather to the sum of all the possible decays (2 or 0, to the ground or excited states), although the dominant contribution is expected to be the two-neutrino mode. The direct search result reported in this letter improves by more than 30-fold the previous best direct search limit for this isotope and surpasses – for the first time – the indirect geochemical results.
Before reporting the details of our direct search for 128Te decay, we present an updated evaluation of the half-life value for 128Te decay based the ratio T1/2(130Te)/T1/2(128Te) = Bernatowicz et al. (1992) from ion-counting mass spectrometry of Xe in ancient Te samples. Using the most recent 130Te decay half-life measurement, (stat.)(syst.) yr Adams et al. (2021a), we obtain TTe yr. This result replaces and is in agreement with the previously published value of yr Barabash (2020), which used the weighted average of the 130Te decay half-lives from CUORE-0 Alduino et al. (2017a) and CUORE Nutini et al. (2020).
The CUORE detector comprises 19 towers of 52 crystals each. The basic unit is a 555 cm3 TeO2 crystal operated as an individual cryogenic calorimeter. Each crystal is equipped with a Neutron Transmutation Doped (NTD) Ge thermistor Haller et al. (1984), used as a temperature sensor, and a Si resistor to inject controlled heat pulses for thermal gain stabilization. The crystal is coupled through PTFE and Cu supports to the coldest stage of a dilution refrigerator operating at a temperature of 10 mK Alduino et al. (2019). Any particle interaction in a TeO2 absorber crystal produces an energy deposition that is converted into heat (phonons) and measured via the temperature sensor. A large and novel cryogenic infrastructure has been developed to provide the needed cooling power Adams et al. (2022a). The CUORE cryostat is designed to meet the CUORE background specifications Alduino et al. (2017b), and provide a low thermal noise environment, minimizing vibration and thermal dissipation on the cryogenic calorimeters D’Addabbo et al. (2018); Dompè et al. (2020); Adams et al. (2022c); Alduino et al. (2019). CUORE is the most advanced realization of the cryogenic calorimetric technology, developed over 30 years using TeO2-based detectors Brofferio and Dell’Oro (2018).
We acquire data in day-long periods called runs, which in turn are grouped into 40 – 60 day collections called datasets. A typical dataset consists of 4 – 5 days of calibration runs, followed by 30 – 50 days of so-called physics runs, and finally another 4 – 5 days of final calibration to check the energy scale stability within a dataset. Calibration runs are performed using -ray sources of 232Th and 60Co to illuminate the detectors.
The procedure for the data acquisition and processing is described in Adams et al. (2020). We apply a digital optimum trigger algorithm Di Domizio et al. (2011); Campani et al. (2020) to the acquired continuous data stream and evaluate the amplitude of the triggered waveform by applying a frequency-based Optimum Filter (OF) that weights the Fourier components of the signal, exploiting the noise power spectrum to reduce the impact of noisy frequencies. We compensate for thermal gain variations in the crystals due to small fluctuations in their operating temperature with two independent methods. The first utilizes heat pulses of fixed amplitude injected regularly (every 570 s) via the Si heaters affixed to the crystals. For crystals with non-functional heaters we use the 2615 keV events from 208Tl in calibration data as a reference. We use the data from calibration runs to convert the thermal amplitudes to units of energy. We exploit the granularity of the CUORE detector to perform a coincidence study and determine if signals in different crystals within a short time and spatial distance (typically of 10 ms and 150 mm) are attributed to the same physical interaction. We refer to these as coincident signals, to which we assign a multiplicity number, n, where corresponds to the number of crystals simultaneously involved in the interaction (e.g., two events in different crystals due to Compton scattering of the 2615 keV 208Tl line are labeled as ), with single-crystal interactions labeled as . We apply a pulse shape analysis (PSA) algorithm to identify and discriminate pulses due to particle energy depositions from non-physical signals (e.g., noise spikes, abrupt baseline disturbances, pile up events).
The present analysis includes 5 datasets for a total TeO2 exposure of 309.33 kgyr or 78.56 kgyr of 128Te. These are the same data we used to measure the 130Te decay half-life Adams et al. (2021a). However, the latter exposure is marginally lower (300.72 kgyr) due to stricter selection criteria on the energy scale calibration in both the (3 MeV) and (3 MeV) regions for the decay result. In contrast, this analysis requires only good performance in the region.
In the following, we provide a detailed description of the analysis technique used to search for 128Te decay, whose signature is a mono-energetic peak at Q keV in the summed energy of the two emitted electrons. In the great majority of the cases the two electrons are absorbed by the same crystal: we therefore select events only, within a region of interest (ROI) of (820 – 890) keV.
The signal efficiency is the product of the containment efficiency and the total analysis efficiency. We define the containment efficiency () as the fraction of 128Te decay events that release their full energy, i.e. Qββ, in a single crystal Alduino et al. (2016). We evaluate by simulating events in the CUORE crystals Alduino et al. (2017b), obtaining %. The total analysis efficiency () is the product of the total reconstruction efficiency, the anti-coincidence efficiency and the PSA efficiency. The first term is the probability that an event with a given energy is triggered, its energy is correctly reconstructed, and it is not rejected as a pile-up event by the analysis cuts applied during the data processing; the anti-coincidence efficiency is the probability that a single-hit event is not assigned the wrong multiplicity due to a random accidental coincidence with an unrelated event; the PSA efficiency is the probability that events passing the base pile-up cuts also survive the PSA cut. We refer to Adams et al. (2020) for a more detailed description of the computation methods of these efficiency terms.
To avoid introducing bias when choosing the fit model of the present analysis, we choose the ROI based on the CUORE Background Model (BM) simulations, particularly taking into account backgrounds close to Qββ for 128Te (Fig. 1). Based on this, we choose an ROI of (820 – 890) keV.
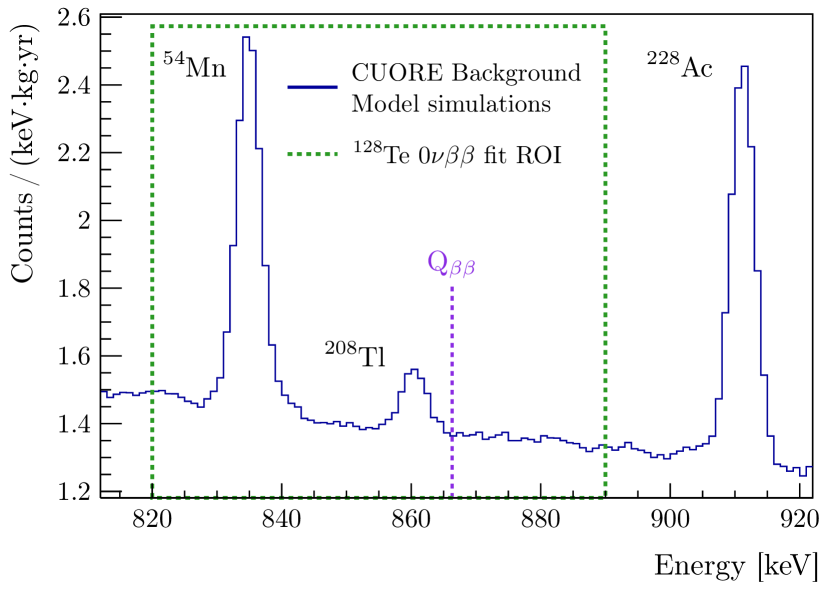
Multiple peaks populate this energy window: the closest expected structure to Qββ is a line at 860.6 keV from 208Tl, a 232Th chain element. A prominent peak at 834.8 keV due to a 54Mn line is also identified: the presence of 54Mn stems from the cosmogenic activation of copper Alduino et al. (2017a); Laubenstein and Heusser (2009). The visible peak to the right of Qββ is the 911.2 keV line from 228Ac, another element of the 232Th chain. In addition, we observe a continuous background contribution mainly induced by the 2 decay of 130Te and by multiple Compton scattering of the various rays from environmental radioactivity and cosmic radiation. The choice of the ROI is driven by the need for the energy window to fully contain the events of the posited peak, while being large enough to include and constrain the background structures, allowing us to evaluate the signal rate correctly. The ROI contains the 54Mn and 208Tl peaks, while the 228Ac line is excluded as it is 45 keV ( with FWHM energy resolution of keV in the ROI) away from Qββ.
We perform a simultaneous binned Bayesian fit on the five included datasets. The fit is performed with the Bayesian Analysis Toolkit (BAT) Caldwell et al. (2009), that samples from the posterior probability density by performing a Markov Chain Monte Carlo (MCMC) using the Metropolis-Hastings algorithm. We fit the CUORE spectrum over the chosen ROI; the lower limit on the 0 decay rate is taken as the rate corresponding to 90% of the marginalized posterior.
We fit the CUORE spectrum over the chosen ROI with a likelihood that includes the posited signal peak plus the background structures present in the ROI, namely the 54Mn peak, the 208Tl peak, and a continuum distribution. We model the latter with a linear function, that describes the decreasing trend over the fit region. The binned likelihood for each dataset is the product of Poisson terms, and the total likelihood is:
| (1) |
where indexes the dataset, and the index runs over the 140 bins (0.5 keV/bin). In the approximation of small bin width, the number of expected counts in the -th bin can be taken as the value of the model function at the center of the bin:
| (2) |
where , and are the number of counts at the signal, 54Mn and 208Tl peaks, while , , , and are the values at the -th bin of the probability density functions used to model the shape of each component.
We model the shape of each peak as the sum of three Gaussian distributions based on the CUORE detector response function, corrected for the energy dependence of the detector response (energy-resolution scaling and energy reconstruction bias) studied in Ref Adams et al. (2020). The definition of each component of Eq. 2 is detailed in the following. We implement all terms as parameters of the fit.
The 0 decay rate is connected to the expected number of signal counts for a given dataset through the formula:
| (3) |
where is Avogadro’s constant, is the TeO2 molar mass, is the 128Te natural isotopic abundance, is the dataset exposure (in units of kgyr), is the dataset total analysis efficiency, and is the containment efficiency. The decay rate in the model is a global parameter common to all the datasets. We make a statistical inference on this parameter of interest.
The 54Mn originates from cosmogenic activation of Cu, which occurred before the CUORE cryostat and detector structure components were moved underground at LNGS. This element has a half-life of 312.2 days; the analyzed data were taken over a period of 2 years, thus we expect the number of events due to 54Mn decay to decrease over time. To account for this reduction, we include an exponential multiplicative factor in the definition of the number of expected 54Mn events in each dataset:
| (4) |
where is taken as the start-time of the dataset with respect to the beginning of the data taking. The 54Mn rate (units of counts/(kgyr)) is a nuisance parameter of the fit common to all the datasets.
208Tl belongs to the naturally occurring 232Th chain. Given that the amplitude of the observed higher energy 208Tl peaks are constant in time across the datasets, we assume the 860.6 keV rate to be stable. We then define the expected number of events at this 208Tl line in the ROI for a given dataset as:
| (5) |
where the 208Tl decay rate is expressed in units of counts/(kgyr). As with the 54Mn rate, this represents a nuisance parameter of the fit.
We model the continuous background distribution as a linear function of energy according to the following expression:
| (6) |
where and are the expected number of background events and the background slope for a given dataset, is the energy at the center of the -th bin, and is the energy corresponding to center of the ROI. We define the expected number of events in each dataset as:
| (7) |
where BIds is the background index of dataset in units of counts/(keVkgyr) and is the bin width, which is constant across the energy spectrum. The slope and the background index are also nuisance parameters in the fit and are dataset-dependent quantities.
We adopt a uniform prior for each parameter of the fit for several reasons. Due to the 100-fold increase in exposure, CUORE’s sensitivity on is expected to be factor of 10 better with respect to the past direct limit. The absence of knowledge on at the range that CUORE can probe justifies the choice of a uniform prior for according to the Principle of Indifference, which assigns equal probabilities to all the possible values up to a maximum that can be greater that the past limit. The CUORE Background Model can provide information on some nuisance parameters, however it is constructed through a fit on the same data that are used for the present analysis, and including such information would bias the result. Thus, in the absence the of independent measurements, we use a uniform prior for all nuisance parameters. The signal, Mn and Tl rates and the BI are constrained to non-negative physical values only, while for the background slope both negative and positive values are allowed.
We run the Bayesian fit on the data, and find no evidence for 128Te 0 decay. From the marginalized posterior distribution of the signal rate, we extract a 90% CI limit of
| (8) |
This lower limit corresponds to a 90% CI upper limit on the 128Te 0 decay half-life of
| (9) |
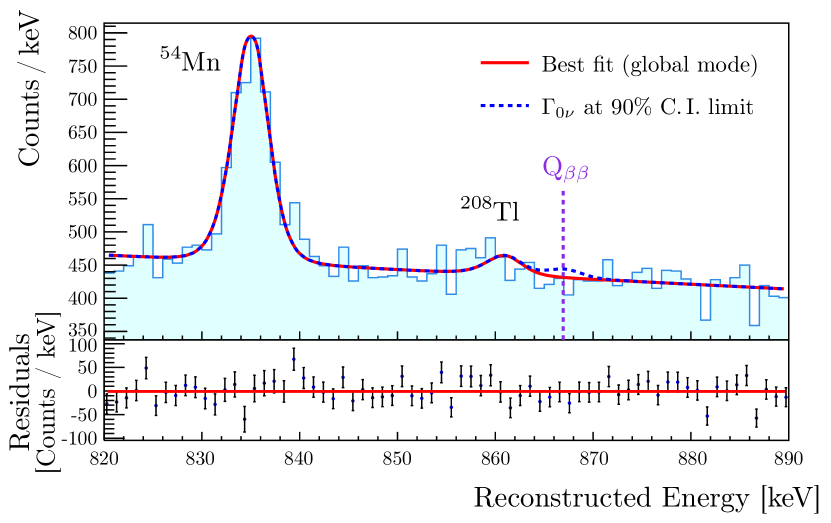
This result is the most stringent limit on the decay of 128Te to date, representing a more than 30-fold improvement over the previous limit Arnaboldi et al. (2003) from direct searches, and exceeds for the first time the combined and decay half life obtained by geochemical measurements. The fit result and the total ROI spectrum are shown in Fig. 2.
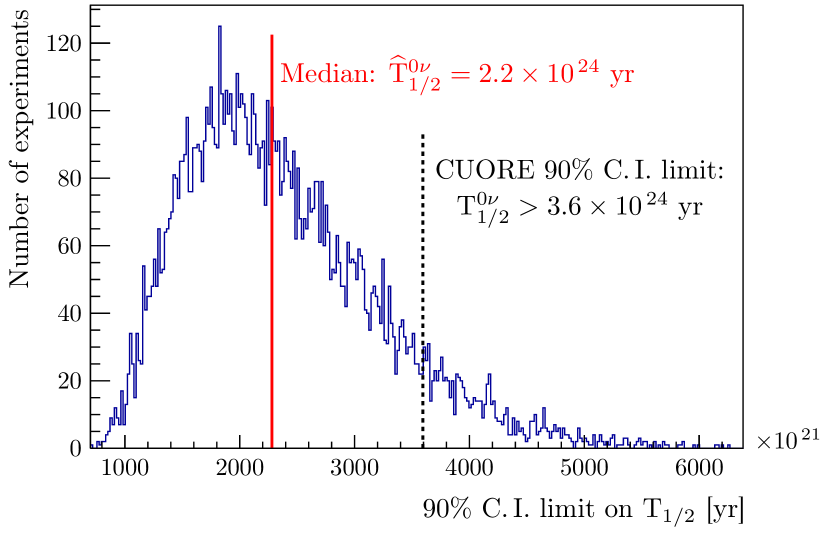
We extract the median exclusion sensitivity to 128Te decay by repeating the statistical only Bayesian fit on 104 toy-MC simulations of the experiment. We produce the toy-MCs using the global mode values of the background parameters from a Bayesian fit without the signal component on the CUORE data. The median exclusion sensitivity is the median of the distribution of the 90% CI limits on T, each resulting from a signal plus background fit to one of the 104 background-only toy-MCs. This distribution is shown in Fig. 3, and its median is . The probability to obtain a more stringent limit than the one observed with the CUORE data is 8.8%. We also repeat the fit on the data, allowing the signal rate to assume non-physical negative values. In this case, the global mode of is yr-1, resulting in an under-fluctuation with a statistical significance of , which is compatible with the 8.8% under-fluctuation obtained from the sensitivity study.
We summarize in Table 1 a series of systematic uncertainties affecting our limit. For this study, we run the fit without the constraint , to access the full range marginalized posterior. We adopt a fully Bayesian approach to evaluate the effect due to the uncertainties on the containment efficiency, the analysis cut efficiency and the 128Te natural isotopic abundance. We implement these as independent nuisance parameters in the likelihood with a Gaussian prior, whose mean and sigma are equal to the respective central value and associated error. We thus repeat the Bayesian fit activating one nuisance parameter at the time to allow its value to vary according to the corresponding prior.
We treat the systematics due to the uncertainty on the 128Te Qββ and on the detector response function parameters (namely the energy reconstruction bias and resolution scaling) using an alternative approach, which we refer to as the Repeated Fit Approach, because of the excessive computation time required to treat them as nuisance parameters in the fit. This method consists of repeating the fit for a series of discrete values of the systematic parameter under study, covering a region around its prior mean value. We then sum the marginalized posteriors obtained from each fit weighting by the prior probability of the parameter considered as systematic, and take the signal rate corresponding to the 90% quantile of the obtained distribution. We take additional care when treating the detector response parameter systematics. It was previously observed in CUORE Adams et al. (2020) that both the bias on the energy reconstruction and the resolution scaling exhibit an energy dependence which we model with two independent second order polynomial functions. As a consequence, a set of three correlated parameters describes the energy bias and another set of three exists for the resolution scaling. The correlations among these parameters are taken into account using multi-dimensional priors.
The dominant systematic is Qββ, which has an effect of 7.0% on the limit. We expect this due to the relatively large error on its literature value, ( keV Wang et al. (2021). All the other systematics affect the limit by less than 1%; the 128Te isotopic abundance, the analysis cut efficiency, and the detector response function parameters result in values below the intrinsic BAT uncertainty due to the MCMC stochastic behavior (0.3%).
| Systematic | Prior | Effect on |
| BAT Stat. Only fit | - | 0.3% |
| Bayesian Approach | ||
| Containment Efficiency | Gaussian | 0.4% |
| 128Te Isotopic Abundance | Gaussian | 0.3% (0.05%) |
| Analysis Cut Efficiency | Gaussian | 0.3% (0.1%) |
| Repeated Fit Approach | ||
| 128Te Qββ | Gaussian | 7.0% |
| Energy Reconstruction Bias | Multivariate | 0.3% (0.1%) |
| Energy Resolution Scaling | Multivariate | 0.3% (0.1%) |
In this paper, we present the first results on the 128Te decay search with the CUORE experiment. With a binned Bayesian fit of the CUORE data with a total exposure of 309.33 kgyr (78.6 kgyr of 128Te), we find no evidence for 128Te decay, and we set a 90% CI limit on the half-life of this process at T yr. This represents the most stringent limit in literature, improving by over a factor 30 the previous limit from a direct search experiment, and exceeding those from indirect geochemical measurements for the first time. From the analyzed exposure, the CUORE median exclusion sensitivity to this decay is yr, giving an 8.8% probability to obtain a stronger limit. The dominant systematic, affecting the result at the level of 7.0%, is due to the uncertainty on Qββ.
Acknowledgements.
The CUORE Collaboration thanks the directors and staff of the Laboratori Nazionali del Gran Sasso and the technical staff of our laboratories. This work was supported by the Istituto Nazionale di Fisica Nucleare (INFN); the National Science Foundation under Grant Nos. NSF-PHY-0605119, NSF-PHY- 0500337, NSF-PHY-0855314, NSF-PHY-0902171, NSF- PHY-0969852, NSF-PHY-1307204, NSF-PHY-1314881, NSF-PHY-1401832, and NSF-PHY-1913374; and Yale University. This material is also based upon work supported by the US Department of Energy (DOE) Office of Science under Contract Nos. DE-AC02- 05CH11231 and DE-AC52-07NA27344; by the DOE Office of Science, Office of Nuclear Physics under Contract Nos. DE-FG02-08ER41551, DE-FG03-00ER41138, DE- SC0012654, DE-SC0020423, DE-SC0019316; and by the EU Horizon2020 research and innovation program under the Marie Sklodowska-Curie Grant Agreement No. 754496. This research used resources of the National Energy Research Scientific Computing Center (NERSC). This work makes use of both the DIANA data analysis and APOLLO data acquisition software packages, which were developed by the CUORICINO, CUORE, LUCIFER and CUPID-0 Collaborations.References
- Barabash (2020) A. S. Barabash, Universe 6, 159 (2020).
- Bilenky and Giunti (2015) S. M. Bilenky and C. Giunti, Int. J. Mod. Phys. A 30, 1530001 (2015).
- Dolinski et al. (2019) M. J. Dolinski, A. W. P. Poon, and W. Rodejohann, Ann. Rev. Nucl. Part. Sci. 69, 219 (2019).
- Canetti et al. (2012) L. Canetti, M. Drewes, and M. Shaposhnikov, New J. Phys. 14, 095012 (2012).
- Luty (1992) M. A. Luty, Phys. Rev. D 45, 455 (1992).
- Dell’Oro et al. (2019) S. Dell’Oro, S. Marcocci, and F. Vissani, Phys. Rev. D 100, 073003 (2019).
- Adams et al. (2020) D. Q. Adams et al. (CUORE Collaboration), Phys. Rev. Lett. 124, 122501 (2020).
- Adams et al. (2022a) D. Q. Adams et al. (CUORE), Nature 604, 53 (2022a).
- Adams et al. (2021a) D. Q. Adams et al. (CUORE Collaboration), Phys. Rev. Lett. 126, 171801 (2021a).
- Adams et al. (2021b) D. Q. Adams et al. (CUORE), Eur. Phys. J. C 81, 567 (2021b).
- Adams et al. (2022b) D. Q. Adams et al., (2022b), arXiv:2203.08684 [nucl-ex] .
- Fehr et al. (2004) M. A. Fehr, M. Rehkamper, and A. N. Halliday, Int. J. Mass Spectrom. 232, 83 (2004).
- Wang et al. (2021) M. Wang, W. J. Huang, F. G. Kondev, G. Audi, and S. Naimi, Chin. Phys. C 45, 030003 (2021).
- Arnaboldi et al. (2003) C. Arnaboldi et al., Phys. Lett. B 557, 167 (2003).
- Campani et al. (2021) A. Campani, V. Dompè, and G. Fantini, Universe 7, 212 (2021).
- Bernatowicz et al. (1992) T. Bernatowicz, J. Brannon, R. Brazzle, R. Cowsik, C. Hohenberg, and F. Podosek, Phys. Rev. Lett. 69, 2341 (1992).
- Alduino et al. (2017a) C. Alduino et al. (CUORE), Eur. Phys. J. C 77, 13 (2017a).
- Nutini et al. (2020) I. Nutini et al., J. Low Temp. Phys. 199, 519 (2020).
- Haller et al. (1984) E. E. Haller, N. P. Palaio, M. Rodder, W. L. Hansen, and E. Kreysa, “NTD germanium: A novel material for low temperature bolometers,” in Neutron Transmutation Doping of Semiconductor Materials (Springer US, Boston, MA, 1984) pp. 21–36.
- Alduino et al. (2019) C. Alduino et al., Cryogenics 102, 9 (2019).
- Alduino et al. (2017b) C. Alduino et al. (CUORE Collaboration), Eur. Phys. J. C 77, 543 (2017b).
- D’Addabbo et al. (2018) A. D’Addabbo, C. Bucci, L. Canonica, S. Di Domizio, P. Gorla, L. Marini, A. Nucciotti, I. Nutini, C. Rusconi, and B. Welliver, Cryogenics 93, 56 (2018).
- Dompè et al. (2020) V. Dompè et al., J. Low Temp. Phys. 200, 286–294 (2020).
- Adams et al. (2022c) D. Adams et al., Progress in Particle and Nuclear Physics 122, 103902 (2022c).
- Brofferio and Dell’Oro (2018) C. Brofferio and S. Dell’Oro, Rev. Sci. Instrum. 89, 121502 (2018).
- Di Domizio et al. (2011) S. Di Domizio, F. Orio, and M. Vignati, JINST 6, P02007 (2011).
- Campani et al. (2020) A. Campani et al., J. Low Temp. Phys. 200, 321 (2020).
- Alduino et al. (2016) C. Alduino et al. (CUORE), Phys. Rev. C 93, 045503 (2016).
- Laubenstein and Heusser (2009) M. Laubenstein and G. Heusser, Appl. Radiat. Isot. 67, 750 (2009).
- Caldwell et al. (2009) A. Caldwell, D. Kollar, and K. Kroninger, Comput. Phys. Commun. 180, 2197 (2009).
- Dompè (2021) V. Dompè, Search for neutrinoless double beta decay of 128Te with the CUORE experiment, Ph.D. thesis, Gran Sasso Science Institute (2021).
I Supplemental Material
We develop and optimize the fit strategy on toy-MC spectra. We generate the toy-MCs according to the signal-plus-background model, extracting the values of , , BI and from the CUORE Background Model. We refer to Ref.Dompè (2021) for a more detailed discussion of the method. We take advantage of the toy-MCs to verify that the fit correctly reconstructs the simulated background components and to inspect if a bias is introduced in the decay rate reconstruction when a signal contribution is added in the toy-MC. We generate toy-MCs with no signal and run the fit independently on each of them. We then construct the distributions of the best-fit values from all the toy-MCs for each parameter, in order to compare the extracted and simulated values. As expected, these distributions are centered at the values used to produce the toy-MC. Thanks to the large number of toy-MCs, we are able to identify a small bias in the reconstruction of the BI and the slope corresponding to a 0.15% underestimation and a 1.6% overestimation, respectively. No correlations are seen between these two parameters. The reconstructed values of the 54Mn and 208Tl rates are compatible with the injected values. To test the signal rate reconstruction, we repeat the fit on five sets of 2000 toy-MCs, injecting a different signal amplitude in the range (2 – 10) yr-1 in each set. This range includes the signal rate corresponding to the CUORE sensitivity of yr-1 obtained from pure toy-MC, i. e. without including real data.
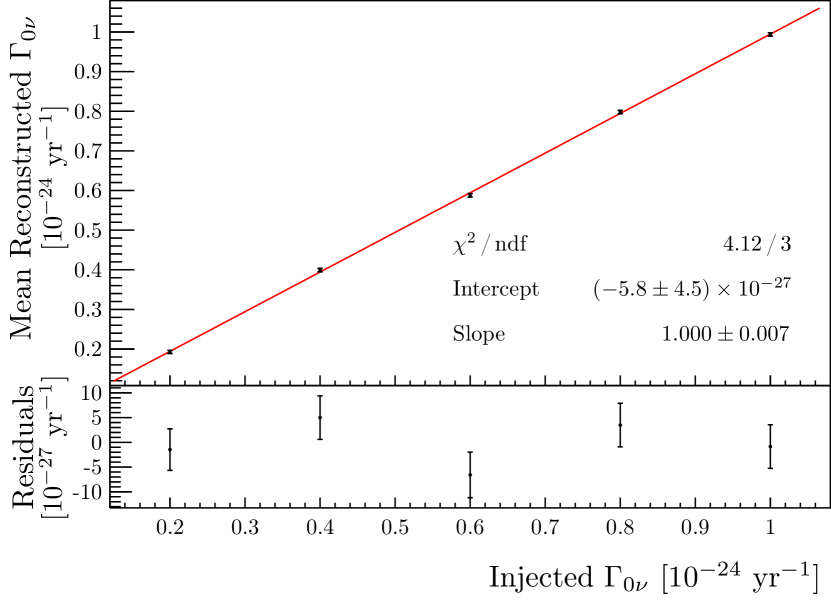
Figure 4 shows the mean reconstructed signal rate as a function of the injected one. The relation between the two is well described by a linear function: the intercept is compatible with 0 at a , and the slope is compatible with 1 within . These results allow us to conclude that no bias is introduced by the Bayesian fit in the signal rate reconstruction.
We also study the intrinsic stability of the BAT fit, by repeating it 2 times on the same toy-MC populated only with the background components, obtaining a % root mean square on the distribution of the limits at 90% credibility interval (CI).
Table 2 reports the ranges for all fit parameters. All parameters proportional to a number of counts, namely the signal, Mn and Tl rates, are allowed to assume only non-negative values. The BI of each dataset is further constrained according to a preliminary estimation of the number of background counts. The background slopes are allowed to assume also negative values.
Table 3 reports the value at the global mode for all parameters of the fit to the data.
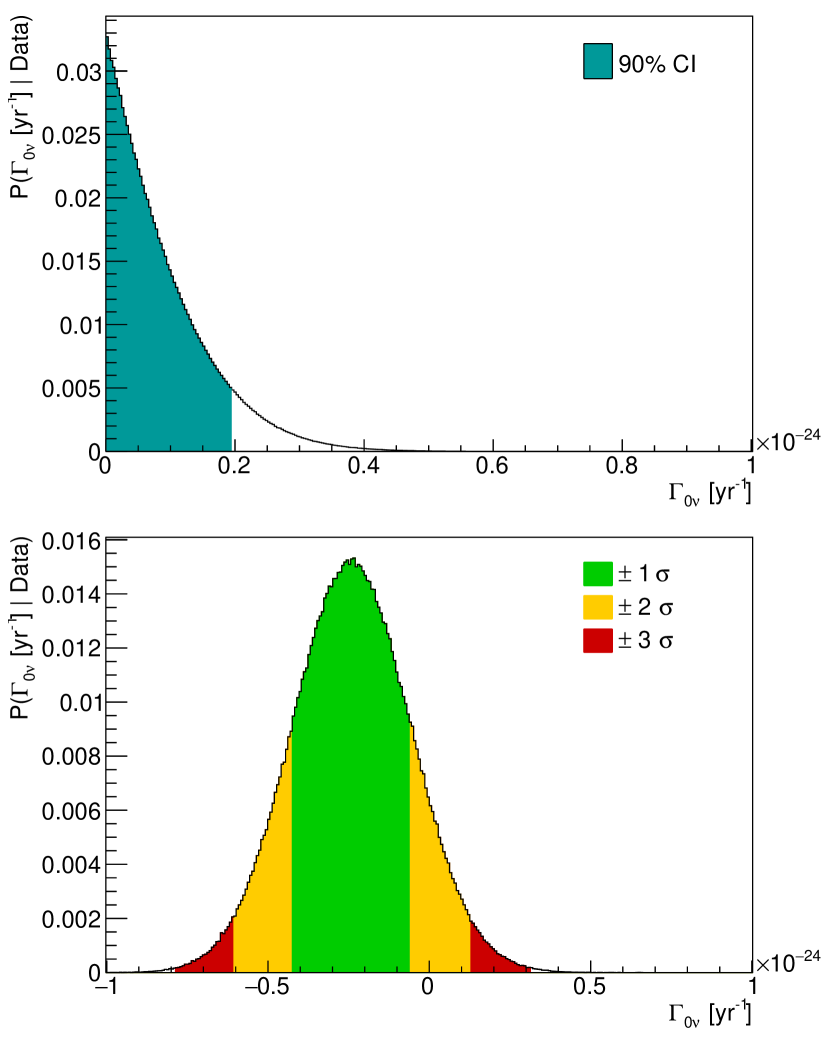
Figure 5 shows the posterior distribution for obtained from the reference fit, and from the alternative fit performed with the signal rate allowed to artificially assume non-physical negative values.
| Parameter | Prior Range |
|---|---|
| [0, 1.74] yr-1 | |
| [1.1634, 1.73] cts/(keVkgyr) | |
| [1.188, 1.6513] cts/(keVkgyr) | |
| [1.2453, 1.7374] cts/(keVkgyr) | |
| [1.2204, 1.7412] cts/(keVkgyr) | |
| [1.0221, 1.4536] cts/(keVkgyr) | |
| [-1, 1] 1/keV | |
| [-1, 1] 1/keV | |
| [-1, 1] 1/keV | |
| [-1, 1] 1/keV | |
| [-1, 1] 1/keV | |
| [0, 42.75] cts/(kgyr) | |
| [0, 6.16] cts/(kgyr) |
| Parameter | Fit Result | Units |
|---|---|---|
| 0 | yr-1 | |
| cts/(keVkgyr) | ||
| cts/(keVkgyr) | ||
| cts/(keVkgyr) | ||
| cts/(keVkgyr) | ||
| cts/(keVkgyr) | ||
| keV-1 | ||
| keV-1 | ||
| keV-1 | ||
| keV-1 | ||
| keV-1 | ||
| cts/(kgyr) | ||
| cts/(kgyr) |