DropTrack - automatic droplet tracking using deep learning for microfluidic applications
Abstract
Deep neural networks are rapidly emerging as data analysis tools, often outperforming the conventional techniques used in complex microfluidic systems. One fundamental analysis frequently desired in microfluidic experiments is counting and tracking the droplets. Specifically, droplet tracking in dense emulsions is challenging as droplets move in tightly packed configurations. Sometimes the individual droplets in these dense clusters are hard to resolve, even for a human observer. Here, two deep learning-based cutting-edge algorithms for object detection (YOLO) and object tracking (DeepSORT) are combined into a single image analysis tool, DropTrack, to track droplets in microfluidic experiments. DropTrack analyzes input videos, extracts droplets’ trajectories, and infers other observables of interest, such as droplet numbers. Training an object detector network for droplet recognition with manually annotated images is a labor-intensive task and a persistent bottleneck. This work partly resolves this problem by training object detector networks (YOLOv5) with hybrid datasets containing real and synthetic images. We present an analysis of a double emulsion experiment as a case study to measure DropTrack’s performance. For our test case, the YOLO networks trained with 60% synthetic images show similar performance in droplet counting as with the one trained using 100% real images, meanwhile saving the image annotation work by 60%. DropTrack’s performance is measured in terms of mean average precision (mAP), mean square error in counting the droplets, and inference speed. The fastest configuration of DropTrack runs inference at about frames per second, well within the standards for real-time image analysis.
I Introduction
Over the last decade, machine learning (ML) has become a popular and useful tool in most scientific and technological fields. Despite some limitations Succi and Coveney (2019); Riva, Wiederhold, and Succi (2022), deep learning-based ML tools can analyze massive datasets, make predictions, learn hidden patterns, draw inferences, or solve problems without being explicitly programmed for it LeCun, Bengio, and Hinton (2015). Recent advancements in ML techniques leveraging ability to analyze Big Data have led to many commercial applications such as handwriting recognition Darmatasia and Fanany (2017); Ahlawat et al. (2020), speech recognition Tandel, Prajapati, and Dabhi (2020); Han, Yu, and Tashev (2014), text sentiment analysis of posts on social media platforms Severyn and Moschitti (2015); Ramadhani and Goo (2017); Zhang, Wang, and Liu (2018), traffic management, customer service, and crowd management Osman et al. (2017); Ho et al. (2019); Yogameena and Nagananthini (2017); Ragesh et al. (2019), to name but a few. The state-of-the-art tools often surpass human-level performance in performing some of these tasks Kühl et al. (2020).
In the scientific domain, machine learning tools have proved to be indispensable assets in achieving recent milestones Senior et al. (2020); Carleo et al. (2019). Laboratories or large collaborative experiments are increasingly using machine learning tools to gain insights from the generated big data Yu et al. (2022); Coelho et al. (2021). Currently, ML approaches are being adapted for domain-specific applications across various scientific disciplines aiming at discovering the fundamental principles Thiyagalingam et al. (2022). In the microfluidics domain, for example, Hadikhani et al.Hadikhani et al. (2019) trained a neural network to predict fluid and flow properties using digital images of the experimental setup and Mahdi et al.Mahdi and Daoud (2017) used neural networks to predict size distribution of the droplets in an emulsion. A convolutional autoencoder model was trained to discover a low-dimensional representation to describe droplet shapes within a concentrated emulsion and classify stable vs unstable droplets from their shapes Khor et al. (2019).
Microfluidic applications often require fast and real-time monitoring, such as droplet counting, droplet tracking, the size distribution, and other properties of the droplets. In particular, automated tracking of moving objects is highly relevant in high-throughput microfluidic systems, which involve thousands of flowing droplets generated at very high frequencies Zhu and Wang (2017). Inferring these quantities using video analysis tools would reduce the need of specialized measuring hardware equipments Zamboni et al. (2021); de Novais Schianti et al. (2019). A digital camera connected to a microscope can conveniently be installed to observe small droplets within microfluidic chips and it would be totally sufficient for this purpose. However, the multi-stage image transformations in this setup add various types of noise at different stages Chen et al. (2009). Moreover, in some microfluidically generated materials, such as dense emulsions Montessori et al. (2021a, b), the droplets undergo significant deformations, accelerated motions, and form densely packed configurations that are often difficult to resolve and track in a video, thus making classical image analysis tools insufficient to infer quantities of interest. Despite these challenges, the desired observables can be measured by the latest computer vision tools that are being used to track objects such as cars, etc., from traffic surveillance cameras Tao et al. (2017); Lin and Sun (2018). These computer vision tool essentially perform two tasks, viz. identifying objects in an image and tracking the objects across sequential images.
This work aims to infer individual droplets’ trajectories by analyzing videos of microfluidic experiments using the latest computer vision tools. We combined the latest You Only Look Once (YOLOv5) algorithm for droplet recognition and the DeepSORT algorithm for droplet tracking in a single tool to achieve this goal. The object detector and tracking algorithms were tested previously on noise-free image data generated by Lattice Boltzmann simulations Diotallevi et al. (2009) of dense emulsions Durve, Mihir et al. (2021); Durve et al. (2021). Here, we extend the approach to the real images from microfluidic experiments significantly different from noise-free simulation images. The machine learning pipeline is tested on a microfluidic system producing clusters of densely packed, confluent droplets produced in a microfluidic setup reported in Bogdan et al. 2022 Bogdan et al. (2022). The system is important, among other reasons, because of intriguing similarities to naturally occurring clusters of cells. It also features previously unobserved dynamic modes and holds promise for future applications in tissue engineering and droplet libraries.
In order to make a deep learning-based object detection and tracking pipeline, a generic object network training needs a large training dataset containing images of the desired objects. Training dataset compilation is a labor-intensive bottleneck involving manual image annotation of the desired objects. Here, we explore strategies of mixing synthetically prepared images and manually annotated real images to train the YOLO object detector networks. We find an optimal mixing proportion of synthetic and real data to gain the best performance and twofold reduction in manual image annotation efforts. The strategies explored in this work are not explicitly limited to the YOLO algorithm and can be applied to train other object detector networks.
The paper is organized as follows. In the next section, we describe the experimental setup. In sec. III and sec. IV, we give a brief overview of the YOLO and the DeepSORT algorithms and describe the training procedure for various networks. In sec. V we report our results on experimental videos with a focus on droplet counting accuracy of various networks and training data mixing strategies.
II experimental setup
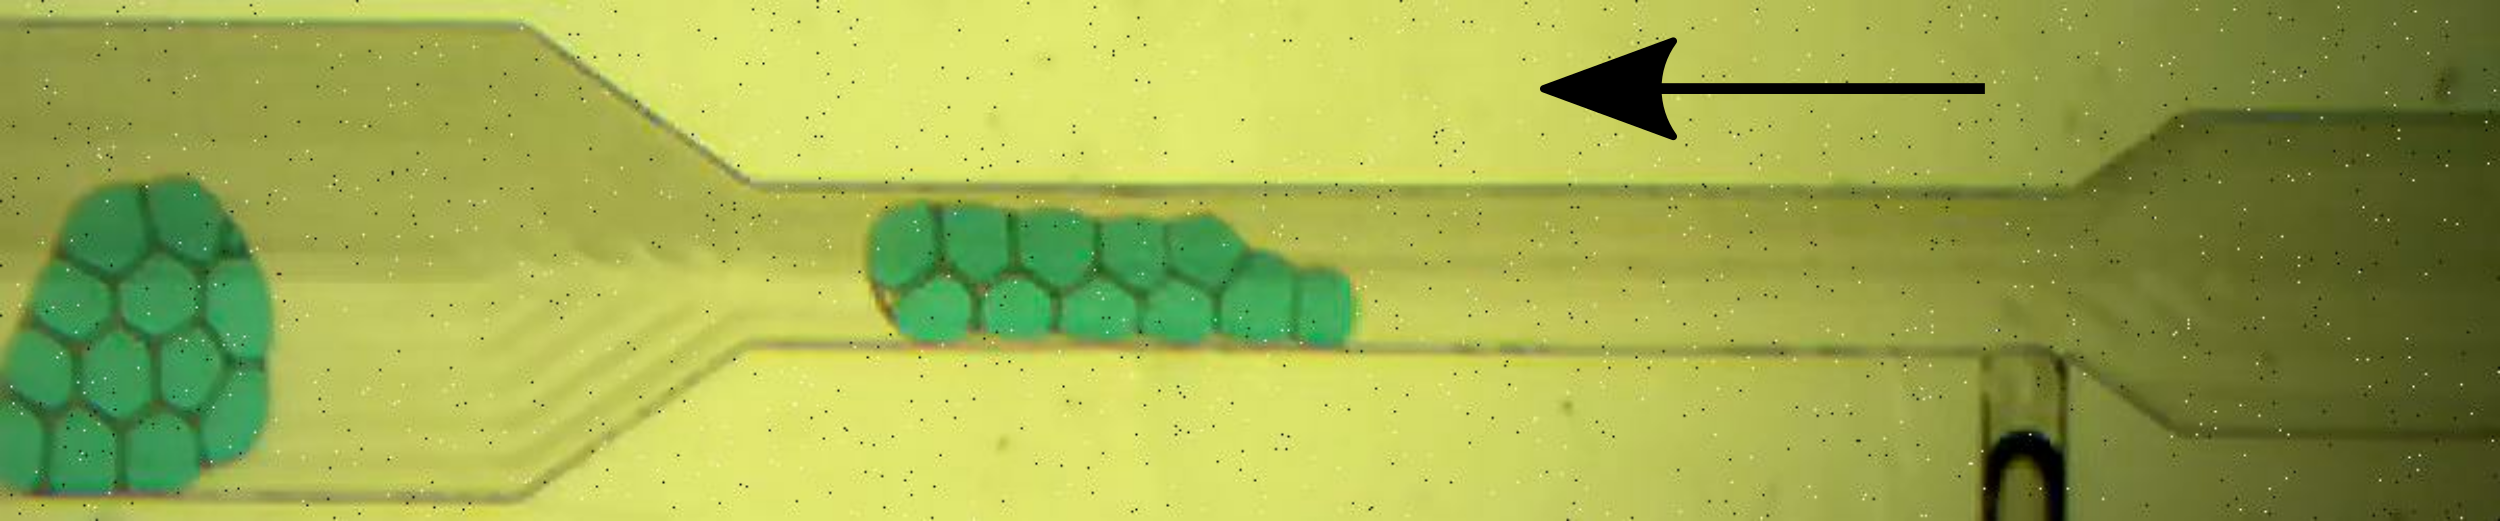
The algorithm aims to successfully track fluid droplets enclosed in an external fluid under conditions demanding for traditional particle tracking methods. A specific group of systems, presenting a considerable challenge to automated droplet tracking, features flows of groups of very densely packed droplets, separated by a thin, lubricating layer of a mixture of oils with surfactants preventing the merging of droplets. In an experimental system of interest, these droplets are formed at a T-junction of channels of rectangular cross-sections. Such generated monodisperse emulsion is pushed into a wider channel and broken up by the flow of an external phase into clusters of droplets in a flow-focusing junction. See Ref. Bogdan et al. (2022) for experimental details. This microfluidic system has been recently studied in the context of new dynamical modes in confined soft granular flows, such as stochastic jetting and dripping Bogdan et al. (2022). An example of a cluster formed in such a system is shown in Fig. 1. The fact that droplets fill up the space makes segmentation into separate droplets difficult. The droplets have various shapes, depending on forces acting from their neighbors. In addition, various coloring contrasts between the droplets, their interfaces, and their surrounding are used. The quality of the imagery may also differ between various experiments and researchers.
Consequently, each experiment is documented in a video containing a few hundred images. Several commercial platforms, such as Matlab, offer video data analysis. However, the ready-to-deploy commercial platforms often cannot be easily customized for a unique dataset and may fail to analyze specific video instances. This paper aims to introduce state-of-the-art open-source algorithms and efficient data preparation strategies that can further be adapted for training object tracking ML pipelines. Subsequently, this work’s trained networks can be used as a starting point for further enhancing the DropTrack using custom datasets.
III Algorithms
A successful object tracking requires achieving two sub-goals, i) identifying the objects to track and ii) tracking the detected object in sequential frames. Typically, these two tasks are handled by two different algorithms, individually specialized in object recognition and object tracking. In this work, we employ the You only look once (YOLO) algorithm for object recognition and the DeepSORT algorithm for object tracking.
III.1 You Only Look Once (YOLO)
You Only Look Once (YOLO) is a single-stage object detection algorithm. A network trained with the YOLO algorithm identifies objects in a given image. The network output consists of bounding boxes around the detected objects, the class/category of each detected object, and the individual detection’s confidence scores. The latest, the fifth version of YOLO (YOLOv5), is the fastest and most accurate object detector on two commonly used, general-purpose object detection datasets called Pascal VOC (visual object classes) pas and Microsoft COCO object detection datasets coc . Many instances report inference speed of the YOLOv5 networks at or above 60 frames per second (FPS) Zhou, Zhao, and Nie (2021); Junior and Alfredo C. Ulson (2021) for general object detection with various hardware configurations, and thus the YOLO object detector networks offer real-time image analysis. Due to their superior speed and accuracy, the YOLO networks are deployed for environmental monitoring Xu et al. (2021), quality control processing Yao et al. (2021), and checking protocol complience Walia et al. (2021) to name but a few applications.
The superior image analysis speed of the YOLO algorithm is achieved by its smart operating procedure Redmon et al. (2016); Redmon and Farhadi (2018). An input image is divided into grids. Each cell is responsible for detecting object centroid present in the cell. Each grid cell then predicts bounding boxes with their confidence score for each detected object and conditional class probabilities for the given object belonging to a specific class. The predicted bounding boxes and class probabilities are combined to produce the final output as a single bounding box around the detected object and the class of that object. This final output is then passed to the object tracking DeepSORT algorithm.
III.2 DeepSORT
The DeepSORT algorithm is employed for tracking all detected objects between two successive frames Wojke, Bewley, and Paulus (2017). By analyzing sequential frames, the DeepSORT can construct trajectories of all the detected objects. The DeepSORT algorithm works on two levels. At the first level, a classical Simple Online Real-Time tracking module Bewley et al. (2016) uses the Hungarian algorithm Kuhn (1955) to distinguish detected objects in two consecutive frames and assigns individual objects their unique identity. Kalman filtering Kalman (1960) is then used to predict the future position of the objects based on their current positions. At the second level, the deep network learns object descriptor features to minimize the identity switches as the object moves in subsequent frames. The YOLO and the DeepSORT algorithms together accomplish droplet recognition and tracking.
In the next section, we outline the training data acquisition process employed in this work and later describe the training process for the YOLO network for droplet detection.
IV Training the YOLO network
Object detector models are often employed to analyze real-world images. These images are highly complex, subject to various light conditions, camera noises, occlusions, and other environmental conditions. An object detector model needs to be trained with several images captured under a perceived broad range of environmental conditions for object recognition.
A typical object detector network training involves four key steps, selecting a network architecture, compiling training data, training a network, and testing the trained network’s performance. Below, we describe these steps one by one in the context of the YOLOv5 network for droplet recognition.
IV.1 The YOLO network architectures
The YOLOv5 network architecture is sketched in Fig. 2. It consists of a cross-stage part network (CSPNet) as its backbone, whose architecture is responsible for the feature extraction from the input image. The neck part of the YOLOv5 network is made up of a path aggregation network (PANet), which improves localization signals in lower layers to enhance object localization accuracy. The last head part of the YOLOv5 network generates feature maps to locate objects across various scales.
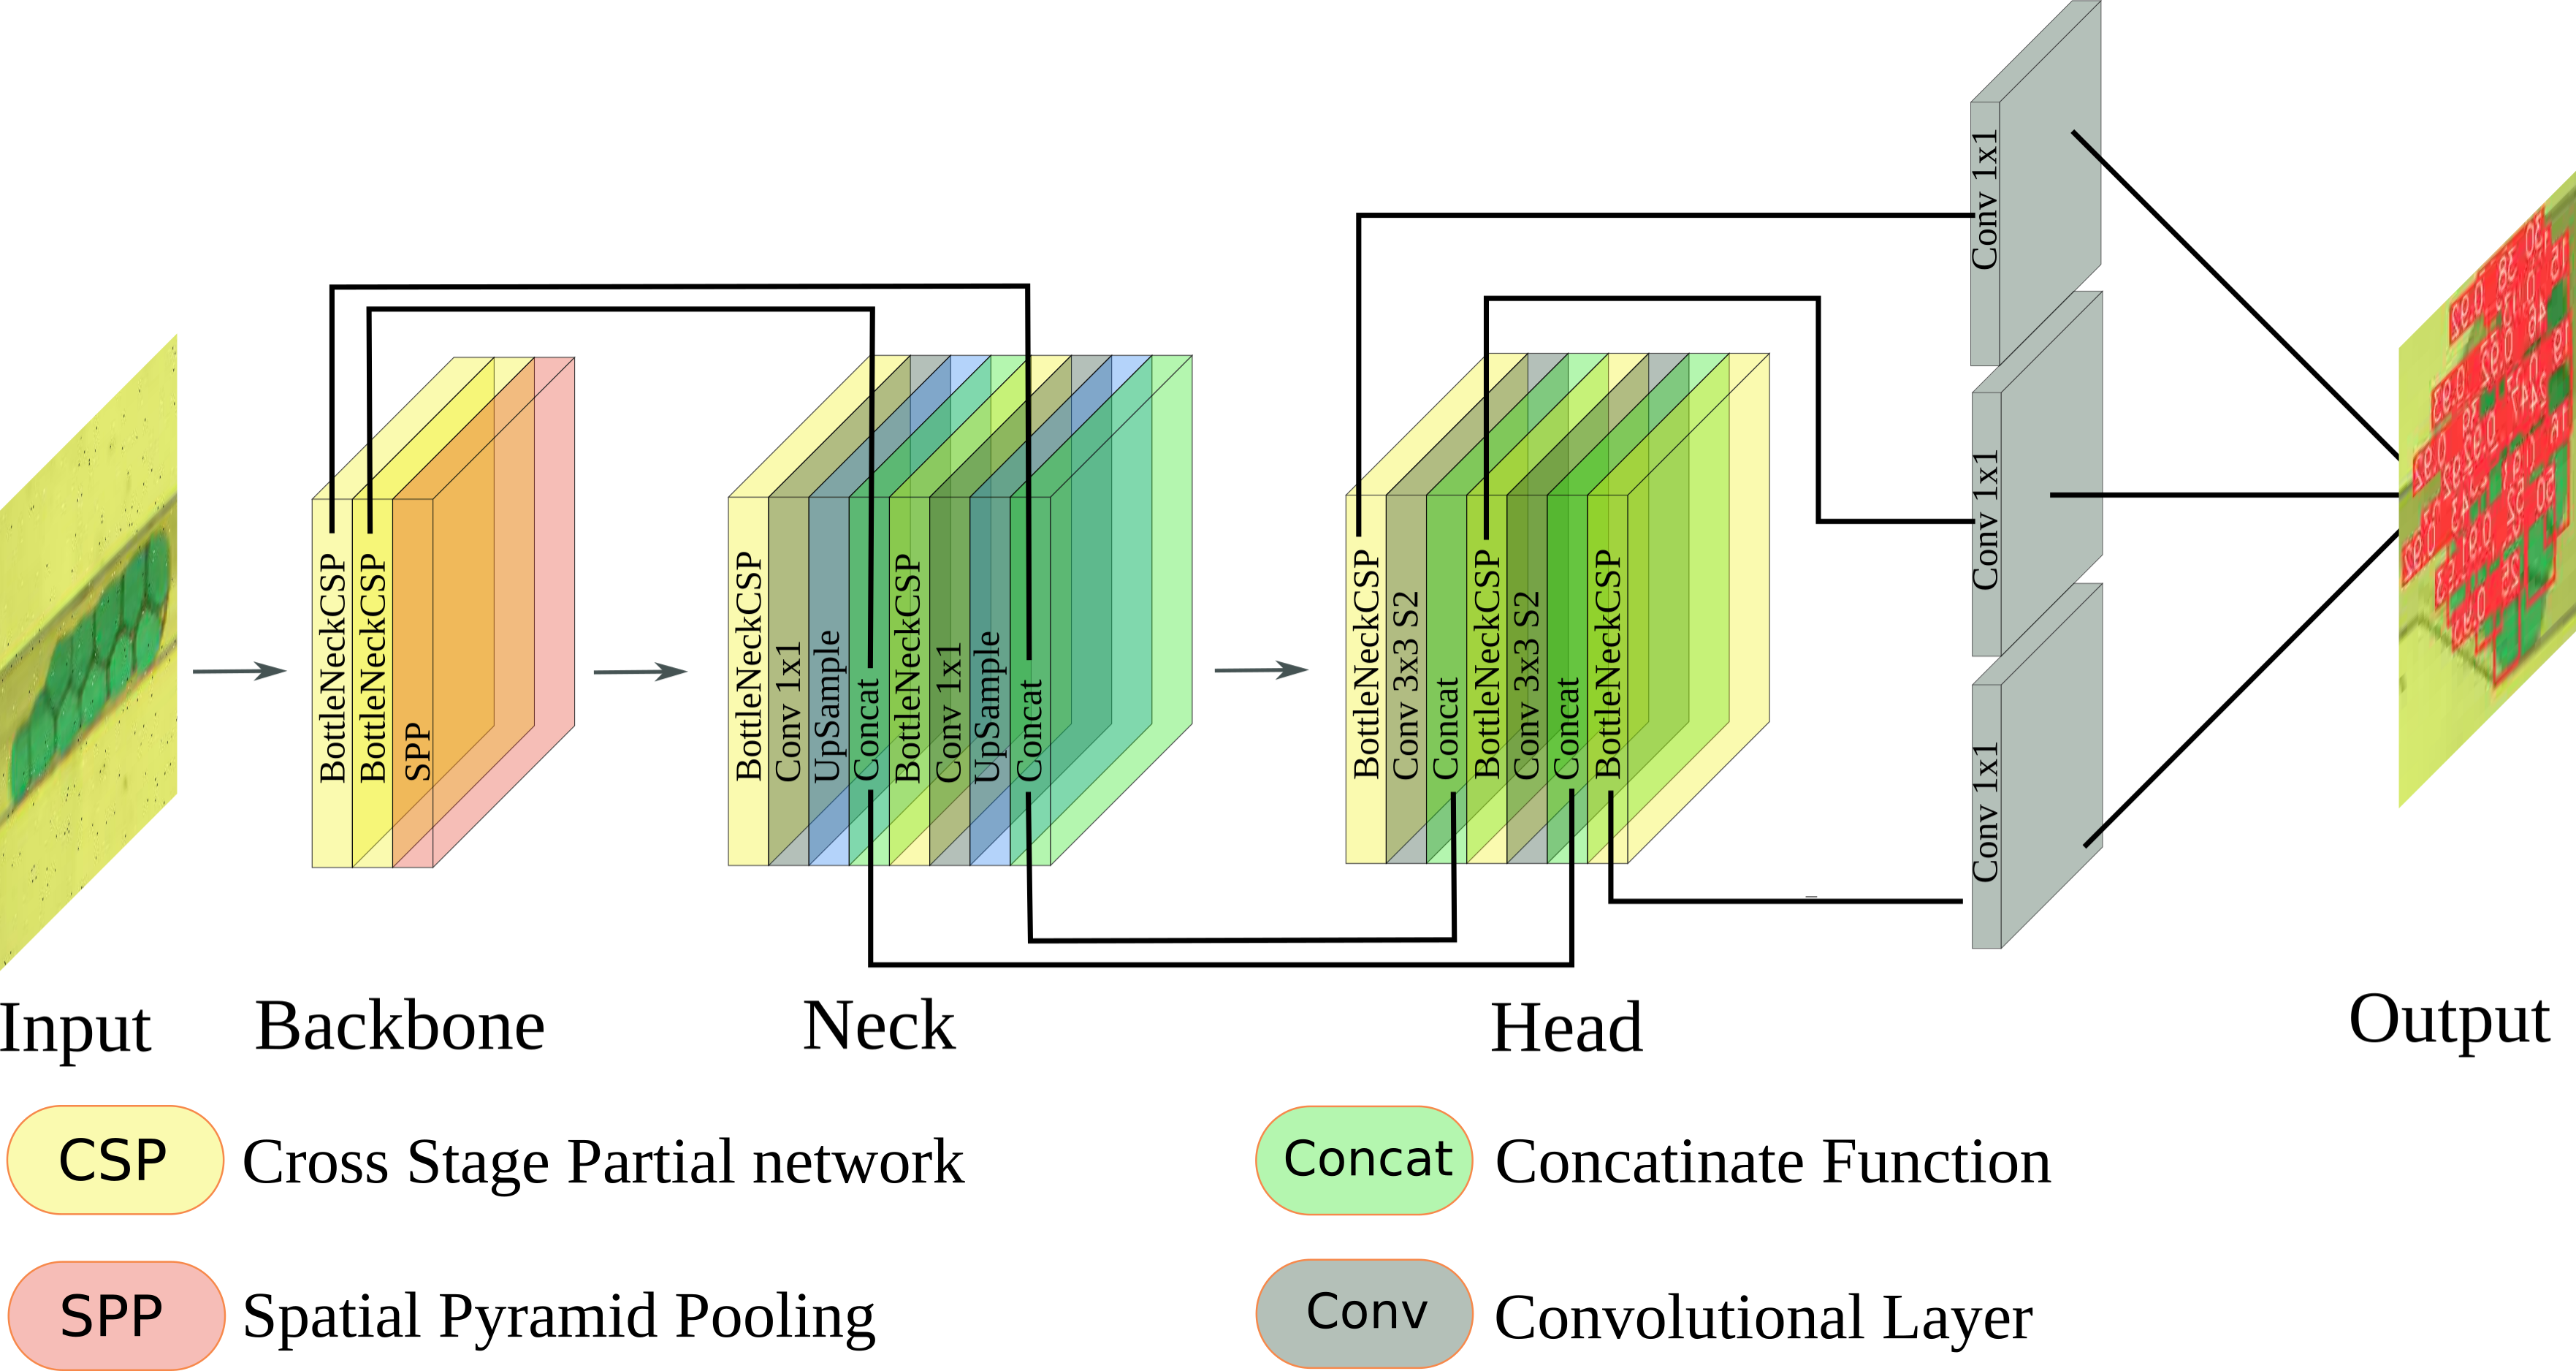
Table 1 tabulates the details of several YOLO network architectures. The different networks differ in the number of tunable parameters. The smaller networks are faster but less accurate than the larger ones. This work trains eight YOLOv5 networks to identify droplets in microfluidic experimental videos and compare their performances with a measure for droplet counting error.
| Network name | Image size (pixels) | # parameters (M) |
| YOLOv5s | 640x640 | 7.2 |
| YOLOv5m | 640x640 | 21.2 |
| YOLOv5l | 640x640 | 46.5 |
| YOLOv5x | 640x640 | 86.7 |
| YOLOv5s6 | 1280x1280 | 12.6 |
| YOLOv5m6 | 1280x1280 | 35.7 |
| YOLOv5l6 | 1280x1280 | 76.8 |
| YOLOv5x6 | 1280x1280 | 140.7 |
IV.2 Training data compilation
The training dataset is a key component for training a YOLO network to detect objects of interest. Training data acquisition is a significant bottleneck in the quick development of object detector networks due to the laborious data gathering and annotation process. The training dataset is typically prepared by collecting several images captured under various conditions and then annotating these images. The image annotation process involves identifying and noting down the location of all the objects of interest in an associated label file. In general, image annotation is a highly labor-intensive process where human operators manually mark the objects in the images. Recently, it has been observed that the object detector networks could be trained with hybrid datasets containing real and fake images, thereby alleviating the labor-intensive image annotation work to some extent Saleh et al. (2018); Wood et al. (2021). In this work, we explore strategies of making a hybrid training dataset by mixing images taken from real microfluidics experiments and synthetically prepared ones using simple computer graphics tools.
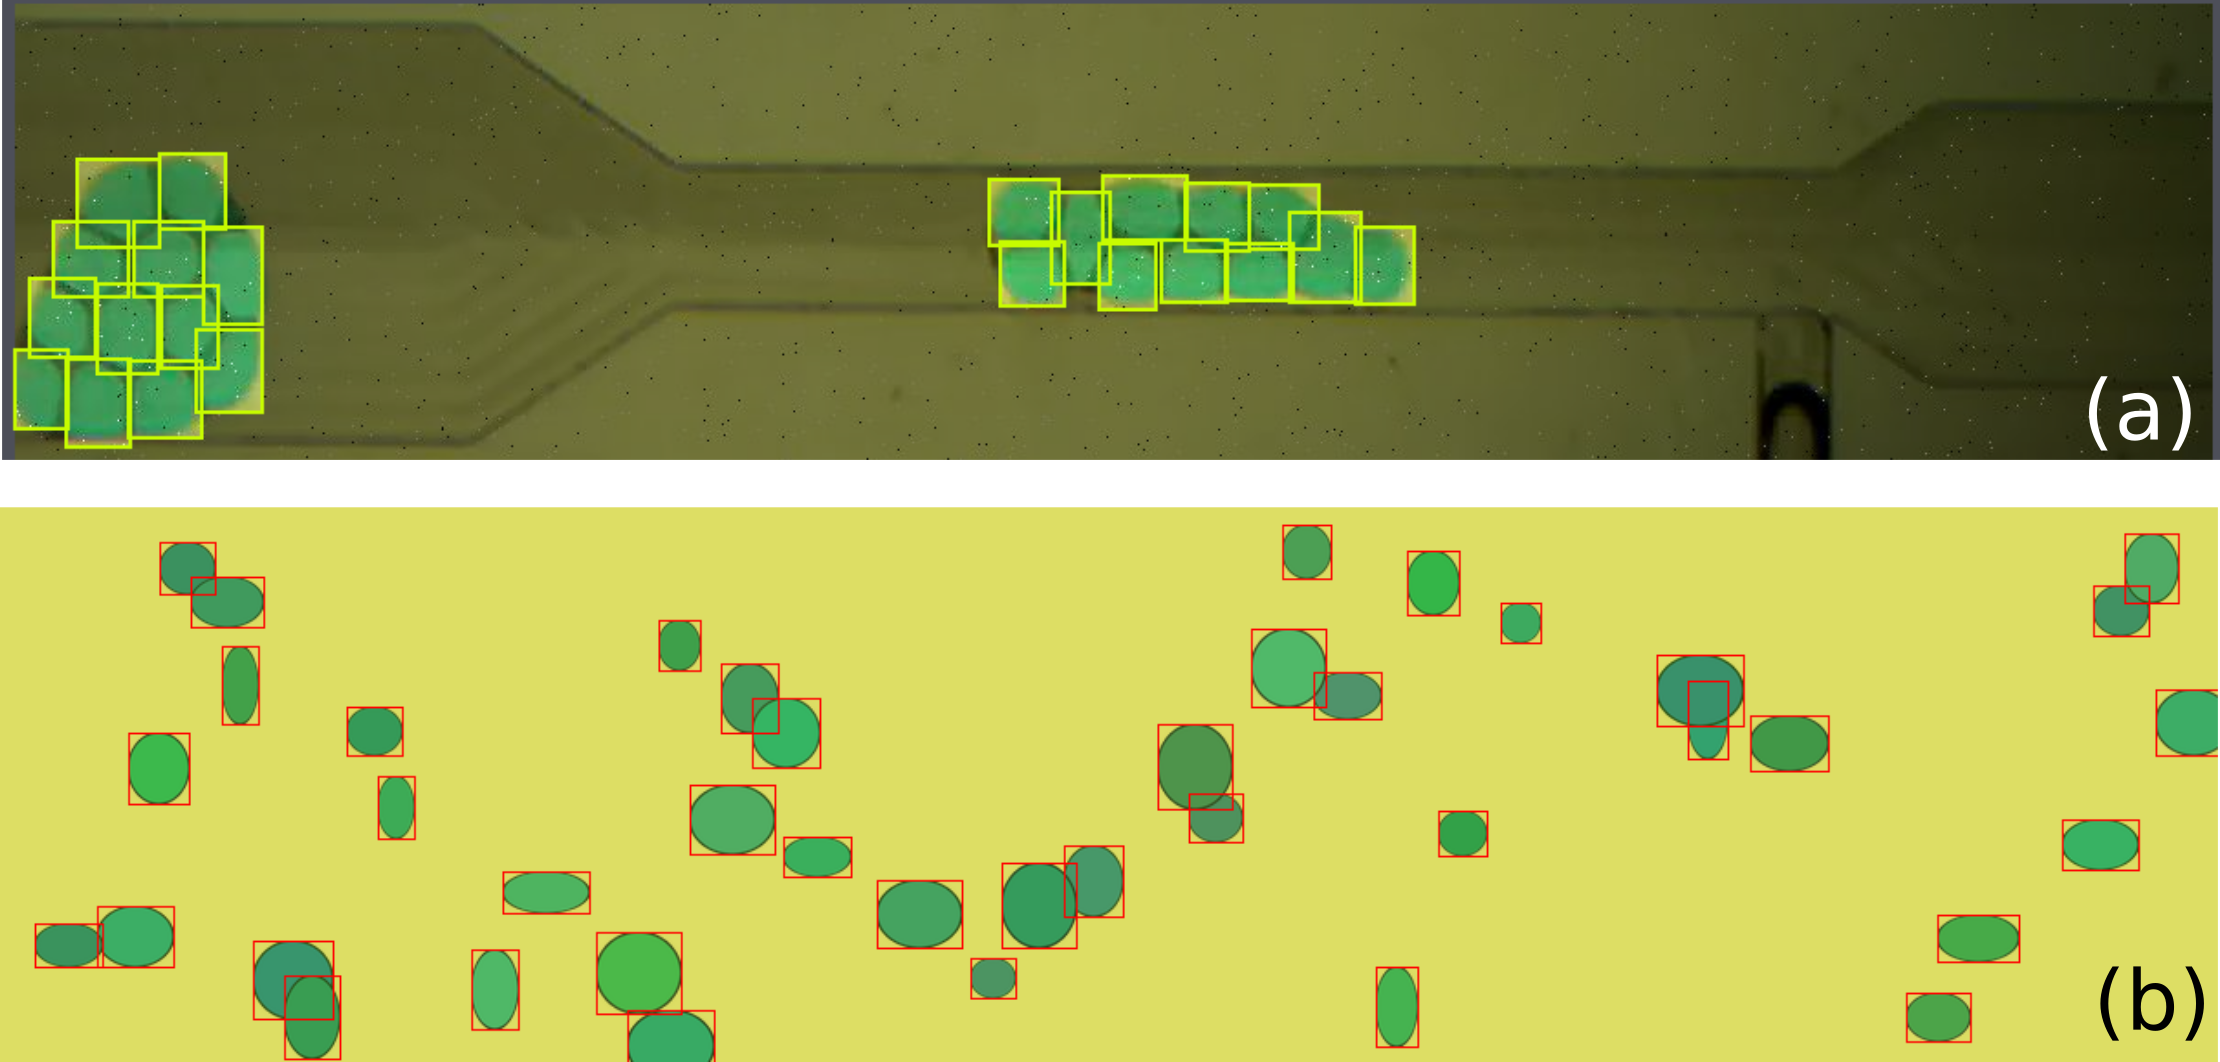
Hybrid training data used in this work to train the YOLO networks consists of two types of images. The first ones are the actual images taken from a single microfluidic experiment. The individual droplets in these images are manually annotated with the help of a free annotation tool Roboflow rob . A human operator draws the illuminated boxes around the droplets (see Fig. 3(a)). For compiling a training dataset, in total, 800 frames were extracted from a video of a single experiment as described in Sec. II. The video that served as a training data source is included in Fig. 1 (Multimedia view). For simplicity, we call these images manually labeled images. The second type of images are prepared using computer graphics tools. In each of these images, a few solid ellipses mimicking the droplets are placed randomly on a uniform color background (see Fig. 3(b)). The colors of solid circles and the background were varied randomly for each image to cover the wide color space observed in microfluidic droplet images. We call these images synthetic images. The hybrid training data consists of a mixture of these two types of images in various proportions, keeping the number of images in the training dataset constant at 800 images. In total, eleven datasets were prepared starting from 0% synthetic data, i.e., all the images are real images, to 100% synthetic images increasing in the steps of 10% along the way.
All the eight networks mentioned in table 1 were trained in separate training events, each involving a single network and a single training dataset out of the eleven training datasets. Thus, eighty-eight YOLO networks were trained to recognize droplets in the input images using the hybrid datasets described above. The details of the training procedure are described below.
IV.3 Training results
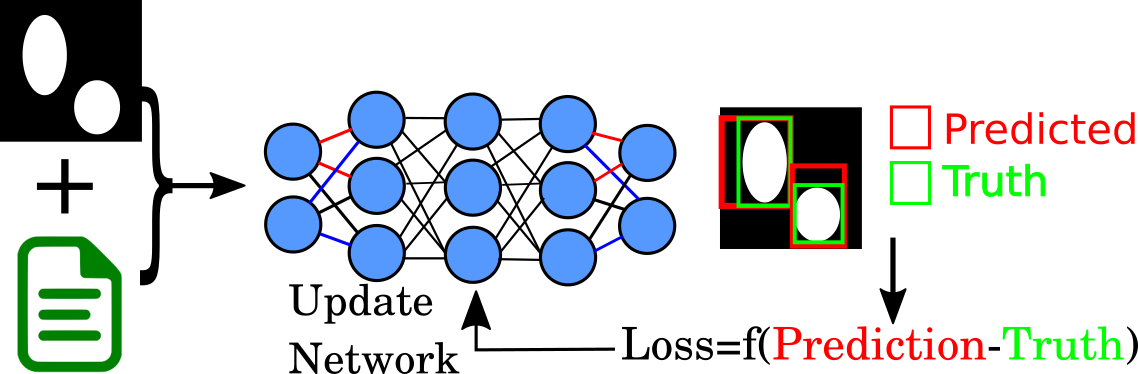
The YOLO network is trained to identify objects of interest in an episodic setting. A subset of training data, called a batch, is given as input to the network in each episode. The data batch contains images and associated label files (see Fig. 4). The network then outputs the predicted locations of the objects within these input images. The label files serve as a ground truth. A loss value for a batch of images is calculated using the difference between the ground truth, i.e., correct location and dimensions of the objects, and the network predictions for the same. The loss value is then used to update the network’s tunable parameters to minimize the loss value for subsequent iterations. The YOLOv5 loss value is computed using bounding box regression loss, classification loss, and objectness loss Choiński et al. (2021). The bounding box regression loss accounts for wrong anchor box detection. It is a mean squared error on the predicted bounding box () and the given ground truth (). The classification loss is a cross entropy loss calculated for object classification, and the objectness loss is a mean squared error calculated for objectness confidence score Choiński et al. (2021).
The loss function values are used to tune the parameters of the model. However, they do not measure the model’s actual performance in deployment conditions. The network’s performance is measured during the training using a separately reserved validation dataset. After a predefined number of episodes, a validation dataset is given as input to the network, and its accuracy is measured as the mean average precision (mAP) Henderson and Ferrari (2017) calculated from the precision and recall curves. The precision and recall values are computed with true-positive/negative and false-positive/negative detections. The true-positive/negative, false-positive/negative detections are determined by the intersection over union (IoU) of predicted bounding boxes and ground truth provided in the label file Rezatofighi et al. (2019). Thus, errors in manual image annotations affect the network training quality. At the end of the training, the optimized network, i.e., the values of tunable parameters, is stored in a separate file (called weights) that can be used for inference at later times.
The PyTorch implementation of the YOLO network training is open source and available online. We adopted an open-source code from this git repository yol for training the YOLOv5 networks. All the eight YOLO networks mentioned in table 1 were trained separately with eleven hybrid datasets as described above. The hyperparameters used for the training are mentioned here hyp . The training data contained 800 total images, with another 80 images reserved as a validation dataset. It is worth noting that the validation dataset contained only manually labeled images from real experiments to measure the network performance under the real deployment conditions.
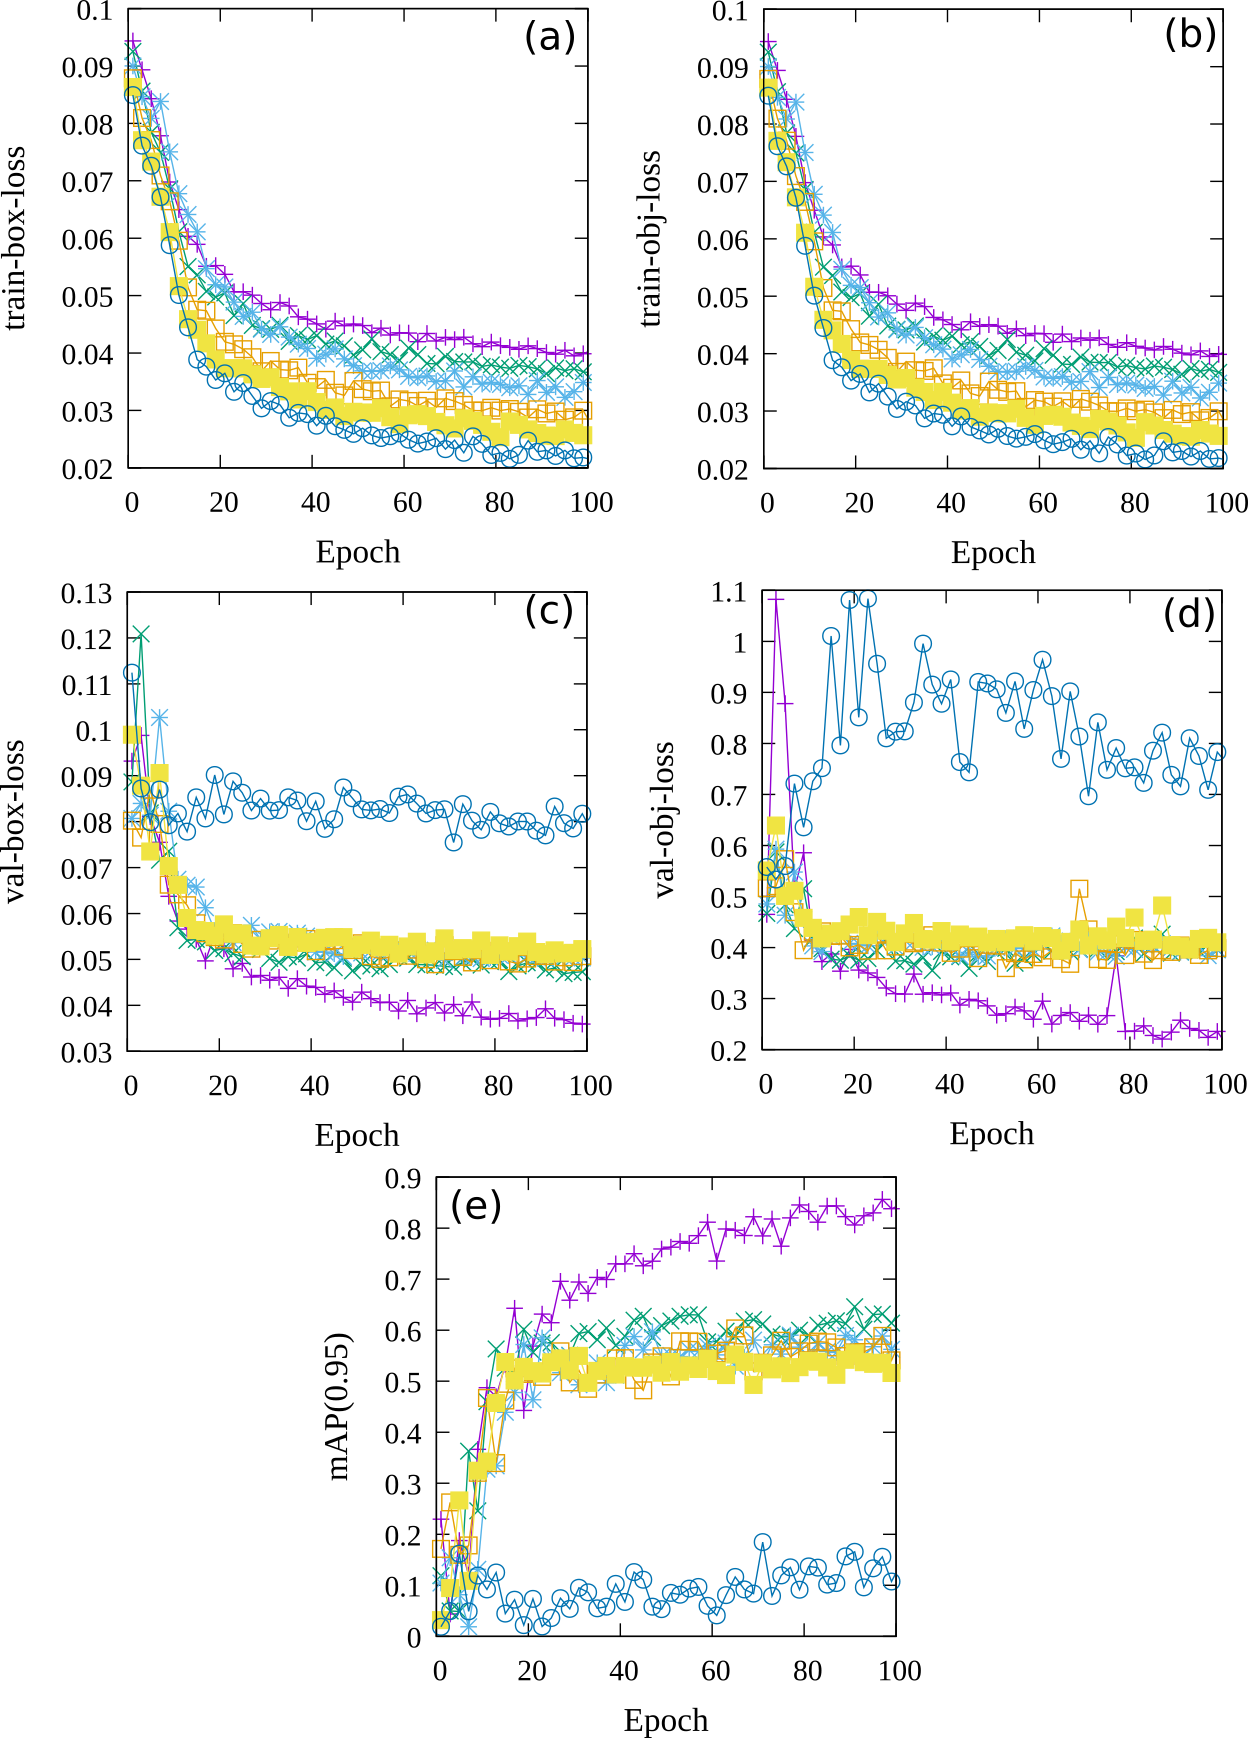
In Fig. 5 we show regression loss and objectness loss values during the training and validation for the YOLOv5l network for various training data compositions. The YOLOv5l network’s training profile represents all other training events as they show similar trends. Since the network is being trained to detect only a single class, classification loss measurements are not shown. Various indicators measure training progress. Figure 5 (a) and (c) show training box loss as the training progress for training and validation data, respectively. The training box loss is associated with an error in the bounding box prediction of the YOLO network. Figure 5 (b) and (d) show loss associated with object recognition during the training progress. As the training progresses, bounding box regression values and object loss values decrease and saturate to a value for all training datasets. However, three distinct patterns emerged for the loss values computed on the validation datasets. The loss values for purely synthetic images (blue circles in Fig. 5 (c) and (d)) remain comparatively high throughout the training, whereas the loss values for purely manually labeled images (purple plus in Fig. 5 (c) and (d)) decrease from high starting values and later saturate to minimum values. There is no significant difference in their loss saturation values for all other in-between datasets. A similar trend is observed for the network evaluation with mAP values. The network trained with a dataset containing only the manually labeled images achieves the highest mAP, which indicates the best performance. In contrast, the network trained with a dataset containing only the synthetic images has the lowest mAP score, indicating the worst performance on the validation dataset. All other networks attain almost identical mAP scores indicating that these models have comparable performance. The trained YOLOv5 networks are then combined with the DeepSORT and deployed to analyze videos from actual experiments.
V Results
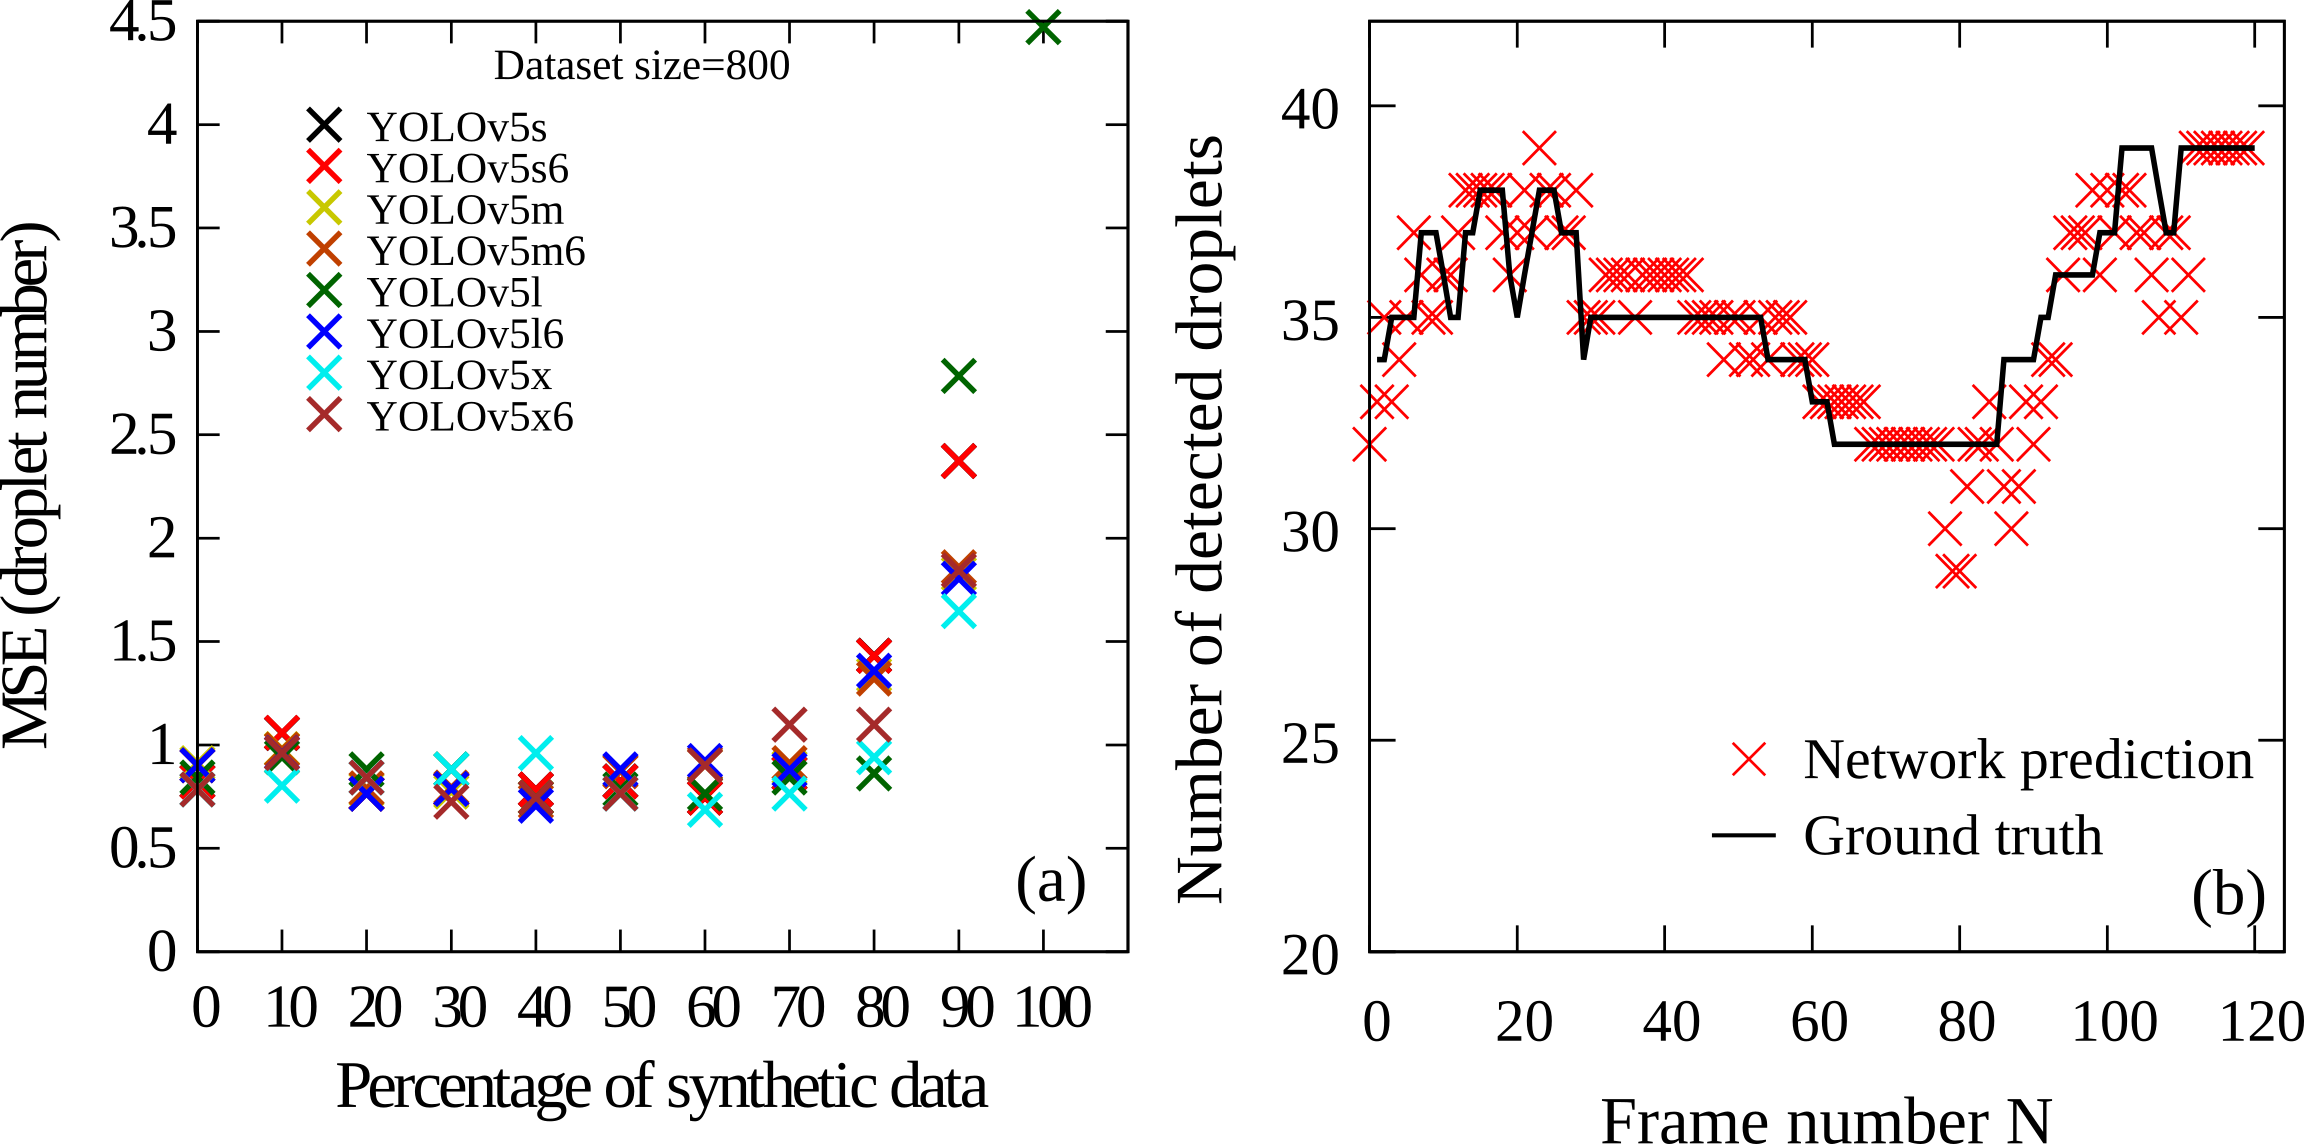
Below, we present inference results on a video from the microfluidic experiment. The analyzed video was not a part of the training dataset and served as a test case. The test case video contained more droplets and clusters than the one used for training the YOLO networks, thus presenting more complexity for the trained YOLO networks. Here, we analyze the network outputs for errors in droplet number counting, which is one of the basic desired microfluidic experimental video data analyses. The test video contained 120 frames. All the droplets in it were manually counted to measure the YOLO networks’ accuracy. Figure 6(b) shows the manually counted droplet numbers and the YOLOv5l network’s prediction for every frame in the test video. The trained YOLOv5 networks’ accuracy was defined as the mean squared error (MSE) between the detected droplets in each frame and manually counted droplet numbers serving as a ground truth. The MSE is computed as , where is the number of manually counted droplets in the frame, is the number of droplets located by the YOLOv5 network in the frame, and are the total number of frames in the test video. Figure 6(a) shows MSE for the YOLO networks trained with a varied proportion of manual and synthetic images in the training dataset. It is clear from Fig. 6(a) that there is no significant difference in the accuracy between networks trained with 0% of synthetic data and networks trained with up to 60% of synthetic data, thereby opening a prospect of significant savings on manual labeling efforts. It is worthwhile to note that the 60% synthetic data and 40% manually labeled data combination is not claimed to be a universal feature for all object detector models. Nevertheless, this result shows that a combination of real and synthetic data in an optimal proportion can significantly reduce manual efforts without any noticeable performance loss.
Finally, combining the optimal YOLO network with DeepSORT, trajectories of the individual droplets are traced in a video. We adapted open-source YOLOv5 and DeepSORT code Broström (2020) to run the inference. The snapshots of droplet identification and tracking are shown in Fig. 7(a)-(d). The YOLO algorithm predicts the red bounding boxes, and the DeepSORT algorithm achieves the tracking of these droplets by assigning unique IDs to the droplets. The full tracking video is included in Fig. 7 (Multimedia view). Incidentally, 19 droplets pass through the narrow channel. DropTrack constructs nine full trajectories, meaning these full trajectories trace the droplets as they enter the channel until they leave. The trajectories are constructed in parts for other droplets due to erroneous droplet ID switching by the DeepSORT algorithm as the droplets move and deform. In Fig. 7(e), we show only the full trajectories of the center of mass of the successfully tracked droplets that pass through the narrow constriction. The center of mass of a droplet is approximated as the center of its bounding rectangle. Further research is needed to achieve the robust tracking of deformable objects with the DeepSORT before DropTrack can be deployed as a real-time and perfect tracking tool for objects such as droplets, cells, etc.
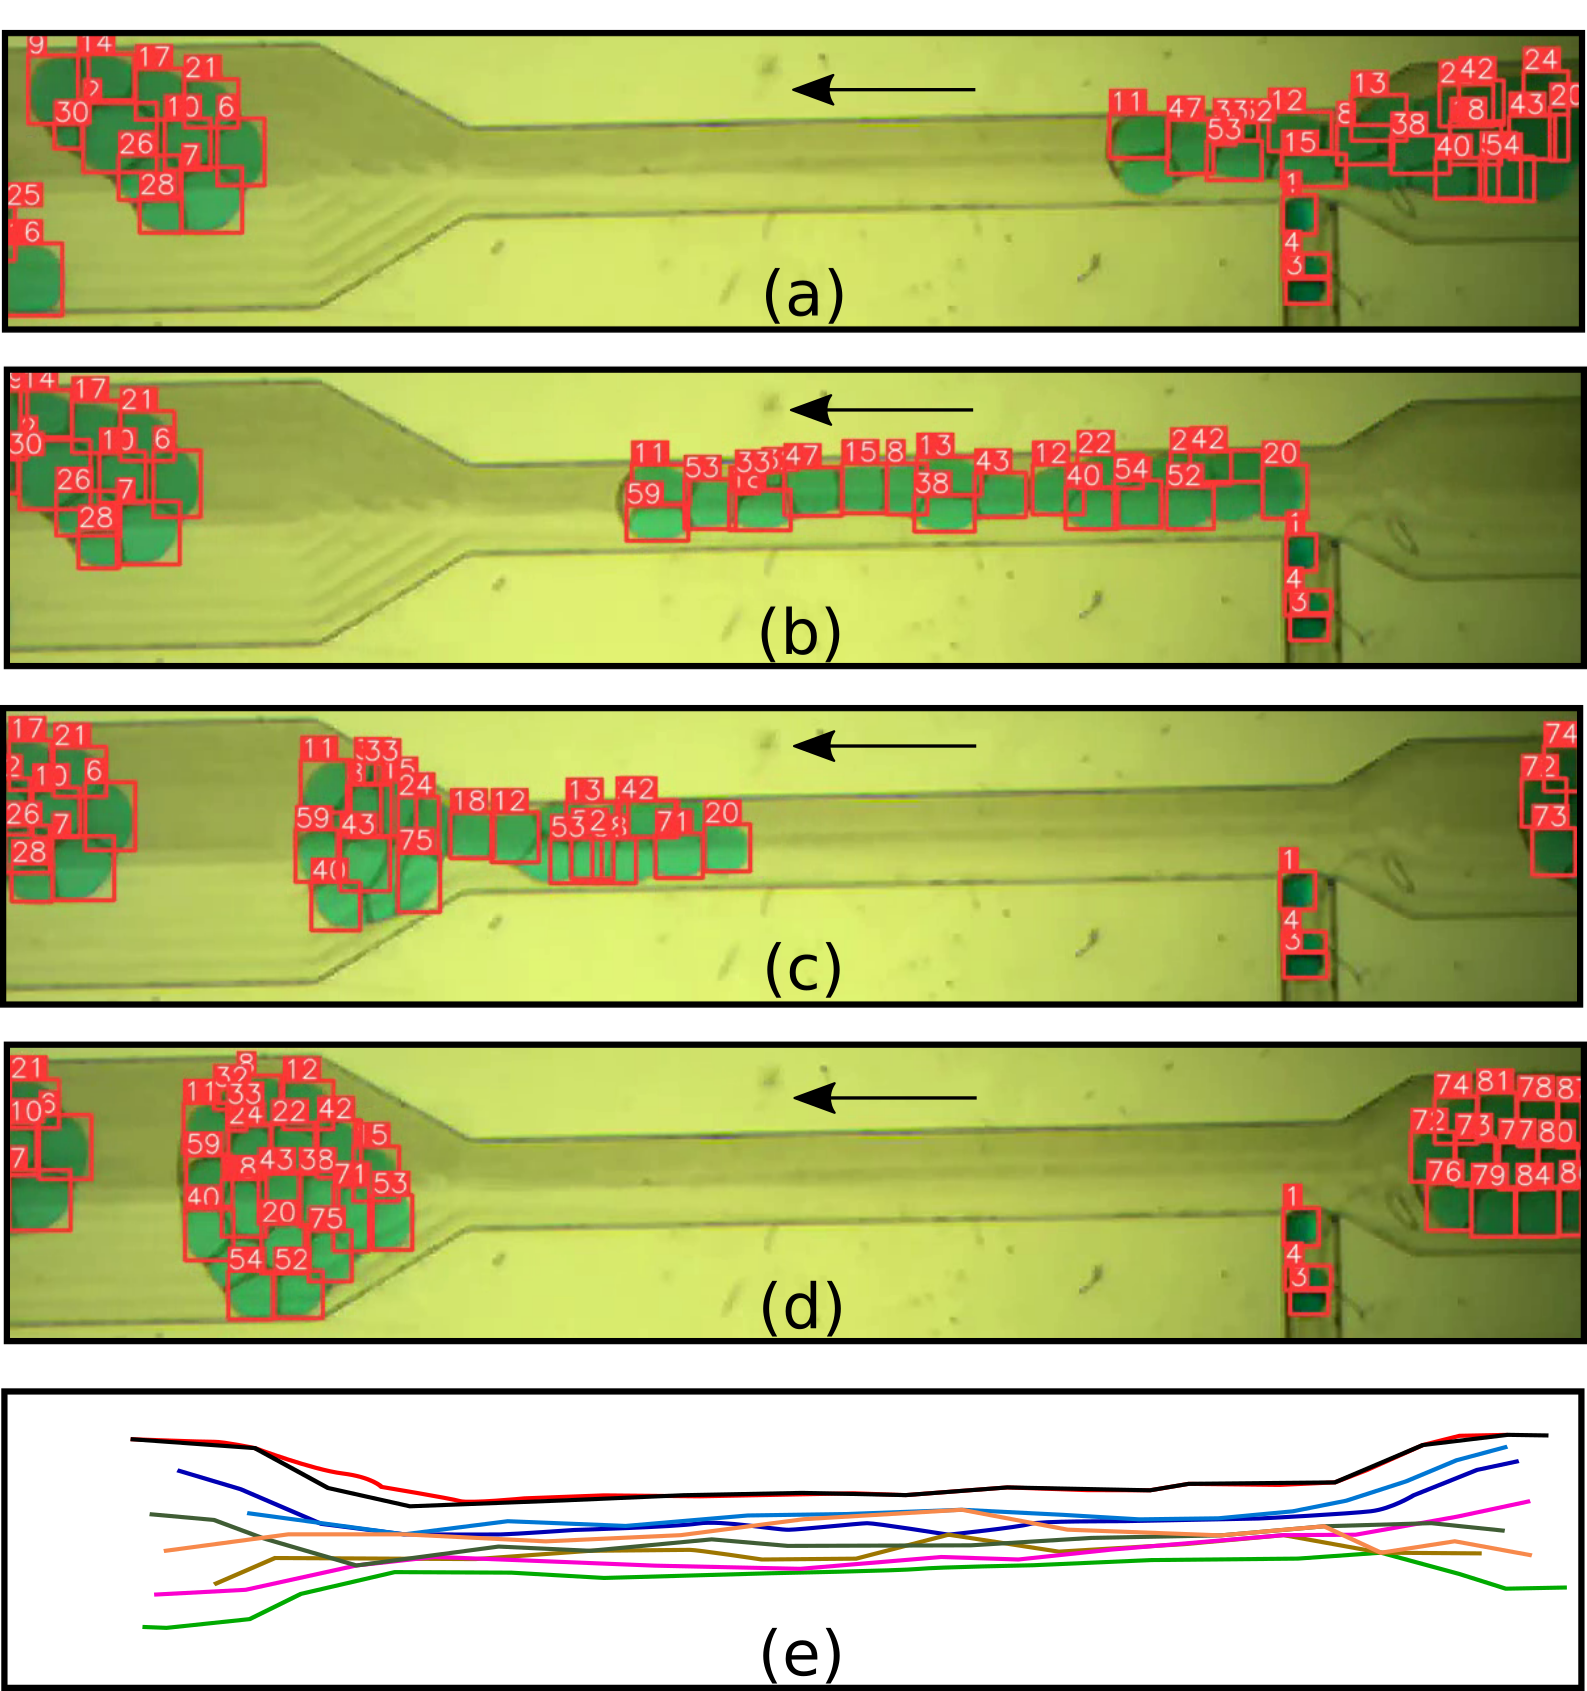
Image analysis speed is crucial for real-time applications, along with detection and tracking accuracy. Table 2 shows the time taken to analyze an input image by the YOLOv5 and the DeepSORT algorithms using an Intel Xeon CPU and NVIDIA V-100 GPU machines. On both the CPU and GPU implementations, the larger YOLOv5 networks take more time to analyze a given input than smaller YOLOv5 networks. On the other hand, the DeepSORT algorithm takes comparable time as the network size is unchanged. Note that the GPU implementation is about 100x faster than the CPU implementation. The GPU image analysis rate (measured in frames per second FPS) is good enough for real-time droplet tracking.
| Network name | YOLO (Xeon CPU) | DeepSORT (Xeon CPU) | Total FPS (CPU) | YOLO (V100-GPU) | DeepSORT (V100-GPU) | Total FPS (GPU) |
| YOLOv5s + DeepSORT | 0.104 s | 7.882 s | 0.13 | 0.007 s | 0.026 s | 30.30 |
| YOLOv5m + DeepSORT | 0.227 s | 8.574 s | 0.11 | 0.009 s | 0.027 s | 27.78 |
| YOLOv5l + DeepSORT | 0.439 s | 8.641 s | 0.11 | 0.010 s | 0.027 s | 27.03 |
| YOLOv5x + DeepSORT | 0.797 s | 8.412 s | 0.11 | 0.013 s | 0.028 s | 24.39 |
| YOLOv5s6 + DeepSORT | 0.309 s | 8.676 s | 0.11 | 0.009 s | 0.029 s | 26.32 |
| YOLOv5m6 + DeepSORT | 0.719 s | 8.159 s | 0.11 | 0.012 s | 0.030 s | 23.81 |
| YOLOv5l6 + DeepSORT | 1.560 s | 8.441 s | 0.11 | 0.014 s | 0.029 s | 23.26 |
| YOLOv5x6 + DeepSORT | 2.660 s | 8.554 s | 0.09 | 0.017 s | 0.030 s | 21.28 |
VI Conclusion
This work combines the YOLOv5 object detector and the DeepSORT object tracker for the automatic detection and tracking of droplets in microfluidic experiments. Several YOLOv5 networks were trained with a mix of synthetic and real images. The synthetic images were generated with computer graphics tools, while the real images were taken from actual microfluidic experiments and were manually annotated. For our test case, the network trained with by combining 60% synthetic data and 40% real data show similar droplet detection performance (in terms of counting the droplets) compared with the network trained only with real data, meanwhile significantly reducing manual image annotation work by a factor two. These results highlight the effectiveness of hybrid datasets in training an object detector network and provide a valuable strategy to save significant resources while developing similar applications to analyze challenging bio/microfluidic experimental data.
Furthermore, this work presents a case study for object detection and tracking in a challenging scenario due to compact and deformable droplet configurations. We report inference speed and a measure for training quality, mean average precision for several YOLOv5 networks. A trained network with 60% training data with relatively low mAP performs similarly to the network with a high mAP value (100% real data) in droplet counting. This observation highlights the need to check for various network training quality measures, which could be tailored to a specific application and hints toward diversifying reliance on a standard measure (mean average precision) used to measure object detector accuracy.
Due to identity switches by the DeepSORT, the present tool could successfully track about half of the droplets that undergo significant deformations and accelerated motions. The trajectories of the remaining droplets were generated as partial segments that could be glued together with heuristic algorithms. Further exciting research direction is to consolidate state-of-the-art algorithms to ensure the best object detection, minimum identity switches, and continuous trajectories of highly deformable objects such as droplets, biological organisms, and cells for complete and real-time tracking.
VII Acknowledgement
The authors acknowledge funding from the European Research Council under the European Union’s Horizon 2020 Framework Programme (No. FP/2014-2020) ERC Grant Agreement No.739964 (COPMAT). J. G. acknowledges support from Foundation for Polish Science within First Team program under Grant No. POIR.04.04.00-00-26C7/16-00. M. B. acknowledges the PMW program of the Minister of Science and Higher Education in the years 2020-2024 No. 5005/H2020-MSCA-COFUND/2019/2. We gratefully acknowledge the HPC infrastructure and the Support Team at Fondazione Istituto Italiano di Tecnologia.
VIII Data availability statement
The data that supports the findings of this study are available within the article and its supplementary material.
IX Author Declarations
The authors have no conflicts to disclose. The following article has been submitted to Physics of Fluids.
References
- Succi and Coveney (2019) S. Succi and P. V. Coveney, “Big data: the end of the scientific method?” Philosophical Transactions of the Royal Society A: Mathematical, Physical and Engineering Sciences 377, 20180145 (2019), https://royalsocietypublishing.org/doi/pdf/10.1098/rsta.2018.0145 .
- Riva, Wiederhold, and Succi (2022) G. Riva, B. K. Wiederhold, and S. Succi, “Zero sales resistance: The dark side of big data and artificial intelligence,” Cyberpsychology, Behavior, and Social Networking 25, 169–173 (2022), pMID: 35294295, https://doi.org/10.1089/cyber.2022.0035 .
- LeCun, Bengio, and Hinton (2015) Y. LeCun, Y. Bengio, and G. Hinton, “Deep learning,” Nature 521, 436–444 (2015).
- Darmatasia and Fanany (2017) Darmatasia and M. I. Fanany, “Handwriting recognition on form document using convolutional neural network and support vector machines (cnn-svm),” 2017 5th International Conference on Information and Communication Technology (ICoIC7) , 1–6 (2017).
- Ahlawat et al. (2020) S. Ahlawat, A. Choudhary, A. Nayyar, S. Singh, and B. Yoon, “Improved handwritten digit recognition using convolutional neural networks (cnn),” Sensors 20 (2020), 10.3390/s20123344.
- Tandel, Prajapati, and Dabhi (2020) N. H. Tandel, H. B. Prajapati, and V. K. Dabhi, “Voice recognition and voice comparison using machine learning techniques: A survey,” 2020 6th International Conference on Advanced Computing and Communication Systems (ICACCS) , 459–465 (2020).
- Han, Yu, and Tashev (2014) K. Han, D. Yu, and I. Tashev, “Speech emotion recognition using deep neural network and extreme learning machine,” in Interspeech 2014 (2014).
- Severyn and Moschitti (2015) A. Severyn and A. Moschitti, “Unitn: Training deep convolutional neural network for twitter sentiment classification,” Proceedings of the 9th International Workshop on Semantic Evaluation (SemEval 2015) , 464–469 (2015).
- Ramadhani and Goo (2017) A. M. Ramadhani and H. S. Goo, “Twitter sentiment analysis using deep learning methods,” 2017 7th International Annual Engineering Seminar (InAES) , 1–4 (2017).
- Zhang, Wang, and Liu (2018) L. Zhang, S. Wang, and B. Liu, “Deep learning for sentiment analysis: A survey,” WIREs Data Mining and Knowledge Discovery 8, e1253 (2018), https://onlinelibrary.wiley.com/doi/pdf/10.1002/widm.1253 .
- Osman et al. (2017) T. Osman, S. S. Psyche, J. M. Shafi Ferdous, and H. U. Zaman, “Intelligent traffic management system for cross section of roads using computer vision,” 2017 IEEE 7th Annual Computing and Communication Workshop and Conference (CCWC) , 1–7 (2017).
- Ho et al. (2019) G. T. S. Ho, Y. P. Tsang, C. H. Wu, W. H. Wong, and K. L. Choy, “A computer vision-based roadside occupation surveillance system for intelligent transport in smart cities,” Sensors 19 (2019), 10.3390/s19081796.
- Yogameena and Nagananthini (2017) B. Yogameena and C. Nagananthini, “Computer vision based crowd disaster avoidance system: A survey,” International Journal of Disaster Risk Reduction 22, 95–129 (2017).
- Ragesh et al. (2019) N. Ragesh, B. Giridhar, D. Lingeshwaran, P. Siddharth, and K. P. Peeyush, “Deep learning based automated billing cart,” 2019 International Conference on Communication and Signal Processing (ICCSP) , 0779–0782 (2019).
- Kühl et al. (2020) N. Kühl, M. Goutier, L. Baier, C. Wolff, and D. Martin, “Human vs. supervised machine learning: Who learns patterns faster?” (2020).
- Senior et al. (2020) A. W. Senior, R. Evans, J. Jumper, J. Kirkpatrick, L. Sifre, T. Green, C. Qin, A. Žídek, A. W. R. Nelson, A. Bridgland, H. Penedones, S. Petersen, K. Simonyan, S. Crossan, P. Kohli, D. T. Jones, D. Silver, K. Kavukcuoglu, and D. Hassabis, “Improved protein structure prediction using potentials from deep learning,” Nature 577, 706–710 (2020).
- Carleo et al. (2019) G. Carleo, I. Cirac, K. Cranmer, L. Daudet, M. Schuld, N. Tishby, L. Vogt-Maranto, and L. Zdeborová, “Machine learning and the physical sciences,” Rev. Mod. Phys. 91, 045002 (2019).
- Yu et al. (2022) L. Yu, B. Liu, Y. Zhu, R.-R. Chen, H.-W. Xi, C.-J. Jin, and B. Peng, “A deep learning framework for Square Kilometre Array Science Data Challenge 1,” Monthly Notices of the Royal Astronomical Society 511, 4305–4315 (2022), https://academic.oup.com/mnras/article-pdf/511/3/4305/42597183/stac281.pdf .
- Coelho et al. (2021) C. N. Coelho, A. Kuusela, S. Li, H. Zhuang, J. Ngadiuba, T. K. Aarrestad, V. Loncar, M. Pierini, A. A. Pol, and S. Summers, “Automatic heterogeneous quantization of deep neural networks for low-latency inference on the edge for particle detectors,” Nature Machine Intelligence 3, 675–686 (2021).
- Thiyagalingam et al. (2022) J. Thiyagalingam, M. Shankar, G. Fox, and T. Hey, “Scientific machine learning benchmarks,” Nature Reviews Physics (2022), 10.1038/s42254-022-00441-7.
- Hadikhani et al. (2019) P. Hadikhani, N. Borhani, S. Hashemi, and D. Psaltis, “Learning from droplet flows in microfluidic channels using deep neural networks,” Scientific Reports 9, 8114 (2019).
- Mahdi and Daoud (2017) Y. Mahdi and K. Daoud, “Microdroplet size prediction in microfluidic systems via artificial neural network modeling for water-in-oil emulsion formulation,” Journal of Dispersion Science and Technology 38, 1501–1508 (2017), https://doi.org/10.1080/01932691.2016.1257391 .
- Khor et al. (2019) J. W. Khor, N. Jean, E. S. Luxenberg, S. Ermon, and S. K. Y. Tang, “Using machine learning to discover shape descriptors for predicting emulsion stability in a microfluidic channel,” Soft Matter 15, 1361–1372 (2019).
- Zhu and Wang (2017) P. Zhu and L. Wang, “Passive and active droplet generation with microfluidics: a review,” Lab Chip 17, 34–75 (2017).
- Zamboni et al. (2021) R. Zamboni, A. Zaltron, M. Chauvet, and C. Sada, “Real-time precise microfluidic droplets label-sequencing combined in a velocity detection sensor,” Scientific Reports 11, 17987 (2021).
- de Novais Schianti et al. (2019) J. de Novais Schianti, A. L.C. Serrano, D. Orquiza de Carvalho, R. A. Penchel, J. Mota Pinheiro, M. R. Gongora-Rubio, and G. Pamplona Rehder, “Novel platform for droplet detection and size measurement using microstrip transmission lines,” Sensors 19 (2019), 10.3390/s19235216.
- Chen et al. (2009) J. Chen, K. Venkataraman, D. Bakin, B. Rodricks, R. Gravelle, P. Rao, and Y. Ni, “Digital camera imaging system simulation,” IEEE Transactions on Electron Devices 56, 2496–2505 (2009).
- Montessori et al. (2021a) A. Montessori, A. Tiribocchi, M. Bogdan, F. Bonaccorso, M. Lauricella, J. Guzowski, and S. Succi, “Translocation dynamics of high-internal phase double emulsions in narrow channels,” Langmuir 37, 9026–9033 (2021a).
- Montessori et al. (2021b) A. Montessori, M. L. Rocca, P. Prestininzi, A. Tiribocchi, and S. Succi, “Deformation and breakup dynamics of droplets within a tapered channel,” Physics of Fluids 33, 082008 (2021b), https://doi.org/10.1063/5.0057501 .
- Tao et al. (2017) J. Tao, H. Wang, X. Zhang, X. Li, and H. Yang, “An object detection system based on yolo in traffic scene,” in 2017 6th International Conference on Computer Science and Network Technology (ICCSNT) (2017) pp. 315–319.
- Lin and Sun (2018) J.-P. Lin and M.-T. Sun, “A yolo-based traffic counting system,” in 2018 Conference on Technologies and Applications of Artificial Intelligence (TAAI) (2018) pp. 82–85.
- Diotallevi et al. (2009) F. Diotallevi, L. Biferale, S. Chibbaro, A. Lamura, G. Pontrelli, M. Sbragaglia, S. Succi, and F. Toschi, “Capillary filling using lattice boltzmann equations: The case of multi-phase flows,” The European Physical Journal Special Topics 166, 111–116 (2009).
- Durve, Mihir et al. (2021) Durve, Mihir, Bonaccorso, Fabio, Montessori, Andrea, Lauricella, Marco, Tiribocchi, Adriano, and Succi, Sauro, “Tracking droplets in soft granular flows with deep learning techniques,” Eur. Phys. J. Plus 136, 864 (2021).
- Durve et al. (2021) M. Durve, F. Bonaccorso, A. Montessori, M. Lauricella, A. Tiribocchi, and S. Succi, “A fast and efficient deep learning procedure for tracking droplet motion in dense microfluidic emulsions,” Philosophical Transactions of the Royal Society A: Mathematical, Physical and Engineering Sciences 379, 20200400 (2021), https://royalsocietypublishing.org/doi/pdf/10.1098/rsta.2020.0400 .
- Bogdan et al. (2022) M. Bogdan, A. Montessori, A. Tiribocchi, F. Bonaccorso, M. Lauricella, L. Jurkiewicz, S. Succi, and J. Guzowski, “Stochastic jetting and dripping in confined soft granular flows,” Phys. Rev. Lett. 128, 128001 (2022).
- (36) “The pascal visual object classes homepage,” http://host.robots.ox.ac.uk/pascal/VOC/.
- (37) “Coco dataset homepage,” http://cocodataset.org.
- Zhou, Zhao, and Nie (2021) F. Zhou, H. Zhao, and Z. Nie, “Safety helmet detection based on yolov5,” in 2021 IEEE International Conference on Power Electronics, Computer Applications (ICPECA) (2021) pp. 6–11.
- Junior and Alfredo C. Ulson (2021) L. C. M. Junior and J. Alfredo C. Ulson, “Real time weed detection using computer vision and deep learning,” in 2021 14th IEEE International Conference on Industry Applications (INDUSCON) (2021) pp. 1131–1137.
- Xu et al. (2021) R. Xu, H. Lin, K. Lu, L. Cao, and Y. Liu, “A forest fire detection system based on ensemble learning,” Forests 12 (2021), 10.3390/f12020217.
- Yao et al. (2021) J. Yao, J. Qi, J. Zhang, H. Shao, J. Yang, and X. Li, “A real-time detection algorithm for kiwifruit defects based on yolov5,” Electronics 10 (2021), 10.3390/electronics10141711.
- Walia et al. (2021) I. S. Walia, D. Kumar, K. Sharma, J. D. Hemanth, and D. E. Popescu, “An integrated approach for monitoring social distancing and face mask detection using stacked resnet-50 and yolov5,” Electronics 10 (2021), 10.3390/electronics10232996.
- Redmon et al. (2016) J. Redmon, S. Divvala, R. Girshick, and A. Farhadi, “You only look once: Unified, real-time object detection,” 2016 IEEE Conference on Computer Vision and Pattern Recognition (CVPR) , 779–788 (2016).
- Redmon and Farhadi (2018) J. Redmon and A. Farhadi, “Yolov3: An incremental improvement,” ArXiv:1804.02767v1 (2018).
- Wojke, Bewley, and Paulus (2017) N. Wojke, A. Bewley, and D. Paulus, “Simple online and realtime tracking with a deep association metric,” 2017 IEEE International Conference on Image Processing (ICIP) , 3645–3649 (2017).
- Bewley et al. (2016) A. Bewley, Z. Ge, L. Ott, F. Ramos, and B. Upcroft, “Simple online and realtime tracking,” in 2016 IEEE International Conference on Image Processing (ICIP) (2016) pp. 3464–3468.
- Kuhn (1955) H. W. Kuhn, “The hungarian method for the assignment problem,” Naval Research Logistics Quarterly 2, 83–97 (1955), https://onlinelibrary.wiley.com/doi/pdf/10.1002/nav.3800020109 .
- Kalman (1960) R. E. Kalman, “A New Approach to Linear Filtering and Prediction Problems,” Journal of Basic Engineering 82, 35–45 (1960), https://asmedigitalcollection.asme.org/fluidsengineering/article-pdf/82/1/35/5518977/35_1.pdf .
- Saleh et al. (2018) F. S. Saleh, M. S. Aliakbarian, M. Salzmann, L. Petersson, and J. M. Alvarez, “Effective use of synthetic data for urban scene semantic segmentation,” in Proceedings of the European Conference on Computer Vision (ECCV) (2018).
- Wood et al. (2021) E. Wood, T. Baltrušaitis, C. Hewitt, S. Dziadzio, T. J. Cashman, and J. Shotton, “Fake it till you make it: Face analysis in the wild using synthetic data alone,” in Proceedings of the IEEE/CVF International Conference on Computer Vision (ICCV) (2021) pp. 3681–3691.
- (51) “Roboflow homepage,” https://roboflow.com/.
- Choiński et al. (2021) M. Choiński, M. Rogowski, P. Tynecki, D. P. J. Kuijper, M. Churski, and J. W. Bubnicki, “A first step towards automated species recognition from camera trap images of mammals using ai in a european temperate forest,” in Computer Information Systems and Industrial Management, edited by K. Saeed and J. Dvorský (Springer International Publishing, Cham, 2021) pp. 299–310.
- Henderson and Ferrari (2017) P. Henderson and V. Ferrari, “End-to-end training of object class detectors for mean average precision,” in Computer Vision – ACCV 2016 (Springer International Publishing, Cham, 2017) pp. 198–213.
- Rezatofighi et al. (2019) H. Rezatofighi, N. Tsoi, J. Gwak, A. Sadeghian, I. Reid, and S. Savarese, “Generalized intersection over union: A metric and a loss for bounding box regression,” in Proceedings of the IEEE/CVF Conference on Computer Vision and Pattern Recognition (CVPR) (2019).
- (55) “Yolov5 git repository,” https://github.com/ultralytics/yolov5.
- (56) “epochs = 500, batch size = 32, number of classes = 1, learning rate = 0.001, momentum = 0.95, decay = 0.001.” .
- Broström (2020) M. Broström, “Real-time multi-object tracker using yolov5 and deep sort,” https://github.com/mikel-brostrom/Yolov5_DeepSort_Pytorch (2020).