Original Russian Text @ F.G. Kopylova, A.I. Kopylov,
published in Astrofizicheskii Byulleten, 2022,
Vol.77, No.1, pp.24-33
Galaxy cluster A2142: halo boundary, „red sequence“, properties of galaxies according to SDSS
Abstract
The paper presents the results of studying the dynamics of galaxies, properties of early-type galaxies, properties of galaxies with the quenched star formation (QGs) in the A 2142 based on the archival data from the Sloan Digital Sky Survey. We found the observed halo boundary, the splachback radius , which is equal to 4.12 Mpc () and and 4.06 Mpc () over the integral distribution of the number of galaxies as a function of the squared distance from the center. We have studied how early-type galaxies are distributed in the center and in the outskirts of the cluster (<3, ) and plotted the red sequence in the form of . Among all the cluster galaxies, the galaxies with the quenched star formation ( yr yr-1) make up about one third. We have found that the fraction of QGs beyond the splashback is the same as in the field at the same with coordinates of the center of , and a size of . For galaxies with the stellar masses (this is the main mass range of QGs), after entering the cluster, there is a decrease in the radii by about when moving towards the center.
Keywords: galaxies: clusters: individual: A 2142 — galaxies: star formation - galaxies: evolution
1 INTRODUCTION
Galaxy clusters, the largest gravitationally bound systems in the Universe, are the main objects of the observational cosmology Vikhlinin allowing one to study the hierarchical growth of structures. For such studies, one of the best targets in the local the Universe () is the cluster A 2142 with the highest luminosity in the X-ray and with a large number of galaxy groups in its outskirts, which it gravitates. When observing the cluster in the X-ray (Chandra, XMM-Newton), multiple concentric cold fronts of surface brightness Markevitch0 ; Rossetti were found indicating the sloshing activity of the core Tittley ; Markevitch1 stretching up to 1 Mpc from the center of the cluster Rossetti . A two-component radio halo Venturi was detected in the radio range (observations with LOFAR and VLA). Eckert et al. (2014) also found evidence of accretion of gas and galaxies onto the cluster: the galaxy group was discovered at a distance of 1.5 Mpc northeast of the main system.
The central region of the A2142 has been studied in the optical range. Owers et al. (2011) identified several subclusters falling on it in the distribution of galaxies near the cluster (up to 2 Mpc). Einasto et al.(2020) have shown that the cluster A2142 is the result of past and present galaxy mergers. Liu et al. (2018) found 19 subclusters within 3.5 Mpc and studied multiple mergers of smaller subsystems with the main cluster, which influenced its complex dynamics. In addition, in the indicated paper, the gas rings were found near two cold fronts seen in the X-ray region. The velocities of the rings exceed the average radial velocity of the cluster by and km s-1. Liu et al.(2018) explained these features of the gas in terms of a core sloshing activity model.
The objectives of this paper are to determine the boundary of the A 2142 and the characteristics of its constituent galaxies: the fraction of early-type galaxies in the red sequence and galaxies with the quenched star formation along the normalized radius, as well as to reveal changes in the radius of the galaxies along the radius of the cluster.
We carried out the study using the data from the SDSS catalog (Sloan Digital Sky Survey Data Release 7 Abazajian , 10 Aihara ), and NED (NASA Extragalactic Database). The paper is organized as follows. Section 2 describes the procedure of measuring the dynamical characteristics of the galaxy cluster and determining its surroundings. Section 3.1 presents the plotted color-magnitude relation of early-type galaxies, estimates of the fraction of early-type galaxies along the radius and their characteristics at a fixed stellar mass, and compares this fraction with the values obtained for field objects. In Section 3.2, the specific star formation rate of galaxies is considered; galaxies with the quenched star formation (QGs) are found. The fraction of QGs along the radius is determined at a fixed stellar mass of galaxies, their characteristics are given, and a comparison is made with the specific star-formation rate in the field. Section 4 lists the main results. In the paper, we used the following cosmological parameters: , and km s-1 Mpc-1.
2 DYNAMICAL CHARACTERISTICS
The completeness of the galaxy cluster under study is determined by the completeness of the spectroscopic data of the SDSS catalog. Strauss et al. (2002) applied the following conditions when selecting the galaxies (the Main galaxy sample): and , where is the Petrosian magnitude of the galaxy in the filter corrected for extinction in the Galaxy, and is the Petrosian average surface brightness corresponding to the effective radius. Under these conditions, the completeness of the SDSS galaxies was and for bright galaxies .
Usually, when studying galaxy clusters, to increase the spectral completeness of bright galaxies in the absence of the SDSS measurements of their radial velocities, we added the data from the NED database. If there were no such measurements in the NED, we selected early-type bright red sequence galaxies as probable cluster members (from one to five galaxies) using the color-magnitude diagrams (; ; and ) Kopylova18 ; Kopylova19 .
Determination of the dynamical characteristics of the system of galaxies: the radial velocity, the dispersion of the radial velocities and mass is performed for a region of the radius . The radius (hereinafter ) is the empirical radius, within which the density in the system 200 times exceeds the critical density of the Universe and can be estimated by the formula: Mpc Carlberg . Then, assuming that the cluster is virialized within this radius, , we find the mass . That is, the mass of the cluster measured by us . The mass enclosed in a region of the radius can be determined directly from the critical density which depends on :
In model calculations, the radius is often used; this is the radius, within which the density in the system 200 times exceeds the average density of the Universe. We present the main cluster parameters for the region with the radius (according to the SDSS DR7 data): the radial velocity dispersion of galaxies, the radii (, , and ), the heliocentric redshift, the dynamical mass, and the X-ray luminosity in the paper by Kopylova and Kopylov (2015) with the corresponding references and in the columns of Table 1. Our estimates of and for the cluster are in good agreement with the data from the paper by Tchernin which collects the results of determining these parameters by the methods different from ours.
The structure and kinematics of A 2142, as well as its immediate surroundings, can be characterized in more detail using the panels of Fig. 1: (a) the deviation of the radial velocities of galaxies– the cluster members and background galaxies– from the average radial velocity depending on the square of the distance from the cluster center; (b) the location of galaxies in the sky plane in equatorial coordinates; (c) the integral distribution of the number of galaxies depending on the square of the distance from the center; (d) the histogram of the distribution of radial velocities of all the galaxies within the radius . Note (see Fig. 1a) that the cluster is located along the line of sight, except for a group of galaxies with km s1 at the bottom of the panel. Figure 1b shows the cluster profile in the projection (the integral distribution of the number of galaxies depending on the squared radius from the center). It shows that the cluster first has a steep increase in the number of galaxies, and then the number of galaxies located outside the virialized region grows linearly (the straight line in the figure). In our paper Kopylov , a cluster halo-bounding radius was defined, which we later identified with the splashback radius. On closer examination, it turned out that for massive galaxy clusters of the A 1656 and A 2142 types, it is necessary to use - radii to find the distribution point for the linear section. In the cluster A 2142, the radius Mpc (), or . From brighter galaxies with ), we found Mpc. According to the results of the paper (see Kopylova22 , Fig. 5), the following relationship holds for the A 2142 cluster:
The dotted line in Fig. 1 shows the radius of the virialized region , the dashed line is the radius of the central region , the dash-dotted line corresponds to the splashback radius and is followed by a steep rise of the number of cluster members replaced by a linear one. Figure 1 below also shows the distribution of bright early-type galaxies (at these , we estimated the limit for A 2142 approximately equal to from which this radius is refined). The observed radius (usually ) is the radius of the apocenter of the first orbits of galaxies, to which galaxies fly out of the virialized region after the first passage through the cluster center. That is, the radius separates most galaxies that fall into the cluster for the first time from the collapsing galaxies that are already participating in the virial equilibration. The paper by Haines (Fig. 13) shows the positions of galaxies of all kinds, including those that have escaped from the cluster, in the phase space diagram obtained from model simulations of galaxy clusters.
We measured the radii for a sample of 157 galaxy clusters. They vary in the range from 1.02 to 3.64 depending on the dynamical mass and X-ray luminosity Kopylova22 and on average are equal to 1.54.
3 SAMPLES OF GALAXIES AND THEIR PROPERTIES
3.1 Early-type galaxies
It is known that the main population of galaxy clusters at low redshifts () are early-type galaxies which are located mainly in the central virialized regions and are the brightest members. Early-type galaxies follow the color-magnitude relationship called the red sequence (RS). In groups and clusters of galaxies, the RS has a small scatter, since the galaxies are at the same distance. We have found that such galaxies in the virialized regions of galaxy clusters (for example, in the Hercules and Leo superclusters of galaxies) are of the order of - among galaxies brighter than Kopylova3 . Early-type galaxies in this paper are selected according to the following criteria (the -filter): 1) , where the parameter (according to the SDSS catalog) characterizes the contribution of the bulge to the galaxy surface-brightness profile; 2) the concentration index , where (is equal to the ratio of the radii limiting 90 and of the Petrosian fluxes). In addition, we made the color restrictions to exclude spiral galaxies: which follows from the dependence between the color and the absolute magnitude
with . One can also make the color restrictions to narrow the RS: . We took the colors of the galaxies from the SDSS catalog calculated from model magnitudes corrected for the extinction in the Galaxy.
The RS obtained for the A 2142 cluster is shown in Fig. 2a against the background of other galaxies. Figure 2b shows the phase space diagram of the A 2142 in the projection, where is the ratio of the radial velocity difference of galaxies and the average radial velocity of the cluster to the dispersion of radial velocities, is the distance of the galaxy from the selected cluster center normalized to the radius . We took the brightest galaxy as the center of the system of galaxies, whose coordinates were close to the coordinates of the X-ray center. The solid circles show the RS galaxies within a radius of (Fig. 2a and Fig. 2b), the open circles mark the rest of the galaxies. The dashed model line Barsanti ; Oman ) roughly limits the virialized members of the cluster. We took the galaxies with as the cluster members beyond the radius , therefore, the falling group galaxies (Fig. 1) with about km s-1 is not shown in the phase diagram.
Some characteristics of early-type galaxies and estimates of their fraction along the cluster radius are given in Table 2. The first line contains the results for the sample of galaxies on the RS, restricted by the color , as in the papers by Kopylova18 ; Kopylova19 (for 40 clusters of galaxies with . The second line gives the results without the restriction. In total, we found 214 early-type galaxies on the RS in the cluster A 2142 (). If we introduce the color restrictions, we get 189 galaxies. It can be noted that the fractions of early-type galaxies on the RS vary along the radius of the A 2142 cluster in the same way as, on average, for nearby galaxy clusters Kopylova19 . In order to compare the results obtained for the very rich cluster A 2142 and the results obtained for low-density regions near the cluster, we took a field of a size of at the same redshifts () with the center coordinates (, ). With the same selection of early-type galaxies (and taking into account the same condition < - as for the cluster, we found that the fraction of early-type galaxies in the field is . This is consistent with the values given by Table 2 for the region beyond or within 2-3 . This table also gives the average characteristics of early-type galaxies for the main range of stellar masses . It can be noted that the age of galaxies (in the SDSS DR10, it is defined as the mass-weighted average age of the stellar population in Gyr) slightly decreases, the average effective radius increases by 10%, the average metallicity () of the stellar population changes slightly outside the cluster radius . It can also be noted that early-type galaxies in the center of the cluster are redder, their effective radius is smaller, they are older and richer in metals than galaxies within a radius of -. The characteristics of galaxies outside the radius differ from the values given for the field. The galaxies in the field are slightly older, richer in metals, and have a smaller radius . The RS plotted from 214 galaxies is described by the expression
with . Within error, the shape and zero-point practically do not change with the radius of the cluster.
3.2 Galaxies with the quenched star formation
The so-called „Main Sequence“ relates the star formation rate of spiral galaxies to the stellar mass. As a result of the depletion of gas in galaxies, the star-formation rate falls, and the galaxy moves towards a passive state passing through an intermediate state characterized by the quenched star formation. Within clusters of galaxies, there are different mechanisms that lead to the quenching of star formation. In the central regions, these are tidal effects, as a result of which galaxies are deprived of gas, stars, and dark matter (e.g., Mayer ). Some galaxies lose matter, when they are in small groups of galaxies, even before they get into the cluster; that is, they experience pre-processing (e.g., Poggianti ; Wetzel ; Haines1 ).
In Fig. 1b, one can see that the rich cluster A 2142 is surrounded by many groups of galaxies, in which, most likely, pre-processing of galaxies takes place. Earlier, in the paper by Kopylova19 , for 40 nearby clusters of galaxies (), we found that even within the radius (in the outskirts of the considered clusters) the fraction of the galaxies with the quenched star formation is by 27% larger than that in the field.
The specific star formation rate in the galaxy is defined as the integral star formation rate divided by its stellar mass, . The SDSS DR10 catalog contains the results of determining the specific star formation rate, the stellar mass of galaxies, and other parameters galaxies, which have been obtained by fitting the FSPS Conroy models to the SDSS photometry in the , , , , and filters. We used the model values corrected for extinction and the „early-star formation with dust“ version. In the distribution of galaxies according to the specific star formation rate, , a minimum is usually found that separates galaxies with active star formation (active galaxies) from galaxies, in which it is quenched (quenched galaxies–QGs) Wetzel1 . In general, the distribution of galaxies in terms of the specific star formation rate has a long tail extending into the region of galaxies without star formation (passive galaxies). In our papers Kopylova18 ; Kopylova19 , we selected QGs and passive galaxies based on the condition yr-1. If we exclude galaxies without star formation from the sample ( yr-1 according to Oemler et al. (2017), there will remain galaxies with the quenched star formation, i.e., those satisfying the condition yr10.75 yr-1.
In the studied cluster A 2142 (), we found 188 galaxies with the quenched star formation, 147 of which are early-type galaxies with the parameter , the remaining 41 are late-type galaxies. Out of 188 galaxies, 120 have the stellar masses within , 61 galaxies have , and seven more are not included in this range; that is, the galaxies we study are massive ().
Figure 2c shows (with the solid circles) QGs against the background of other galaxies. The first line of Table 3 shows the total fractions of QGs and passive galaxies (similar to those given in the paper by Kopylova19 , the second line shows only the fractions of QGs along the radius of the A 2142 cluster. It can be noted that the fraction of QGs (including passive ones) is maximum in the central region, somewhat smaller within , and drops by about 35% beyond . Beyond the splashback radius, we have the same number of QGs as in the field (285 galaxies out of 491, ). At the same time, the fraction of QGs without passive galaxies (the second line of Table 3) is minimum in the center, maximum within the radius, and decreases beyond the radius by 28% compared to those in the virialized region of galaxy clusters (0-1). We have found that the number of such galaxies in the field is approximately the same: , 151 galaxies out of 491 ().
Among QGs, the fraction of late-type galaxies identified by the parameter is insignificant and amounts to 22%. In the center of the cluster, we found only three. Table 4 shows some properties of late- and early-type QGs in the cluster and in the field at the fixed stellar mass [10.5; 11.0]: the stellar population age, metallicity, color , concentration index , and bulge fraction. The last column of the table shows the parameters of the field galaxies (for late-type galaxies and early-type galaxies). It can be noted that the late-type galaxies falling into the cluster (within ), become redder, more compact, and similar to early-type galaxies: the concentration index increases from 2.39 beyond to 2.56, the fraction of the bulge increases significantly from 0.36 to 0.56 (or by 36%). For early-type galaxies, no significant changes in the parameters are observed. If we compare these parameters of QGs (for the same range of stellar masses) with those from a lower density region (of the field), we can draw the following conclusion. In the cluster region (), late-type QGs have a larger bulge, a redder color, and significantly lower metallicity compared to the field galaxies.
In the paper Kopylova20 , we considered the variations in the stacked Petrosian radius of galaxies in 40 nearby () galaxy clusters. For the mass range
it turned out that the radius of late-type galaxies, when moving inside clusters, decreases by about , and for early-type galaxies–by . In this paper, we also studied the change in the average Petrosian radius of the galaxies from the A 2142 cluster along its radius for the same range of stellar masses.
Figure 3 shows the change in the average radius of the galaxies with the quenched star formation, the members of the cluster A 2142, along the normalized radius . The solid line corresponds to the late-type galaxies (), the dashed line corresponds to the early-type galaxies (). The same horizontal lines show the values for field galaxies. We can draw the following conclusions. There are few QGs in the central region of A 2142, but they do exist. Perhaps, this is the result of a projection of galaxies that do not belong to the cluster. For the galaxies of late and early types that fall into the virialized region of the cluster (), the radii gradually decrease towards the center by approximately 30%. Moreover, one can notice (Fig. 3) that the early-type galaxies have the maximum radius near the splashback radius, this is not observed for the late-type galaxies. Thus, in the rich cluster A 2142, all the galaxies with the quenched star formation with the mass [10.5;11.0] show significant decreases of the radii.
Since the cluster A 2142 is very massive and many groups of galaxies and individual galaxies fall on it even near a radius of 3.5 (which can be seen in Fig. 1), the QGs have radii of somewhat smaller than those in the field, although, within error. Also, we do not detect the effect we found in the paper Kopylova20 for nearby clusters of galaxies, when the stacked radii of the late-type galaxies are maximum near the average stacked splashback radius of clusters. Apparently, the reason is that in A 2142 we deal only with massive galaxies (); while in the paper by Kopylova and Kopylov (2020), we studied mostly fainter and less massive galaxies with in nearby clusters. They are 1.5 times greater in number than massive galaxies. That is, the effect we found (although this was not emphasized in the paper by Kopylova20 ) appears mainly in smaller galaxies, since they are easier to destroy in the field of galaxy clusters. It is known that clustering of galaxies and gas occurs near the radius Adhikari which results in acceleration of the rate of galaxy changes.
Galaxy clusters can be considered as laboratories, where transformations of galaxies take place. In the papers Poggianti1 ; Cebrian it is shown that early-type galaxies in clusters are smaller than those in the field. Matharu et al.(2019), for example, found that the increase in the size of passive and star-forming galaxies (1) in the field compared to those in clusters can be explained by the collision and merging of galaxies. Hamabata et al. (2019) found the radius of the cluster ( is about Mpc, where = 0.7), within which the transformations of spiral galaxies are most effective. The paper by Pranger shows how the environment affects spiral galaxies. For a sample, of 700 galaxies (, the SDSS data), it was found that sizes of spiral galaxies, in terms of the radius as a parameter, are by 15% smaller in clusters than those in the field, and the parameter is by 15% smaller. Also, the color of galaxies are redder in clusters.
4 CONCLUSION AND FINDINGS
According to the SDSS data, for the galaxy cluster A 2142 which is the brightest in the X-ray of the local Universe, we have considered the changes: (a) the fraction of early-type galaxies along the radius (in the projection); (b) the fraction of galaxies with the quenched star formation within the nearest outskirts (up to ) in comparison with the data for the field. The paper by Kopylova20 showed the changes in the fraction of QGs depending on the stellar mass of galaxies. Massive early-type galaxies tend to be located in the center of the galaxy cluster. The QGs sample that we compiled has stellar masses in the range of (64% of them are in the range of ), that is, these are massive and bright galaxies. We present some properties of these galaxies obtained in that paper.
The key results of this study are the following:
1. From the observed cluster profile–the integral distribution of the number of galaxies depending on the square of the distance from the center–we have found the splashback radius which coincides with the apocenters of the orbits of most galaxies that have already visited the center of the system. The radius of the cluster A 2142 is Mpc, for the critical density, or for the average density of the Universe.
2. The shape of the color-magnitude (the red sequence, RS) dependence does not change within the considered cluster radius ranges (Table 1). We have obtained the RS as
The coefficients of the form and zero-point are given for the region with the radius and beyond it (in parentheses). The fraction of early-type galaxies outside is equal to the value for the low-density region, for which the field with the coordinates , and the radius at the same is taken. The early-type galaxies in the center of the cluster are redder, have a smaller effective radius , are older, and metal-richer than those outside the virial radius, 1–2 (Table 1).
3. The fraction of galaxies with the quenched star formation ( yr yr-1) decreases by 28% beyond the radius compared to the radius and becomes the same as in the field. Among the QGs, only 22% are late-type galaxies. We have found that in such galaxies both the concentration index and the fraction of the bulge increase towards the center of the cluster, i.e., they become similar to early-type galaxies.
4. It is found that the properties of galaxies with the quenched star formation with the stellar mass [10.5;11.0], when falling into the rich massive cluster A 2142, change greatly. The radii of the galaxies of late and early types decrease by about 30% in the center of the cluster compared to the radii near the boundary of the cluster halo.
Acknowledgements.
This research has made use of the NASA/IPAC Extragalactic Database (NED, http://nedwww..ipac.caltech.edu), which is operated by the Jet Propulsion Laboratory, California Institute of Technology, under contract with the National Aeronautics and Space Administration, Sloan Digital Sky Survey (SDSS, http://www.sdss.org), which is supported by Alfred P. Sloan Foundation, the participant institutes of the SDSS collaboration, National Science Foundation, and the United States Department of Energy and Two Micron All Sky Survey (2MASS, http://www.ipac..caltech.edu/2mass/releases/allsky/).CONFLICT OF INTEREST
The authors declare no conflict of interest regarding this paper.
References
References
- (1) A.A. Vikhlinin, A.V. Kravtsov, M.L. Markevitch et al., Phisics-Uspekhi 57, 4 (2014).
- (2) M. Markevitch, T.J. Ponman, P.E.J. Nulsen et al., Astrophys. J. 541, 542 (2000).
- (3) M. Rossetti, D. Eckert, S. De Grandi et al., Astronom. and Astrophys.556, A4 (2013).
- (4) E.R. Tittley, & M. Henriksen, Astrophys. J. 618, 227 (2005).
- (5) M. Markevitch, & A. Vikhlinin, Phys. Rep. 441, 1 (2007).
- (6) T. Venturi, M. Rossetti, G. Brunetti et al., Astronom. and Astrophys.603, A125 (2017).
- (7) D. Eckert, S. Molendi, M. Owers, et al., Astronom. and Astrophys.570, A119 (2014).
- (8) M.S. Owers, P.E.J. Nulsen, & W.J. Couch, Astrophys. J. 741, 122 (2011).
- (9) M. Einasto, B. Deshev, H. Lietzen et al., Astronom. and Astrophys.641, A172 (2020).
- (10) A. Liu, H. Yu, A. Diaferio et al., Astrophys. J. 863, 102 (2018).
- (11) K.N. Abazajian, J.K. Adelman-McCarthy, M.A. Aqü eros et al., Astrophys. J. Suppl.182, 543 (2009).
- (12) H. Aihara, C. Allende Prieto, D. An et al., Astrophys. J. Suppl.193, 29 (2011).
- (13) M.A. Strauss, D.H. Weinberg, R.H. Lupton et al., Astronom. J.124, 1810 (2002).
- (14) F.G. Kopylova, A.I. Kopylov, Asrophys. Bull. 73, 267 (2018).
- (15) F.G. Kopylova, A.I. Kopylov, Asrophys. Bull. 74, 365 (2019).
- (16) R.G. Carlberg, H.K.C. Yee, E. Ellingson et al., Astrophys. J. 478, 462 (1997).
- (17) F.G. Kopylova, A.I.Kopylov, Asrophys. Bull. 71, 257 (2016).
- (18) C. Tchernin, D. Eckert, S. Ettori et al., Astronom. and Astrophys.595, A42 (2016).
- (19) A.I. Kopylov, F.G. Kopylova, Asrophys. Bull. 70, 243 (2015).
- (20) F.G. Kopylova, A.I. Kopylov, Asrophys. Bull. submitted.
- (21) C.P. Haines, M.J. Pereira, G.P. Smith, et al., Astrophys. J. 775, 126 (2015).
- (22) F.G. Kopylova, Asrophys. Bull. 39, 1 (2013).
- (23) S. Barsanti, M.S. Owers, S. Brough et al., Astrophys. J. 857, 72 (2018).
- (24) K.A. Oman, M.J. Hudson, P.S. Behroozi, Monthly Notices Roy. Astronom. Soc.431, 2307 (2013).
- (25) L. Mayer, C. Mastropietro, J. Wadsley, et al., Monthly Notices Roy. Astronom. Soc.369, 1021 (2006).
- (26) B.M. Poggianti, I. Smail, A. Dressler, et al., Astrophys. J. 518, 576 (1999).
- (27) A.R. Wetzel, J.L. Tinker, C. Conroy, & F.C. van den Bosch, Monthly Notices Roy. Astronom. Soc.432, 336 (2013).
- (28) C. Haines, A. Finoguenov, G. Smith, et al., Monthly Notices Roy. Astronom. Soc.477, 4931 (2018).
- (29) C. Conroy, J.E. Gunn, M. White, Astrophys. J. 699, 486 (2009).
- (30) A.R. Wetzel, J.L. Tinker and C. Conroy, Monthly Notices Roy. Astronom. Soc.424, 232 (2012).
- (31) A.Jr. Oemler, A. Dressler, M.G. Gladders et al., Astrophys. J. 844, 45 (2017).
- (32) F.G. Kopylova, A.I. Kopylov, Asrophys. Bull. 74, 365 (2020).
- (33) B. M. Poggianti, R. Calvi, D. Bindoni et al., in the proceedings of the IAU, IAU Symposium, V. 295, 151 (2013).
- (34) M. Cebrián, I. Trujillo, Monthly Notices Roy. Astronom. Soc.444, 682 (2014).
- (35) S. Adhikari, N. Dalal, R. T. Chamberlain, JCAP 11, 19 (2014).
- (36) J. Matharu, A. Muzzin, G. B. Brammer et al., Monthly Notices Roy. Astronom. Soc.484, 595 (2019).
- (37) A. Hamabata, T. Oogi, M. Oguri et al., Monthly Notices Roy. Astronom. Soc.488, 4117 (2019).
- (38) F. Pranger, I. Trujillo, L.S. Kelvin, M. Cebrián Monthly Notices Roy. Astronom. Soc.467, 2127 (2017).
0mm \onelinecaptionstrue\captionstyleflushleft Cluster km Mpc Mpc Mpc erg (1) (2) (3) (4) (5) (6) (7) (8) (9) A 2142 1.52 2.28 4.12 191 0.090135 10.58
0mm \onelinecaptionstrue\captionstyleflushleft properties 0–0.25 0–1 1–2 2–3 0–1 1–3 field (1) (2) (3) (4) (5) (6) (7) (8) ) ) , kpc
0mm \onelinecaptionstrue\captionstyleflushleft fraction 0–0.25 0–1 1–2 2–3 0–1 1–3 field (1) (2) (3) (4) (5) (6) (7) (8)
0mm \onelinecaptionstrue\captionstyleflushleft properties 0–0.25 0–1 1–2 2–3 0–1 1–3 field (1) (2) (3) (4) (5) (6) (7) (8) () ()
0mm
\onelinecaptionsfalse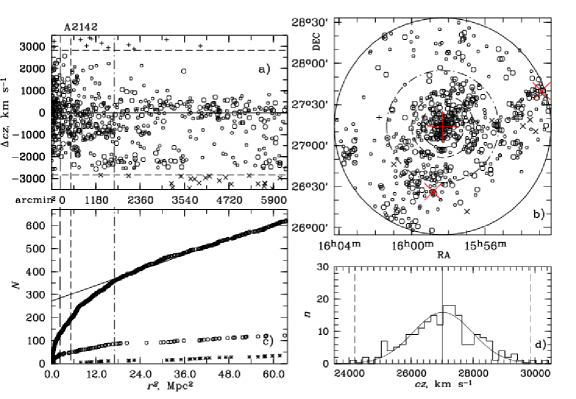 \captionstylenormal
5mm
\onelinecaptionsfalse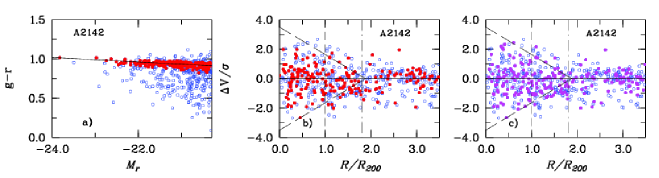 \captionstylenormal
5mm
\onelinecaptionsfalse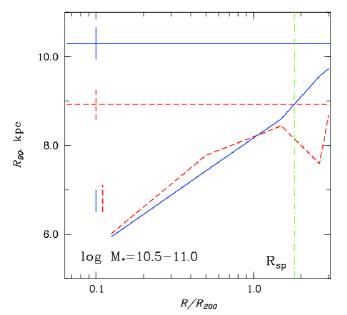 \captionstylenormal