Measurement of absolute radius, refractive index and dispersion of a long cylinder
Abstract
Long cylinders, such as optical fibers, are some of the most widely used photonic devices. The radius and refractive index of these fibers are therefore fundamentally important parameters in determining their performance. We have developed a method to determine the absolute radius, refractive index, and chromatic dispersion of a long cylinder using only the resonance wavelengths of the whispering gallery modes around its circumference for two different polarizations. Since this method only requires the measurement of resonance wavelengths, it is non-destructive and it can be performed using standard equipment. As a proof-of-concept, we demonstrate the method on a optical fiber and an borosilicate capillary fiber with thick walls, obtaining values for the diameter and the refractive index with an accuracy of and , respectively.
1 Introduction
Optical fibers are one of the pillars of modern photonics technology[1]. The accurate determination of the diameter, dispersion, and refractive index of an optical fiber is important for applications such as fiber-based sensors[2], and controlling the propagation of light for telecommunications[3]. As optical fibers have a circular cross-section, they can sustain whispering gallery modes (WGMs). In a WGM, light continuously undergoes total internal reflection on the surface of a circular transparent material surrounded by a one with a lower refractive index. Due to the low loss of typically used transparent materials, and the very smooth surfaces that can be obtained, these modes are capable of reaching ultrahigh Q factors greater that [4]. The achievable ultrahigh quality factors have made whispering gallery resonators (WGRs) excellent candidates for sensing [5, 6, 7, 8, 9, 10, 11]and for observing non-linear effects [12, 13, 14, 15, 12].
When characterizing optical fibers and WGRs, the refractive index is crucial in determining their optical behavior. There are already precise methods used to measure the refractive index like refractive near-field scanning[16] but, they require a dedicated setup and are generally destructive. The refractive index of a material can also be calculated using an empirical formulation like the Sellmeier equation[17], but given the plethora of glasses and dopants used by manufacturers (whose composition is generally treated as a trade secret) it may not be possible to find an appropriate formula. It has also been shown that by finding changes of the resonance wavelengths of WGMs, it is possible to determine variations of the effective radius of an optical fiber with high precision (the effective radius is defined as the product between the fiber radius and its refractive index)[18, 19]. Shortly after, it has also been shown that WGM can be used to determine the size and refractive index of a microspheres[20] by precisely matching the modes to theoretical values. In this work, we reach a similar goal for a long cylinder using a method that is significantly simpler both in determining the mode numbers and minimizing the error. We determine all the mode numbers, radius, refractive index, and chromatic dispersion of a long cylinder by only using data from its mode spectra for two orthogonal polarizations and the assumption that the WGR has insignificant deviations from a circular cross-section.
We start by describing the experimental setup, followed by methods to calculate values for the radial and azimuthal mode numbers given the polarization and approximate values for the radius and the refractive index. From this initial mode identification, we then vary parameters such that the radius measured from each mode gives the same result. As an example, we demonstrate the method on two fibers of different sizes and materials.
2 Experimental setup
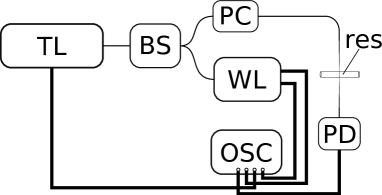
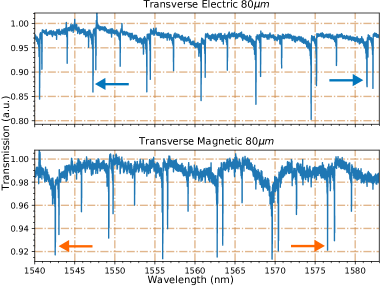
The experimental setup used to collect the WGM spectrum is show in Fig. 1. A tunable laser scans over a range of wavelengths, sending a small portion of the light to a wavelength locker for wavelength measurement. Most of the light is sent to the fiber under test, where it couples in and out of the WGR via a tapered optical fiber, fabricated using the flame brush technique[21]. The transmission, after interacting with the WGR, is sent to a photodiode, and collected in an oscilloscope together with the wavelength locker signal. Typical spectra for both polarizations, collected in this case from a resonator with a diameter of , are shown in Fig. 2. The spectra with different polarizations were measured at the same physical position along the fiber.
3 Method and results
Once the spectra are measured, we can extract the resonance wavelength of different WGMs by locating their wavelengths of minimum transmission (i.e. the bottom of the corresponding transmission dip). With the resonant wavelengths determined, we can now identify the radial mode number , the azimuthal mode number and the polarization (transverse electric, TE, or transverse magnetic, TM, where we define the transverse direction to be along the long axis of the fiber).
To determine the mode numbers and polarization, we use the transcendental equation for a two-dimensional disk[22],
| (1) |
where is the refractive index, and or for TE and TM polarizations, respectively; is the free space wavenumber where corresponds to the resonance wavelength, is the resonator radius, and are the -order cylindrical Bessel and Hankel function of first kind, respectively, with the prime denoting a derivative with respect to the argument and for the left hand side and right hand side, respectively. The order of the Bessel and Hankel functions corresponds to the azimuthal mode number . Solutions to this equation for fixed parameters correspond to different radial mode numbers (with the number increasing as the solution increases), and give the dimensionless product of the mode. Each resonant WGM, with given polarization and mode numbers, corresponds to a particular solution of Eq. 1.
Identifying for a resonance can be done by comparing the free spectral ranges (FSRs) of different mode families. For a given value of , the FSR is very well approximated as constant for a small range of . This was used to identify which modes have the same , differing only by . It can easily be shown by Eq.1 that modes with smaller have smaller FSR. Conceptually, this can be understood by the modes with larger passing closer the center of the fiber, therefore having a smaller effective radius and larger FSR. We can therefore determine the mode families by ordering them by increasing FSR, starting with for the lowest mode family.
To determine , we consider two distinct resonant modes (with the same polarization) and , with corresponding resonance wavelengths and . The ratio between the wavelengths is also equal to the inverse ratio of the corresponding solutions to Eq. 1:
| (2) |
Taking estimated values for the fiber refractive index, we can find solutions for Eq. 1 for pairs of values and , where plausible values of are estimated from [18]. The value of for which the ratio is closest to the experimentally measured one is then our “best fit" for the mode.
We measured the spectra for two different fibers: the first was a Vitrocom CV0508 borosilicate hollow glass tubing with walls and a nominal outer diameter of 80 m, and the second a nominal -diameter Corning LEAF optical fiber. Despite the former being hollow, the modes used in this experiment did not have significant spatial overlap with the hollow region of the tube for all the observed , such that Eq. 1 accurately describes them. We use these two fibers to demonstrate that the results are similar for resonators of different size, materials, and manufacturers.
As an example, we choose the resonant wavelengths of the dips marked by arrows in Fig. 2, which correspond to modes with , where we identified using the FSR, as described previously, and by counting the number of dips between the two chosen modes.
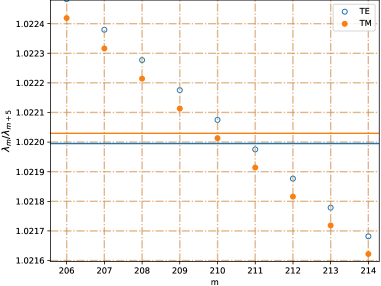
Fig. 3 shows the result from calculating the ratio between solutions to the transcendental equation for two modes with and as a function of , for both polarizations. The horizontal lines indicate the experimental values for the ratio (Eq. (2)) and the dots represent each numerically calculated ratio. The points closest to the experimental values then determine the value of and the polarization (in this case, for TE and for TM). The same calculation was then repeated for the other radial modes visible in the spectrum. The initial refractive indices were chosen to be the values given in the corresponding datasheets: 1.473 for the for the nominally fibers[23] and 1.4693 for the nominally fiber[24]. These values are only estimates since they do not correspond to the measured wavelength, and the quoted value for the fiber corresponds to the group index of the core. This means that the values for we just found are also only estimates, which still need to be corrected.
Once all the mode numbers are calculated, we can determine by first calculating the root of Eq. (1) for the corresponding set of mode numbers and polarization, and then dividing this value by the measured . If we initially assume the same as before and no chromatic dispersion, the measured values of the diameter, which equals twice the radius as a function of are plotted in Fig. 4a) and e) for the 80 m and 125 m diameter fibers, respectively.
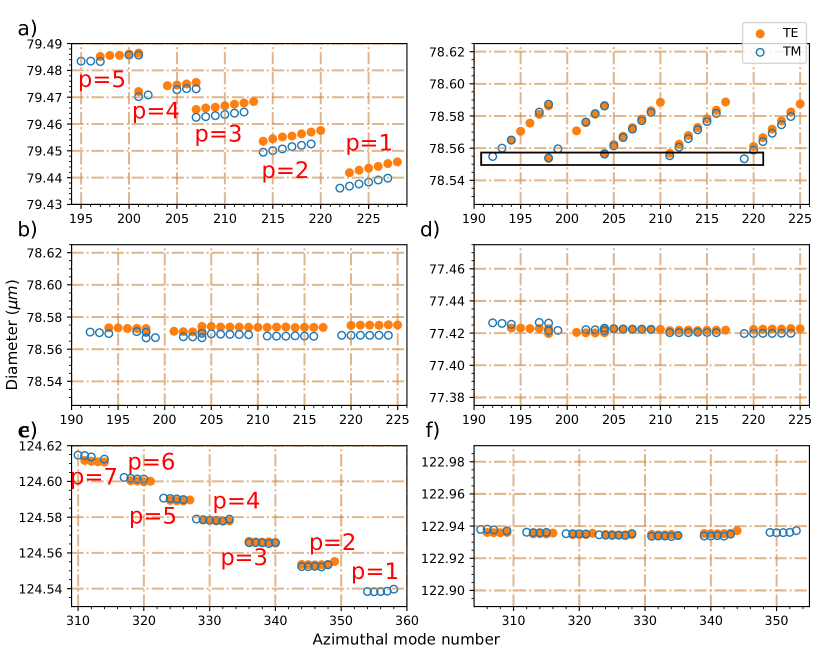
We see that the estimated values for the diameter differ substantially, as expected given that the refractive index was initially estimated and the chromatic dispersion was neglected. Since the spectra were taken all at the same physical position, we can safely assume that the obtained diameter should be the same for all modes. Thus, we are now tasked with varying the parameters until all the modes result in the same diameter. We first note, as noticeable in Fig 4a), that the results for different modes are grouped by common , and that the measured diameter increases with increasing . This staircase-like structure is a consequence of our estimated when calculating in Eq. 2 and our neglect of chromatic dispersion. We can correct this by varying until modes with similar wavelength and the same polarization agree on the calculated diameter, leading to Fig.4b) where the black box indicates a group of modes with similar wavelength. The increasing slopes seen within each group of radial modes can then be corrected by varying the chromatic dispersion (which we assume to be linear, a valid assumption for a relatively narrow bandwidth away from material resonances) until all the modes of the same polarization agree, as shown in Fig 4c). These values agree well with the typical dispersion of glasses[25]. At this stage, we have already corrected the values and included chromatic dispersion, but we have not found the correct value of the base refractive index yet. Observing that the dependence of Eq. 1 on is different for both polarizations, we can vary the base refractive index until the average radius for each polarization is the same. The final values of the diameter for the analyzed modes are shown in Fig. 4d) and f). The final values for the fiber parameters are displayed in Table 1.
| m fiber | m fiber | |
|---|---|---|
| Diameter (m) | ||
| (nm-1) |
4 Outlook
One of the limiting factors of this method is the reliance on the resonator being circular. The method could be improved to handle fibers with significant eccentricity by modeling the fiber as a cylinder with an elliptical cross section, replacing the Bessel equation with the Mathieu equation and use a new transcendental “characteristic" equation[26] This would add an extra degree of freedom that would need to be determined to further minimize the standard error in these values.
When WGMs are used for sensing, the changes in the physical environment will often cause a shift in the wavelength due to due to a combination of changing radius and refractive index[27]. Since by looking at a single mode we cannot differentiate between changes in radius and refractive index, this often means only one physical property can be sensed at a time. It is possible to measure more than one property by using more than one mode, such as changes in refractive index and temperature using two modes with orthogonal polarization[28], through a sensitivity matrix. The method introduced here could be used to generalize this to a larger number of properties monitored through the same measurements.
5 Conclusion
In this work we developed a non-destructive method to determine the mode number, refractive index, and radius of a cylindrical resonator with a circular cross-section based on spectral measurements of many resonant modes with two orthogonal polarizations. We demonstrated this method using two different fibers that differed in their size and material. The fiber diameters were determined with an accuracy of 2 nm, and the refractive indices to an accuracy of 0.00002. The accuracy of the measurement was limited by the modeling of the fiber as a circle and suggested methods that could improve on this work and how it could be used to improve sensing.
Funding This work was funded with the support of National Science and Engineering Research Council of Canada (NSERC) through the Discovery Grant program, and the Centre d’Optique, Photonique et Laser (COPL). \bmsectionDisclosures The authors declare no conflicts of interest. \bmsectionData availability Data underlying the results presented in this paper are not publicly available at this time but may be obtained from the authors upon reasonable request. \bmsectionSupplemental document See Supplement 1 for supporting content.
References
- [1] Z. Fang, K. Chin, R. Qu, and H. Cai, Fundamentals of optical fiber sensors, vol. 226 (John Wiley & Sons, 2012).
- [2] J. Lou, Y. Wang, and L. Tong, “Microfiber optical sensors: A review,” \JournalTitleSensors 14, 5823–5844 (2014).
- [3] G. P. Agrawal, “Optical fibers,” in Fiber-optic communication systems, (John Wiley & Sons, 2012), pp. 24–74.
- [4] A. A. Savchenkov, V. S. Ilchenko, A. B. Matsko, and L. Maleki, “Kilohertz optical resonances in dielectric crystal cavities,” \JournalTitlePhysical Review A 70, 051804 (2004).
- [5] Y. Yang, S. Saurabh, J. M. Ward, and S. Nic Chormaic, “High-q, ultrathin-walled microbubble resonator for aerostatic pressure sensing,” \JournalTitleOptics express 24, 294–299 (2016).
- [6] C.-H. Dong, L. He, Y.-F. Xiao, V. Gaddam, S. Ozdemir, Z.-F. Han, G.-C. Guo, and L. Yang, “Fabrication of high-q polydimethylsiloxane optical microspheres for thermal sensing,” \JournalTitleApplied physics letters 94, 231119 (2009).
- [7] V. A. Bogatyrev, V. I. Vovchenko, I. K. Krasyuk, V. A. Oboev, A. Y. Semenov, V. A. Sychugov, and V. P. Torchigin, “Change in the spectrum of optical whispering-gallery modes in a quasi-cylindrical microresonator caused by an acoustic pressure pulse,” \JournalTitleQuantum electronics 32, 471 (2002).
- [8] W. Liang, V. S. Ilchenko, A. A. Savchenkov, E. Dale, D. Eliyahu, A. B. Matsko, and L. Maleki, “Resonant microphotonic gyroscope,” \JournalTitleOptica 4, 114–117 (2017).
- [9] F. Vollmer, D. Braun, A. Libchaber, M. Khoshsima, I. Teraoka, and S. Arnold, “Protein detection by optical shift of a resonant microcavity,” \JournalTitleApplied physics letters 80, 4057–4059 (2002).
- [10] A. Ksendzov, M. Homer, and A. Manfreda, “Integrated optics ring-resonator chemical sensor with polymer transduction layer,” \JournalTitleElectronics Letters 40, 63–65 (2004).
- [11] X. Jiang, A. J. Qavi, S. H. Huang, and L. Yang, “Whispering-gallery sensors,” \JournalTitleMatter 3, 371–392 (2020).
- [12] P. Del’Haye, A. Schliesser, O. Arcizet, T. Wilken, R. Holzwarth, and T. J. Kippenberg, “Optical frequency comb generation from a monolithic microresonator,” \JournalTitleNature 450, 1214–1217 (2007).
- [13] S. Arnold, D. Keng, S. Shopova, S. Holler, W. Zurawsky, and F. Vollmer, “Whispering gallery mode carousel–a photonic mechanism for enhanced nanoparticle detection in biosensing,” \JournalTitleOptics Express 17, 6230–6238 (2009).
- [14] S. Spillane, T. Kippenberg, and K. Vahala, “Ultralow-threshold raman laser using a spherical dielectric microcavity,” \JournalTitleNature 415, 621–623 (2002).
- [15] I. S. Grudinin, A. B. Matsko, and L. Maleki, “Brillouin lasing with a CaF2 whispering gallery mode resonator,” \JournalTitlePhysical review letters 102, 043902 (2009).
- [16] W. Stewart, “Optical fiber and preform profiling technology,” \JournalTitleIEEE Transactions on Microwave Theory and Techniques 30, 1439–1454 (1982).
- [17] G. Ghosh, “Sellmeier coefficients and dispersion of thermo-optic coefficients for some optical glasses,” \JournalTitleApplied optics 36, 1540–1546 (1997).
- [18] T. Birks, J. Knight, and T. Dimmick, “High-resolution measurement of the fiber diameter variations using whispering gallery modes and no optical alignment,” \JournalTitleIEEE Photonics Technology Letters 12, 182–183 (2000).
- [19] M. Sumetsky and Y. Dulashko, “Radius variation of optical fibers with angstrom accuracy,” \JournalTitleOptics letters 35, 4006–4008 (2010).
- [20] T. C. Preston and J. P. Reid, “Determining the size and refractive index of microspheres using the mode assignments from mie resonances,” \JournalTitleJOSA A 32, 2210–2217 (2015).
- [21] J. Ward, A. Maimaiti, V. H. Le, and S. Nic Chormaic, “Contributed review: Optical micro-and nanofiber pulling rig,” \JournalTitleReview of Scientific Instruments 85, 111501 (2014).
- [22] P. Bianucci, J. Rodriguez, C. Clements, J. Veinot, and A. Meldrum, “Silicon nanocrystal luminescence coupled to whispering gallery modes in optical fibers,” \JournalTitleJournal of Applied Physics 105, 023108 (2009).
- [23] Schott, Duran (2017). Datasheet PT_TTS_1019 GB.
- [24] Corning, Corning LEAF Optical FiberPro (2019). Datasheet PI1107.
- [25] R. E. Stephens and W. S. Rodney, “Refractive indices of five selected optical glasses,” \JournalTitleJournal of Research of the National Bureau of Standards 52, 303 (1954).
- [26] C. Yeh and F. I. Shimabukuro, The essence of dielectric waveguides (Springer, 2008).
- [27] M. R. Foreman, J. D. Swaim, and F. Vollmer, “Whispering gallery mode sensors,” \JournalTitleAdvances in optics and photonics 7, 168–240 (2015).
- [28] P. Liu and Y. Shi, “Simultaneous measurement of refractive index and temperature using a dual polarization ring,” \JournalTitleAppl. Opt. 55, 3537–3541 (2016).