Identifying diverging-effective mass in MOSFET and 3He systems111This was presented and accepted in ICEIC 2022 Conference held on 6th9th of February in 2022 at Grand Hyatt Jeju in Republic of Korea.
Abstract
Emerging devices such as a neuromorphic device and a qubit can use the Mott transition phenomenon, but in particular, the diverging mechanism of the phenomenon remains to be clarified. The diverging-effective mass near Mott insulators was measured in strongly correlated Mott systems such as a fermion 3He and a Si metal-oxide-semiconductor-field-effect transistor, and is closely fitted by the effective mass obtained by the extension of the Brinkman-Rice(BR) picture, when 1), where , correlation strength is , band-filling is . Its identification is a percolation of a constant mass in the Brinkman-Rice picture. Over is evaluated.
Keywords: Insulator-Metal Transition, Mott insulator, diverging-effective mass, Brinkman-Rice picture
I. INTRODUCTION
The diverging-effective mass (DEM) in a strongly correlated metallic Mott system [1] is evidence of strong correlation between fermions that often occurs in condensed phenomena such as superconductivity, superfluid, the Mott transition, and a fractional quantum Hall effect. The characteristics of the DEM can be very important to reveal the mechanism of the phenomena.
Although the DEM has been measured in materials such as Sr1-xLaxTiO3 [2], VO2 [3] a 2-dimensional (dim) fermion 3He [4, 5], a dilute 2-dim metal-oxide-semiconductor-field-effect transistor (MOSFET)[6], and a superconductor YBa2Cu3O6+x [7], the identification of the DEMs still remains to be revealed [8].
II. PROPOSED METHOD
Here, the metal-insulator transition (MIT) theory with the DEM is briefly reviewed for less than and one electron per atom. The DEM, the inverse of discontinuity,, at [1], means the increase of the number of carriers outside ,
| (1) |
This can be satisfied when the Coulomb-repulsion ratio 01, band filling , correlation strength 01 when =1 half filling.
In these expressions, is the carrier density in the metal region, is the number of all atomic sites in the
measurement region, and is the critical Coulomb interaction [1][9, 10].
Eq. (1) was derived by an extension of the Brinkman-Rice (BR) picture using a fractional effective charge (or fractron), , averaged over all atomic sites in the measurement region [9, 10, 11]. The Mott insulator at =1 is assumed when 1. Existence of a DEM in a hole-doping region where (about 0.02 from Mott criterion [12]) can be seen as a hole-driven Mott MIT.
Eq. (1) gives a measurable quantity that represents the average of the true in the BR picture. Moreover, the BR picture [1] was also confirmed in the metallic side of Hubbard model [13].
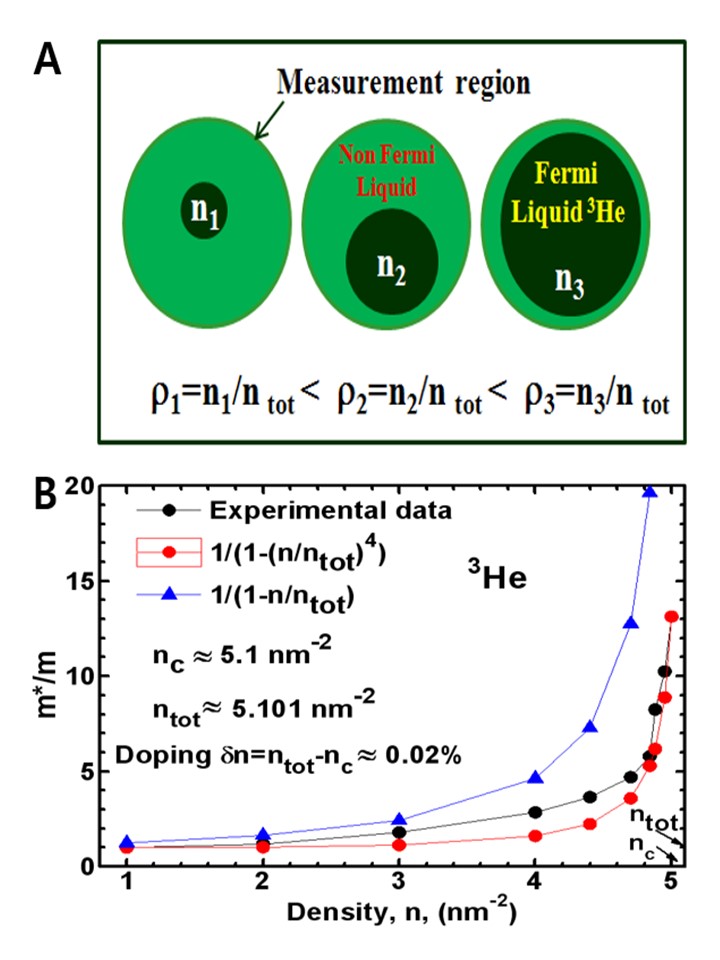
The DEM was observed in 3He at high density [4], which is a prototype system for the strongly correlated system. This is explained in Figs. 1A and 1B, which shows that the quantity increases as the 3He density increases (where ). The increasing induces a DEM, as per Eq. (1), which closely fits the experimental data (Fig. 1B).
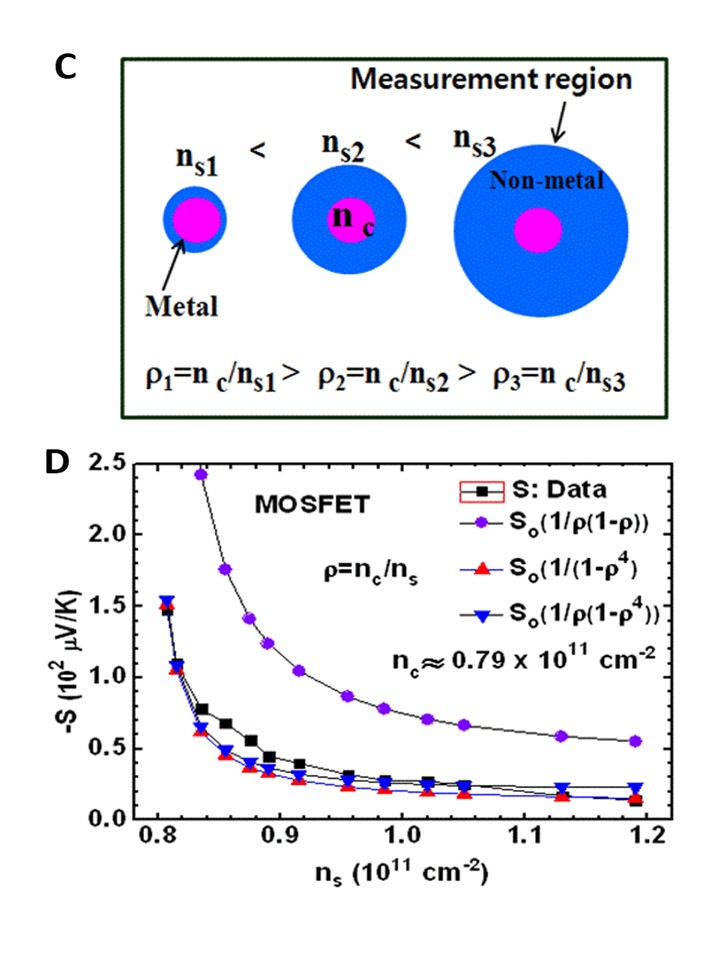
Another example helps clarify the diverging thermoelectric power measured in Si-MOSFET systems [6]. As the carrier density decreases, increases (Fig. 2C). This is why the extent of metal region is constant (about 0.02) - because a conducting path with lower resistance is formed in the channel of MOSFET after the insulator-to-metal transition occurs. The DEM data for this system [4] are closely fitted by Eq. (1) (Fig. 2D).
III. CONCLUSIONS
In conclusion, the DEM identified in many Mott systems is the effect of measurement due to inhomogeneity and percolation phenomenon. The true value of the DEM in such systems is the renormalized constant mass in the BR picture[1]. The correlation strengths in 3He and MOSFET systems associated with the DEM are 0.96 (13) determined from in assuming 0.98 when 1. This reveals that the 3He system and the MOSFET system are strongly correlated. Diverging in thermoelectric power is also attributed to the DEM. The Mott transition near =1 can be used for future emerging devices such as a neuromorphic device and a qubit.
ACKNOWLEDGEMENTS
This work was supported by Institute of Information and Communications Technology Planning and Evaluation (IITP) grant funded by the Korean government (MSIT) via Grant 2017-0-00830. I acknowledge Y. S. Lee, T. Nishio, T. Driscoll, S. Kravchenko for valuable comments. Parts of this research were presented in 2013 APS March Meeting, Abstract: U19.00007 : Fitting of Diverging Thermoelectric Power in a Strongly Interacting 2D Electron System of Si-MOSFETs,, and 2012 APS March Meeting, Abstract: A16.00015 : Fitting of m*/m with Divergence Curve for 3He Fluid Monolayer using Hole-driven Mott Transition,.
References
- [1] W. F. Brinkman and T. M. Rice, Application of Gutzwiller’s variational method to the metal-insulator transition, Phys. Rev. B 2, 10, 4302 (1970).
- [2] Y. Tokura, Y. Taguchi, Y. Okada, Y. Fujishima, T. Arima, K. Kumagai, and Y. Iye, Filling dependence of electronic properties on the verge of metal–Mott-insulator transition in Sr1-xLaxTiO3, Phys. Rev. Lett. 70, 2126 (1993).
- [3] M. M. Qazilbash et al., Mott Transition in VO2 Revealed by Infrared Spectroscopy and Nano-Imaging, Science 318, 1750 (2007).
- [4] A. Casey, H. Patel, J. Nyéki, B. P. Cowan, J. Saunders, Evidence for a Mott-Hubbard Transition in a Two-Dimensional 3He Fluid Monolayer,Phys. Rev. Lett. 90, 115301 (2003).
- [5] M. Neumann, J. Nyéki, B. Cowan, J. Saunders, Bilayer 3He: a simple two-dimensional heavy-fermion system with quantum criticality,Science 317, 1356 (2007).
- [6] A. Mokashi, S. Li, B. Wen, S. V. Kravchenko, A. A. Shashkin, V. T. Dolgopolov, and M. P. Sarachik, Critical Behavior of a Strongly Interacting 2D Electron System, Phys. Rev. Lett. 109, 096405 (2012).
- [7] E. Sebastian et al., Metal-insulator quantum critical point beneath the high Tc superconducting dome, PNAS 107 (14), 6175-6179 (2010).
- [8] B. Spivak, S. V. Kravchenko, S. A. Kivelson, and X. P. A. Gao, Colloquium: Transport in strongly correlated two dimensional electron fluids, Rev. Mod. Phys. 82, 1743 (2010).
- [9] H.-T. Kim, Extension of the Brinkman-Rice picture and the Mott transition, Physica C: Superconductivity 341-348, 1, 259-260 (2000). arXiv preprint cond-mat/0001008.
- [10] H.-T. Kim, Extended Brinkman-Rice Picture and its Application to High-Tc Superconductors, .
- [11] H.-T. Kim, B.-J. Kim, Y. W. Lee, B.-G. Chae, S. J. Yun, K.-Y. Kang, Hole-driven MIT theory, Mott transition in VO2, MoBRiK device, Physica C 1076, 460-462 (2007).
- [12] H.-T. Kim, B.-G. Chae, D.-H. Youn, S.-L. Maeng, G. Kim, K.-Y. Kang, Y.-S. Lim, Mechanism and observation of Mott transition in VO2-based two- and three-terminal devices,New J. Phys. 6, 52 (2004).
- [13] X. Y. Zhang, M. J. Rozenberg, G. Kotliar, Mott transition in the Hubbard model at zero temperature, Phys. Rev. Lett. 70, 1666 (1993).