Synthesized Speech Detection Using Convolutional
Transformer-Based Spectrogram Analysis
Abstract
Synthesized speech is common today due to the prevalence of virtual assistants, easy-to-use tools for generating and modifying speech signals, and remote work practices. Synthesized speech can also be used for nefarious purposes, including creating a purported speech signal and attributing it to someone who did not speak the content of the signal. We need methods to detect if a speech signal is synthesized. In this paper, we analyze speech signals in the form of spectrograms with a Compact Convolutional Transformer (CCT) for synthesized speech detection. A CCT utilizes a convolutional layer that introduces inductive biases and shared weights into a network, allowing a transformer architecture to perform well with fewer data samples used for training. The CCT uses an attention mechanism to incorporate information from all parts of a signal under analysis. Trained on both genuine human voice signals and synthesized human voice signals, we demonstrate that our CCT approach successfully differentiates between genuine and synthesized speech signals.
Index Terms:
machine learning, deep learning, signal processing, image processing, spectrogram analysis, synthesized audio detection, spoof, convolution, transformer, neural networksI Introduction
We hear more synthesized voices in our daily lives than ever before. Voice assistants, such as Apple’s Siri, Amazon’s Alexa, Microsoft’s Cortana, and Google’s Assistant, use synthesized human speech to communicate with us in our homes [1, 2]. Virtual assistants answer customer service phone numbers and create synthetic voices as they assist us. Applications use text-to-speak (TTS) methods to generate audio signals to speak text messages for users with poor vision. Social media platforms offer tools to generate speech that sounds like a specific person, such as a friend, an actor, or a politician. Although all of these features can be used for innocuous purposes, they can also easily be used to create authentic-sounding speech for more malicious ambitions.
Attackers may create a purported speech signal and attribute it to someone who never delivered that message. In 2021, Goldman Sachs stopped a $40 million investment in a company when employees realized they were meeting with an impersonator using synthesized speech on a conference call [3]. Although standalone synthesized speech replicating a specific target’s voice can do a lot of damage on its own, its impact can be even greater when the synthesized speech is paired with other data modalities. When manipulated video accompanies synthetic speech signals, such as in deepfakes, the potential to influence public opinion and current events is even higher [4, 5]. Because many easy-to-use tools exist for modifying multimedia with high quality, the quantity of manipulated media increases exponentially [6]. We need methods to detect if speech signals are synthesized or genuine.
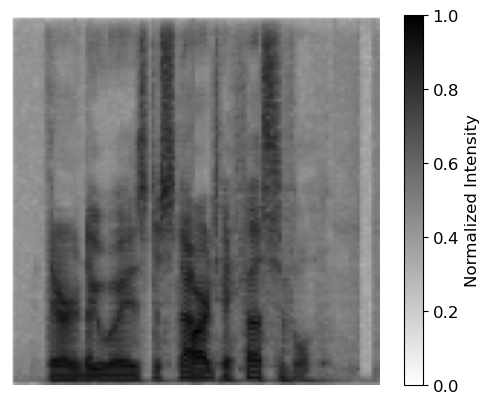
In this paper, we present a method to detect synthesized speech from spectrograms. Spectrograms have been used for a variety of audio tasks to identify events, transfer a signal into a new style, and detect emotion [7, 8, 9, 10, 11, 12]. They are effective visualizations of speech signals because they show the relationship between time, frequency, and intensity of an audio signal. Spectrograms are constructed using the Fast Fourier Transform (FFT), a variant of the Discrete Fourier Transform (DFT) [7]. The FFT divides speech signals into shorter temporal subsequences (sometimes known as frames). The DFT of each temporal segment is computed to obtain the DFT frequency coefficients for each temporal segment. The magnitudes of the DFT coefficients are aligned side-by-side to create a spectrogram. A spectrogram of a speech signal used in our approach is shown in Figure 1. In this paper, we treat spectrograms as images and use a convolutional transformer-based approach to determine if the speech signals shown in the spectrograms are synthesized.
II Related Work
In order to detect synthetic speech, various machine learning methods convert speech signals into different representations. Chen et al. use a Multilayer Perceptron Network (MLP), ResNet-based Convolutional Neural Network (CNN), Long Short-Term Memory network (LSTM), Gated Recurrent Unit network (GRU), and Recurrent Neural Network (RNN) to detect spoofed speech [13, 14]. For these methods, the speech waveforms are converted to sequences of coefficients – specifically Constant Q Cepstral Coefficients (CQCCs) [15] or Mel Frequency Cepstral Coefficients (MFCCs) [16, 17, 18] – and analyzed by the various neural networks. Chintha et al. use a CNN-LSTM model to analyze speech signals directly, rather than converting them to different coefficient representations [19]. The authors also explore working with log-melspectrograms, which are spectrograms in which the frequency domain content is mapped to the mel scale [16]. The log-melspectrograms are analyzed with a CNN to detect synthesized and genuine audio. For our approach, we utilize spectrograms because many methods striving to perform a variety of tasks achieve success with signals represented as spectrograms [7, 8, 9, 10, 11, 12].
Although prior work relies heavily on Convolutional Neural Networks (CNNs), recent developments in deep learning indicate that convolutions may not be necessary to effectively analyze images [20, 21]. These methods succeed in image classification tasks without inductive biases provided by convolutions. Inspired by the success of attention mechanisms in Natural Language Processing (NLP) [22], Vision Transformer (ViT) analyzes patches of an image with an attention mechanism for image classification tasks [20]. Hassani et al. adopt concepts from CNNs and ViT to create a Compact Convolutional Transformer (CCT) [23]. CCT leverages the inductive biases and efficiencies of parameter-sharing that convolutions provide to succeed at machine learning tasks with smaller-sized datasets compared to the datasets used with ViT. It also leverages the attention mechanism of transformers to capture long-range dependencies in images. CCT combines the power of convolutions with the power of transformers. We utilize a CCT trained on spectrograms showing genuine and synthesized speech signals to identify synthesized speech.
III Proposed Method
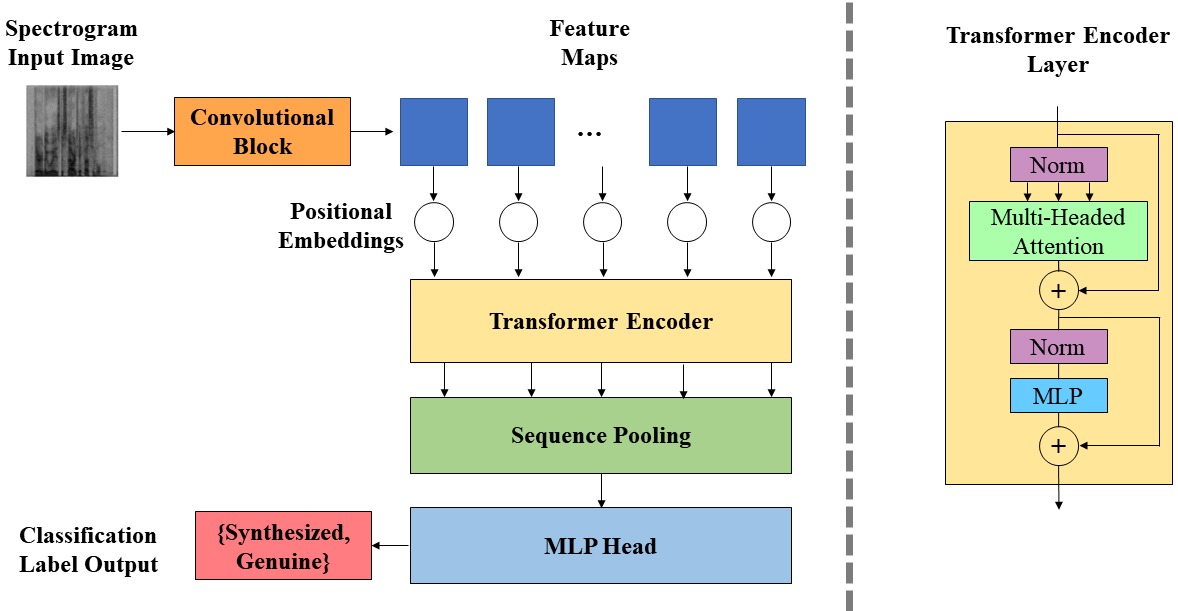
Figure 2 shows an overview of our approach, known as the Compact Convolutional Transformer (CCT). The CCT uses a standard transformer encoder, as used in [22, 20]. However, CCT introduces two new features – a convolutional image encoding block and a sequence pooling layer – that replace operations in standard transformer approaches. The CCT first uses a convolutional block (i.e., a series of convolutional layers) to embed an input image into a latent space. In our experiments, we utilize two convolutional layers with a kernel of size 3x3, a ReLU activation function, and max pooling. The first and second convolutional layers produce sets of 64 and 128 feature maps, respectively. We use this convolutional block instead of the standard transformer practice of dividing input images into non-overlapping patches, which contain only local image information and fail to preserve information at patch boundaries. The feature maps contain aggregate information from all regions of an image, so they are more salient inputs to the transformer encoder. Because they result from convolution operations, they also introduce inductive biases to the network. This enables the transformer to train more efficiently, which is highly important on smaller-sized datasets. Next, we row concatenate each of the 128 2D feature maps (sized 32x32) into a vector of length 1024, creating the tokens analyzed by the transformer encoder. We use positional embedding (a standard practice in transformers) for each token so that the transformer understands how they relate spatially [20, 24].
Next, CCT analyzes the tokens with the transformer encoder, which consists of two transformer encoder layers. Each transformer encoder layer contains the multi-headed attention mechanism that captures long-range dependencies between different parts of the input. The transformer encoder layers are modeled after typical attention-based layers [20, 22]. Then, sequence pooling occurs on the outputs of the transformer encoder. The pooling operation smooths the sequence of outputs so that the MLP Head can correctly detect whether the speech signal under analysis is synthesized or genuine. Sequence pooling also eliminates the need for an extra token (i.e., a classification token) that other transformers use [20, 24]. With sequence pooling, the model no longer needs to track the classification token throughout its layers.
| ASVspoof2019 Dataset | |||
| Subset | Synthesized | ||
| Audio Tracks | Genuine | ||
| Audio Tracks | Total | ||
| Audio Tracks | |||
| Training | 22,800 | 2,580 | 25,380 |
| Validation | 22,296 | 2,548 | 24,844 |
| Testing | 63,882 | 7,355 | 71,237 |
| Total | 108,978 | 12,483 | 121,461 |
IV Experimental Results
We utilize the ASVspoof2019 dataset [25] in our experiments. The dataset – introduced in ASVspoof2019: Automatic Speaker Verification Spoofing and Countermeasures Challenge [26] – contains genuine speech signals spoken by humans as well as synthesized speech signals. The synthesized speech signals were generated with neural acoustic models and deep learning methods, including LSTMs [27] and Generative Adversarial Networks (GANs) [28]. The ASVspoof2019 dataset is heavily imbalanced, with significantly more synthesized speech signals than genuine speech signals. We utilize the official dataset split according to the challenge for training, validating, and testing our approach. Table I summarizes the details of the dataset.
We convert speech waveforms from the dataset into spectrograms by following a similar procedure as described in [29]. More specifically, we use the Fast Fourier Transform (FFT) to compute Fourier coefficients of signals in our dataset. The FFT operates on blocks of the signals consisting of 512 sampled points with 128 points of overlap between consecutive blocks. Then, the Fourier coefficients are converted to decibels and organized in 2D arrays to construct the spectrograms. We represent each spectrogram with a matrix of 128x128 values. Note that these spectrograms are larger than those used in our previous approach [29]. The larger spectrograms have higher resolution, which preserves more details of speech signals for the synthesized speech detector. Next, we perform min-max normalization on the intensity values, mapping the spectrogram intensities to the range of values [0,1]. Normalized values enable machine learning models to learn more quickly because they are forced to focus on relative rather than absolute differences in input values. Figure 1 shows an example of a grayscale, normalized spectrogram that is analyzed by the CCT.
To validate our approach, we compare it against several other methods. First, we establish three baseline methods: Baseline-Minority, Baseline-Majority, and Baseline-Prior. Baseline-Minority is a classifier that only predicts that speech signals belong to the minority class – in this case, the genuine category. Baseline-Majority is a classifier that does the opposite. It only predicts that speech signals belong to the synthesized class. Considering the significant class imbalance in the dataset, we expect Baseline-Minority to have the worst performance of all methods. Meanwhile, Baseline-Majority establishes a threshold above which a classifier actually performs well. Baseline-Prior is the final baseline classifier. It randomly assigns a label to a signal under analysis according to the known distribution of genuine vs. synthesized samples in the training data split. In addition to these baselines, we investigate the effectiveness of a K-Nearest Neighbors classifier [30, 31], a Support Vector Machine (SVM) [32], and logistic regression [33] on this task. These methods operate on row concatenated versions of the 128x128-sized spectrograms (i.e., vectors of length 16,384). Finally, we compare our results to our previous synthesized speech detection method that utilizes a CNN [29]. We report the performance of the CNN on the smaller-sized spectrograms (dimensions 50x34 pixels) as well as the the new, larger-sized spectrograms (dimensions 128x128).
| Method | Accuracy | Precision | Recall | F-1 | Balanced Accuracy | ROC AUC | PR AUC |
| Baseline-Minority | 10.32% | 1.07% | 10.32% | 1.93% | 50.00% | 0.5000 | 0.1032 |
| Baseline-Prior | 81.59% | 81.46% | 81.59% | 81.52% | 49.94% | 0.4994 | 0.1032 |
| Baseline-Majority | 89.68% | 80.42% | 89.68% | 84.79% | 50.00% | 0.5000 | 0.1032 |
| KNN | 89.45% | 84.99% | 89.45% | 85.57% | 52.08% | 0.6751 | 0.2643 |
| Logistic Regression | 80.60% | 91.76% | 80.60% | 83.98% | 84.41% | 0.9041 | 0.4101 |
| CNN-50x34 | 85.59% | 90.50% | 85.59% | 87.35% | 79.26% | 0.9052 | 0.4649 |
| SVM | 89.93% | 90.94% | 89.93% | 85.25% | 50.47% | 0.9113 | 0.5023 |
| CNN-128x128 | 85.27% | 93.21% | 85.27% | 87.60% | 89.22% | 0.9416 | 0.6278 |
| CCT | 92.13% | 93.79% | 92.13% | 92.70% | 87.78% | 0.9646 | 0.7501 |
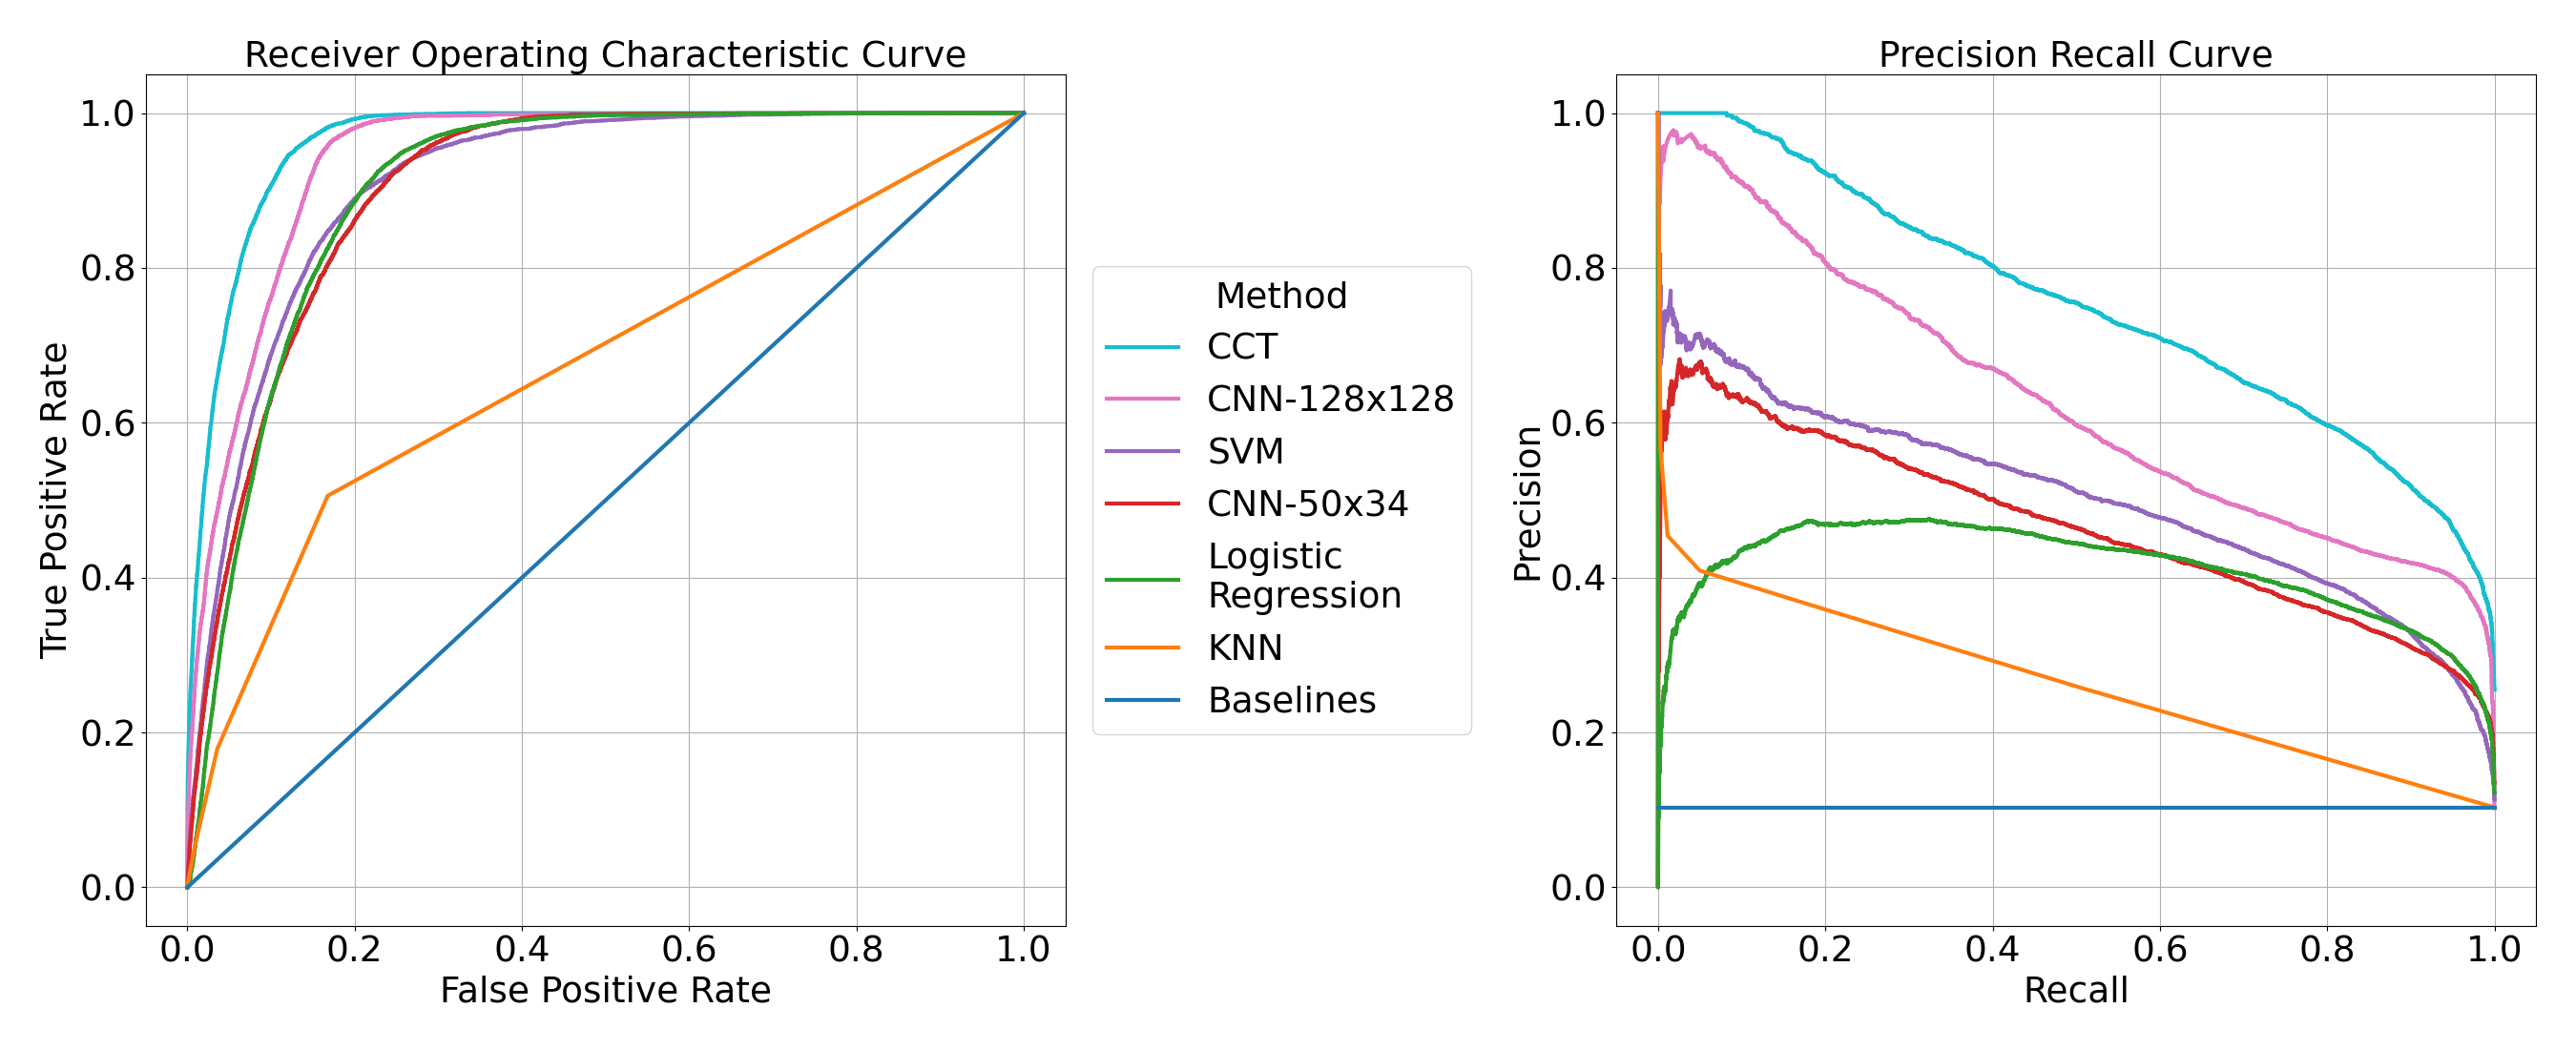
Table II and Figure 3 show the results of all approaches. We report accuracy, weighted precision, weighted recall, weighted F-1, Balanced Accuracy, Receiver Operating Characteristic Area Under the Curve (ROC AUC), and Precision Recall Area Under the Curve (PR AUC) [34, 35]. Weighted metrics are computed with a weighted average of each metric obtained on the two classes, where weights reflect the dataset class imbalance. Results indicate that the CCT approach outperforms all other methods by a clear margin. It achieves the highest metrics of all methods considered. Although the CCT performs better than our previously proposed CNN, the CNN achieves the second highest performance when trained on spectrograms of size 128x128 pixels. Overall, the two neural network approaches perform the best.
Results confirm that both larger input images and the new model contribute to better performance. Comparing the results of CNN-50x34 and CNN-128x128, we observe that balanced accuracy, ROC AUC, and PR AUC increase when the CNN is trained and evaluated on larger, higher-resolution inputs. In this case, the CNN is presented with more detailed input images that allow it to better discriminate genuine and synthesized speech signals. Comparing the results of CNN-128x128 and CCT, we observe that ROC AUC and PR AUC increase even more when an attention mechanism is used. The attention mechanism of the transformer determines the most important part of a spectrogram and focuses on that part of the image more so than the less discriminative regions, which aids in its detection capabilities. However, transformers have historically required very large-scale datasets in order to learn properly, suffering from a lack of inductive biases that CNNs have. Because we utilize convolutional layers, the CCT achieves a greater degree of shared weights, learns more efficiently, and leverages the inductive biases to achieve high success, even with fewer data samples from which to learn.
V Conclusion
This paper improves upon our previous work [29] to demonstrate the benefits of using higher-resolution spectrograms and an attention mechanism. We demonstrate that a neural network that utilizes both convolution and transformer capabilities achieves high success in detecting synthesized speech. Convolution operations convert a spectrogram input image into feature maps that contain salient information for discriminating synthesized and genuine human speech. It also enables a transformer to achieve high success with less data than transformers typically require.
Although this approach is promising, future work should consider more diverse speech features. For example, the method should be validated on data of different audio formats, compression levels, sampling rates, and durations. Since both the CNN and the CCT perform well, an ensemble of these two methods could be created and augmented with other neural networks. Finally, a speech analysis method such as this could be paired with methods that analyze media’s other data modalities. For example, our synthesized speech detector could analyze speech signals found in videos, while methods that analyze images and videos could analyze the visual content [36] [4] [37] [38]. A metadata analysis could strengthen this multi-modal approach even more [39].
Acknowledgment
This material is based on research sponsored by DARPA and Air Force Research Laboratory (AFRL) under agreement number FA8750-16-2-0173. The U.S. Government is authorized to reproduce and distribute reprints for Governmental purposes notwithstanding any copyright notation thereon. The views and conclusions contained herein are those of the authors and should not be interpreted as necessarily representing the official policies or endorsements, either expressed or implied, of DARPA and AFRL or the U.S. Government.
Address all correspondence to Edward J. Delp,
ace@ecn.purdue.edu.
References
- [1] M. B. Hoy, “Alexa, Siri, Cortana, and More: An Introduction to Voice Assistants,” Medical Reference Services Quarterly, vol. 37, no. 1, pp. 81–88, 2018.
- [2] S. Malodia, N. Islam, P. Kaur, and A. Dhir, “Why Do People Use Artificial Intelligence (AI)-Enabled Voice Assistants?” IEEE Transactions on Engineering Management, pp. 1–15, December 2021.
- [3] B. Smith, “Goldman Sachs, Ozy Media and a $40 Million Conference Call Gone Wrong,” The New York Times, September 2021, https://www.nytimes.com/2021/09/26/business/media/ozy-media-goldman-sachs.html.
- [4] A. Rössler, D. Cozzolino, L. Verdoliva, C. Riess, J. Thies, and M. Niessner, “FaceForensics++: Learning to Detect Manipulated Facial Images,” Proceedings of the IEEE/CVF International Conference on Computer Vision, August 2019, seoul, Korea.
- [5] R. Toews, “Deepfakes are Going to Wreck Havoc on Society. We are Not Prepared.” Forbes, May 2020.
- [6] H. Ajder, G. Patrini, F. Cavalli, and L. Cullen, “The State of Deepfakes: Landscape, Threats, and Impact,” Deeptrace Lab, September 2019.
- [7] L. Flanagan, “Speech Analysis, Synthesis and Perception,” Springer-Verlag, 1972.
- [8] P. Verma and J. Smith, “Neural Style Transfer for Audio Spectrograms,” Proceedings of the Conference on Neural Information Processing Systems, Workshop for Machine Learning for Creativity and Design, December 2017, long Beach, CA.
- [9] J. Dennis, H. D. Tran, and H. Li, “Spectrogram Image Feature for Sound Event Classification in Mismatched Conditions,” IEEE Signal Processing Letters, vol. 18, no. 2, pp. 130–133, 2011.
- [10] M. Stolar, M. Lech, R. S. Bolia, and M. Skinner, “Acoustic Characteristics of Emotional Speech Using Spectrogram Image Classification,” Proceedings the IEEE International Conference on Signal Processing and Communication Systems, December 2018, cairns, Australia.
- [11] S. Prasomphan, “Detecting Human Emotion via Speech Recognition by Using Speech Spectrogram,” Proceedings of the IEEE International Conference on Data Science and Advanced Analytics, October 2015, paris, France.
- [12] S. Prasomphan, “Improvement of Speech Emotion Recognition with Neural Network Classifier by Using Speech Spectrogram,” Proceedings of the International Conference on Systems, Signals and Image Processing, September 2015, london, UK.
- [13] Z. Chen, Z. Xie, W. Zhang, and X. Xu, “ResNet and Model Fusion for Automatic Spoofing Detection,” Proceedings of the Conference of the International Speech Communication Association, August 2017.
- [14] Z. Chen, W. Zhang, Z. Xie, X. Xu, and D. Chen, “Recurrent Neural Networks for Automatic Replay Spoofing Attack Detection,” Proceedings of the IEEE International Conference on Acoustics, Speech and Signal Processing, April 2018, calgary, Canada.
- [15] B. Bogert, M. Healy, and J. Tukey, “The Quefrency Alanysis of Time Series for Echoes: Cepstrum, Pseudo Autocovariance, Cross-Cepstrum and Saphe Cracking,” Proceedings of the Symposium on Time Series Analysis, vol. 15, pp. 209–243, June 1963, new York, NY.
- [16] S. Stevens, J. Volkmann, and E. Newman, “A Scale for the Measurement of the Psychological Magnitude Pitch,” Journal of the Acoustical Society of America, vol. 8, pp. 185–190, June 1937.
- [17] D. Purves and G. Fitzpatrick, “Neuroscience,” The Audible Spectrum, vol. 2nd Edition, 2001, sunderland, MA.
- [18] M. Sahidullah and G. Saha, “Design, Analysis, and Experimental Evaluation of Block Based Transformation in MFCC Computation for Speaker Recognition,” Speech Communication, vol. 54, pp. 543–565, May 2012.
- [19] A. Chintha, B. Thai, S. J. Sohrawardi, K. M. Bhatt, A. Hickerson, M. Wright, and R. Ptucha, “Recurrent Convolutional Structures for Audio Spoof and Video Deepfake Detection,” IEEE Journal of Selected Topics in Signal Processing, June 2020.
- [20] A. Dosovitskiy, L. Beyer, A. Kolesnikov, D. Weissenborn, X. Zhai, T. Unterthiner, M. Dehghani, M. Minderer, G. Heigold, S. Gelly, J. Uszkoreit, and N. Houlsby, “An Image is Worth 16x16 Words: Transformers for Image Recognition at Scale,” Proceedings of the International Conference on Learning Representations, May 2021.
- [21] I. Tolstikhin, N. Houlsby, A. Kolesnikov, L. Beyer, X. Zhai, T. Unterthiner, J. Yung, D. Keysers, J. Uszkoreit, M. Lucic, and A. Dosovitskiy, “MLP-Mixer: An all-MLP Architecture for Vision,” arXiv:2105.01601, May 2021.
- [22] A. Vaswani, N. Shazeer, N. Parmar, J. Uszkoreit, L. Jones, A. N. Gomez, L. Kaiser, and I. Polosukhin, “Attention is All You Need,” Proceedings of the Neural Information Processing Systems, December 2017.
- [23] A. Hassani, S. Walton, N. Shah, A. Abuduweili, J. Li, and H. Shi, “Escaping the Big Data Paradigm with Compact Transformers,” arXiv:2104.05704, 2021.
- [24] J. Devlin, M.-W. Chang, K. Lee, and K. Toutanova, “BERT: Pre-training of deep bidirectional transformers for language understanding,” in Proceedings of the Conference of the North American Chapter of the Association for Computational Linguistics: Human Language Technologies, Volume 1 (Long and Short Papers). Minneapolis, Minnesota: Association for Computational Linguistics, June 2019, pp. 4171–4186.
- [25] J. Yamagishi, M. Todisco, M. Sahidullah, H. Delgado, X. Wang, N. Evans, T. Kinnunen, K. Lee, V. Vestman, and A. Nautsch, “ASVspoof 2019: The 3rd Automatic Speaker Verification Spoofing and Countermeasures Challenge database,” University of Edinburgh. The Centre for Speech Technology Research, 2019.
- [26] M. Todisco, J. Yamagishi, M. Sahidullah, H. Delgado, X. Wang, N. Evans, T. Kinnunen, K. Lee, V. Vestman, and A. Nautsch, “ASVspoof 2019: Automatic Speaker Verification Spoofing and Countermeasures Challenge Evaluation Plan,” ASVspoof Consortium, January 2019.
- [27] S. Hochreiter and J. Schmidhuber, “Long Short-Term Memory,” Neural Computation, vol. 9, pp. 1735–1780, November 1997.
- [28] I. Goodfellow, J. Pouget-Abadie, M. Mirza, B. Xu, D. Warde-Farley, S. Ozair, A. Courville, and Y. Bengio, “Generative Adversarial Nets,” Proceedings of the Conference on Neural Information Processing Systems, vol. 27, 2014.
- [29] E. R. Bartusiak and E. J. Delp, “Frequency Domain-Based Detection of Generated Audio,” Proceedings of the IS&T Media Watermarking, Security, and Forensics Conference, Electronic Imaging Symposium, pp. 273(1)–273(7), January 2021.
- [30] B. W. Silverman and M. C. Jones, “E. Fix and J.L. Hodges (1951): An Important Contribution to Nonparametric Discriminant Analysis and Density Estimation: Commentary on Fix and Hodges (1951),” International Statistical Review / Revue Internationale de Statistique, vol. 57, no. 3, pp. 233–238, 1989.
- [31] T. Cover and P. Hart, “Nearest Neighbor Pattern Classification,” IEEE Transactions on Information Theory, vol. 13, no. 1, pp. 21–27, 1967.
- [32] C. Cortes and V. Vapnik, “Support-Vector Networks,” Machine Learning, vol. 20, pp. 272–297, 1995.
- [33] C. M. Bishop, “Probabilistic Discriminative Models,” in Pattern Recognition and Machine Learning. New York: Springer-Verlag, 2005, ch. 4.3, pp. 205–210.
- [34] A. Tharwat, “Classification assessment methods,” in Applied Computing and Informatics. Emerald Publishing Limited, December 2021, pp. 168–192.
- [35] J. Davis and M. Goadrich, “The Relationship between Precision-Recall and ROC Curves,” Proceedings of the International Conference on Machine Learning, pp. 233–240, 2006, pittsburgh, Pennsylvania, USA.
- [36] D. Montserrat, H. Hao, S. Yarlagadda, S. Baireddy, R. Shao, J. Horváth, E. R. Bartusiak, J. Yang, D. Güera, F. Zhu, and E. Delp, “Deepfakes Detection with Automatic Face Weighting,” Proceedings of the IEEE/CVF Conference on Computer Vision and Pattern Recognition Workshops, June 2020, seattle, Washington (Virtual).
- [37] D. Güera and E. Delp, “Deepfake Video Detection Using Recurrent Neural Networks,” Proceedings of the IEEE International Conference on Advanced Video and Signal-based Surveillance, November 2018, auckland, New Zealand.
- [38] E. R. Bartusiak, S. K. Yarlagadda, D. Güera, P. Bestagini, S. Tubaro, F. M. Zhu, and E. J. Delp, “Splicing Detection and Localization In Satellite Imagery Using Conditional GANs,” Proceedings of the IEEE Conference on Multimedia Information Processing and Retrieval, March 2019, san Jose, CA.
- [39] D. Güera, S. Baireddy, P. Bestagini, S. Tubaro, and E. Delp, “We Need No Pixels: Video Manipulation Detection Using Stream Descriptors,” Proceedings of the International Conference on Machine Learning, Synthetic-Realities: Deep Learning for Detecting AudioVisual Fakes Workshop, June 2019, long Beach, CA.